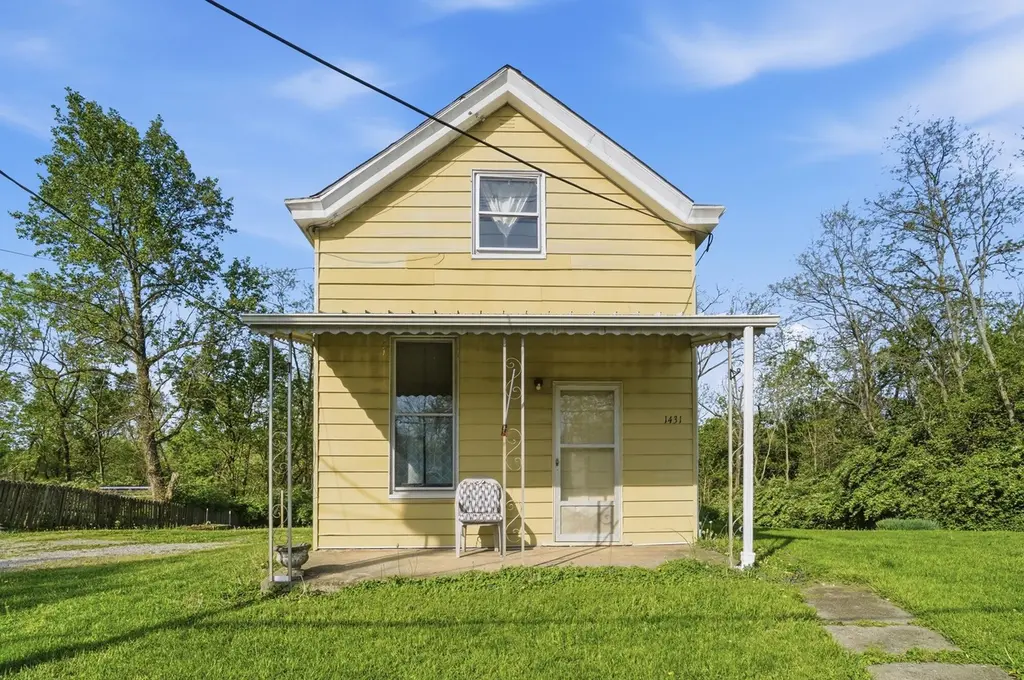
1431 Garvey Ave · Elsmere, KY
Flood risk 1/10 · Minimal
- FEMA flood zone
- X (unshaded)
- Chance of flooding over 30 yrs
- 0.0%
- Est. flood insurance / yr
- $507 – $1,088
Fire risk 1/10 · Minimal
- Est. fire insurance / yr
- $839 – $1,559
Heat risk 4/10 · Minor
- Hot days now (above 103°F)
- 7 days/yr
- Hot days in 30 yrs
- 18 days/yr
Wind risk 2/10 · Minimal
- Chance of severe wind over 30 yrs
- 1.0%
Air-quality risk 2/10 · Minimal
- Unhealthy air days now
- 1 days/yr
- Unhealthy air days in 30 yrs
- 3 days/yr
Risk factors via First Street. Map © Google.
Why this score? — see what drove the C grade
The composite is a weighted blend of 9 inputs, each scored 0–100. Each bar is that input's sub-score; the figure is the points it added to the 100-point composite (weight × sub-score).
- Cash flow +23.6/30.0
- DSCR +7.6/10.0
- ARV discount +7.5/15.0
- 1% rule +6.6/10.0
- Rent growth +3.6/5.0
- Livability +3.6/5.0
- Condition / age +2.5/5.0
- Schools +2.3/10.0
- Appreciation +0.0/10.0
$125,000
🖨 Deal sheet 📄 Offer letter ✓ Due diligence
Listing remarks MLS
Opportunity knocks! This 3-bedroom, 1-bath home offers solid potential for investors or handy buyers looking to add value. Featuring wood floors throughout and a partial basement for added storage, the home also includes three covered porches, perfect for relaxing or expanding outdoor living space. Situated on two lots, there's plenty of room for future possibilities. Being sold AS-IS, this property is ideal for those ready to bring their vision to life. Don't miss your chance to turn this into a great investment or project!
Key facts
- Two lots
- Wood floors
- Partial basement
Tags
Neighborhood map
What this means for you Summary
Snapshot
- This is a 2-bed/1.0-bath single-family listed at $125k.
Deal economics
- At list price, monthly cash flow is $236 ($3k/yr) — positive.
- The deal already cash-flows at list — no discount required.
- Meets the 1% rule at list price ($1k rent vs $125k).
- Recommended offer: $121k (3.0% below list) — sets the bar for market timing.
- Cap rate 8.6% vs local median 5.0% in Elsmere — top-decile yield for the area; either an underpriced asset or a hidden risk that comps aren't pricing in. Stress-test before assuming the spread holds.
Location & tenants
- Location reads 72/100 on livability (#121 in KY) — a middle-class / working-renter tenant base. Strengths: crime A+, cost of living A+, housing A+; Watch: commute C-, schools F, amenities F.
- Erlanger-Elsmere Independent (suburban): math 21% / reading 32% proficiency, ranked #128 of 165 in KY (top 78%) — low school quality limits family demand, transient renter base, plan for 1-2y turnover.
- Market conditions: Rents rising fast (+4.2%/yr); 122 active listings in the ZIP; 13 comparable units currently listed for rent nearby; rentals leasing fast (median 8d on market — plan ~1-2 weeks tenant-placement turnaround); 699 units permitted in Kenton County in 2024 (287 in 5+ unit buildings).
Forward outlook
- Local home prices are declining (-3.0%/yr); year-one equity from $864 of loan paydown is wiped out by about $4k of value loss. Plan a longer hold.
- Kenton County population projected at +5% by 2050 — modest demand growth; plan on rents tracking national, not racing it.
Negotiation context
- It's been on market 52 days — a 3% lower offer ($121k) is reasonable based on typical stale-listing flexibility.
- 2 sale attempts since 22y ago; this cycle's ask has dropped $20k (14%) from the opening price — seller is motivated, your offer sets the floor, not the list.
- Current owner paid $72k; list at $125k implies a 74% gain — meaningful room to come down on a strong offer.
Risks & watch-outs
- Watch-outs: built in 1890 — expect roof / HVAC / electrical / plumbing capex.
Questions for the listing agent
- It's been on market 52 days. Have you received any prior offers? Is the seller open to a 3% concession, seller financing, or rate buy-down credit?
- Built in 1890 — when were the roof, HVAC, electrical panel, plumbing, and water heater last replaced?
- Is there a deadline driving the sale (1031 exchange, divorce, estate, relocation)? That informs how much negotiation room exists.
- Schools are F-rated, which usually means shorter tenancies and higher turnover. Who's the typical renter profile here, and what's been the actual vacancy rate?
- What's the average days-on-market for RENTAL listings here right now (not sales)? A rising rental-DOM trend means longer vacancies and softer asking-rent achievability than the comps imply.
- What's the recent tenant-quality profile in this submarket — average credit score on applications, eviction rate, late-payment / NSF rate, and stable-employment percentage? A property-management company in the area should have these aggregated.
- How much new for-sale + rental construction is in the pipeline within 1–3 miles? Heavy new supply typically softens prices + rents 12–24 months out; constrained supply supports both.
Investment metrics
- 1% rule
- 1.16% ✓
- Cap rate
- 8.56%
- Cash-on-cash
- 8.10%
- DSCR
- 1.36
- GRM
- 7.2
CMA / ARV
- ARV (median comp)
- $252,148
- List price
- $125,000
- Delta
- -50.43%
- Verdict
- UNDERPRICED
- Comps
- 20 within 1.0 mi
Show comp detail 12 sales within ~0.75 mi
| Address | Dist | Beds/Ba | Sqft | Sold | Price | $/sf | Match |
|---|---|---|---|---|---|---|---|
| 1400 Central Row Rd | 0.13mi | 2/1.5 | 1,418 (+6%) | 0mo | $230,000 | $162 | 83 |
| 1046 Fallbrook Dr | 0.12mi | 3/2.0 (+1) | 1,361 (+1%) | 0mo | $275,000 | $202 | 83 |
| 914 Central Row Rd | 0.35mi | 2/1.0 | 1,330 (-1%) | 2mo | $72,500 | $55 | 80 |
| 1230 Central Row Rd | 0.16mi | 3/1.5 (+1) | 1,271 (-5%) | 0mo | $209,000 | $164 | 76 |
| 451 Fox | 0.42mi | 3/1.0 (+1) | 1,260 (-6%) | 2mo | $170,000 | $135 | 63 |
| 232 Shaw Ave | 0.49mi | 3/2.0 (+1) | 1,296 (-4%) | 1mo | $229,000 | $177 | 61 |
| 281 Fox St | 0.55mi | 3/2.0 (+1) | 1,400 (+4%) | 0mo | $230,000 | $164 | 58 |
| 1015 Shadowridge Dr | 0.31mi | 3/2.5 (+1) | 1,512 (+12%) | 1mo | $273,000 | $181 | 53 |
| 712 Bedinger St | 0.63mi | 2/1.0 | 1,197 (-11%) | 2mo | $227,000 | $190 | 51 |
| 409 Lytle Ave | 0.66mi | 3/2.0 (+1) | 1,225 (-9%) | 1mo | $199,500 | $163 | 45 |
| 622 Stevenson Rd | 0.69mi | 3/1.5 (+1) | 1,204 (-10%) | 1mo | $252,500 | $210 | 42 |
| 3545 Jacqueline Dr | 0.64mi | 3/2.0 (+1) | 1,161 (-14%) | 2mo | $250,000 | $215 | 37 |
Match score weights: distance 35% · size 25% · config 20% · recency 20%. Top-matched comps best support the ARV.
Projected returns pro-forma
-3.0% appreciation · 4.22% rent growth · sell at horizon
- IRR
- -2.5%
- Equity multiple
- 0.90×
- Total profit
- $-3,372
- Equity at exit
- $18,638
- IRR
- 8.5%
- Equity multiple
- 1.69×
- Total profit
- $24,180
- Equity at exit
- $10,808
Cash invested: $35,000 (down + closing). Projections, not guarantees.
Landlord ↔ Tenant lean methodology
- Overall (STATE)
- 83 Strongly Landlord-Friendly
- State Kentucky
- 83 Strongly Landlord-Friendly · R+16
- County
- — inherits STATE
- City
- — inherits STATE
ZIP-level market 41018
- Rents YoY
- 4.2%
- Active inventory
- 122
- Price-to-rent
- 7.2×
Monthly cashflow live
- Estimated rent
- $1,446 high interval (Pro) →
- Mortgage (P&I)
- −$656
- Tax from tax record
- −$198 /mo · $2,382/yr
- Insurance
- −$52
- HOA
- −$0
- Vacancy / Maint / Mgmt
- −$304
- Net cashflow
- $236
Break-even live
UW: 25.0% down · 7.5% · 30yr · 1.5% tax · 5.0% vac · 8.0% maint · 8.0% mgmt
Financing live
Cash to close
- Down payment
- $31,250
- Closing costs
- $3,750
- Reserves months
- —
- Total cash needed
- —
Loan-product check · same deal, 3 products live
Conventional
25% down · 7.5% · 30yr
- Down + closing
- —
- Monthly P&I
- —
- Monthly cashflow
- —
- DSCR
- —
- Eligible?
- —
Personal DTI + credit; lowest rate.
DSCR
20% down · 8.5% · 30yr
- Down + closing
- —
- Monthly P&I
- —
- Monthly cashflow
- —
- DSCR
- —
- Eligible?
- —
No personal income docs; deal must DSCR.
Hard money
10% down · 12.0% · 12mo
- Down + closing
- —
- Monthly P&I
- —
- Monthly cashflow
- —
- DSCR
- —
- Eligible?
- —
Short-term bridge; refi at stabilization.
Rent comps 13 comps
| Address | Beds | Baths | Sqft | Rent | $/sqft | DOM | Units | Dist |
|---|---|---|---|---|---|---|---|---|
| 104 Dove Dr Elsmere, KY | 3.0 | 2.0 | 924 | $1,295 | $1.40 | 14d | 1 | 0.39mi |
| 3610 Concord Dr Erlanger, KY | 3.0 | 1.5 | 1064 | $1,700 | $1.60 | 43d | 1 | 0.40mi |
| 9 Eagle Dr Elsmere, KY | 3.0 | 2.0 | 960 | $1,328 | $1.38 | 23d | 1 | 0.40mi |
| 109 Dove Dr Elsmere, KY | 3.0 | 2.0 | 960 | $1,328 | $1.38 | 1d | 1 | 0.44mi |
| 64 Eagle Dr Elsmere, KY | 3.0 | 2.0 | 960 | $1,328 | $1.38 | 7d | 1 | 0.46mi |
| 868 Virginiabradford Ct Elsmere, KY | 3.0 | 2.5 | 974 | $3,500 | $3.59 | 1d | 1 | 0.50mi |
| 121 Carlisle St Elsmere, KY | 3.0 | 2.0 | 1650 | $2,000 | $1.21 | 14d | 1 | 0.83mi |
| 3000 Stoneybrook Ln Elsmere, KY | 1.0–2.0 | 1.0–2.0 | 989 | $1,660 | $1.68 | 4d | 17 | 1.13mi |
| 159 Green River Dr Erlanger, KY | 2.0 | 2.0 | 1278 | $1,595 | $1.25 | 1d | 1 | 1.16mi |
| 43 Banklick St Florence, KY | 2.0 | 2.0 | 1265 | $1,355 | $1.07 | 3d | 3 | 1.29mi |
| 7222 Isaac Ln Florence, KY | 3.0 | 2.0 | 1400 | $1,795 | $1.28 | 16d | 1 | 1.35mi |
| 6805 Sebree Dr Florence, KY | 1.0–3.0 | 1.0–1.5 | 901 | $1,404 | $1.56 | 1d | 14 | 1.48mi |
| 101 Pinehurst Dr Florence, KY | 1.0–2.0 | 1.0 | 815 | $1,399 | $1.72 | 23d | 6 | 1.49mi |
Listing history 16 events
-
2026-06-16status $125,000 Pending 52 DOM
-
2026-06-15days on market $125,000 Active 52 DOM
-
2026-06-13days on market $125,000 Active 50 DOM
-
2026-06-13pricestatusdays on market $125,000 Active 49 DOM
-
2026-06-07statusdays on market $135,000 Pending 47 DOM
-
2026-06-05days on market $135,000 Active 45 DOM
-
2026-06-03days on market $135,000 Active 44 DOM
-
2026-06-02days on market $135,000 Active 43 DOM
-
2026-06-01days on market $135,000 Active 42 DOM
-
2026-05-31days on market $135,000 Active 41 DOM
-
2026-05-07price $135,000 530-char remark
Show marketing remark (530 chars)
Opportunity knocks! This 3-bedroom, 1-bath home offers solid potential for investors or handy buyers looking to add value. Featuring wood floors throughout and a partial basement for added storage, the home also includes three covered porches, perfect for relaxing or expanding outdoor living space. Situated on two lots, there's plenty of room for future possibilities. Being sold AS-IS, this property is ideal for those ready to bring their vision to life. Don't miss your chance to turn this into a great investment or project!
-
2026-04-20$145,000 Active 530-char remark
Show marketing remark (530 chars)
Opportunity knocks! This 3-bedroom, 1-bath home offers solid potential for investors or handy buyers looking to add value. Featuring wood floors throughout and a partial basement for added storage, the home also includes three covered porches, perfect for relaxing or expanding outdoor living space. Situated on two lots, there's plenty of room for future possibilities. Being sold AS-IS, this property is ideal for those ready to bring their vision to life. Don't miss your chance to turn this into a great investment or project!
-
2004-05-20soldstatus $72,000
-
2004-05-14soldstatus $72,000 182-char remark
Show marketing remark (182 chars)
Great Opportunity for First-Time Buyer or Investor or Handyman! All appliances including washer/dryer. 3 covered porches Incredible yard (5 lots)! Being sold As Is. Quick Possession!
-
2004-04-18$80,000 182-char remark
Show marketing remark (182 chars)
Great Opportunity for First-Time Buyer or Investor or Handyman! All appliances including washer/dryer. 3 covered porches Incredible yard (5 lots)! Being sold As Is. Quick Possession!
-
1987-11-30soldstatus $20,500
ⓘ Source: listings_history table (triggers on properties + properties_extension) + one-shot
backfill from property_details.listing_events for pre-trigger history.
Tax reassessment forecast KY · Resets to sale price
- Current annual tax
- $2,382 · $198/mo
- Projected year-2 tax
- $2,382 · $198/mo
- Expected delta
- $0/yr ($0/mo · 0.0%)
ⓘ Screening estimate from a state-policy table — verify with the county assessor before closing.
Climate risk First Street
- Flood 1/10 Low FEMA zone X (unshaded) · 0% chance over 30 yrs
- Wildfire 1/10 Low
- Heat 4/10 Moderate 7 d/yr ≥103°F today · 18 d/yr by 30 yrs out
- Wind 2/10 Low 100% chance of damaging wind over 30 yrs
- Air quality 2/10 Low 1 unhealthy d/yr today · 3 by 30 yrs out
Nearby sold comps map
Loading sold comps map…
Walkable amenities ~0.75 mi
Loading nearby amenities…
Taxation est. · year 1
- Rental income
- $17,350
- − Mortgage interest
- −$7,002
- − Property taxes
- −$2,382
- − Insurance
- −$625
- − Repairs & maintenance
- −$1,388
- − Management
- −$1,388
- − Depreciation
- −$3,636
- Taxable income
- $929
- Est. tax owed @ 24.0%
- −$223
- After-tax cash flow
- $2,611/yr
For passive investors: Depreciation is non-cash, so a rental often shows a tax loss while cash-flowing — sheltering income. Rental losses are passive: they offset passive income freely, and up to $25,000/yr can offset ordinary (W-2) income if you actively participate and your MAGI is under $100k (phasing out to $0 by $150k); unused losses carry forward. On sale, claimed depreciation is recaptured at up to 25%, and gains may owe capital-gains tax (a 1031 exchange can defer both). Figures are a year-1 estimate at your 24.0% rate — not tax advice; consult a CPA.
Schools (NCES district)
- District
- Erlanger-Elsmere Independent
- NCES district ID
- 2101740
- Math proficiency
- 21% ▼ -10.00%
- Reading proficiency
- 32% ▼ -11.00%
- Median HH income
- $47,377
- Composite
- 23.01/100
- National rank
- #7975
- State rank
- #128 of 165 in KY
Livability — Elsmere
- Score
- 72/100
- State rank
- #121
- US rank
- #5733
Category grades
Schools grade is shown separately in the Schools card above.
Census & demographics
- Census place
- Elsmere, KY
- County
- Kenton County · 142,881 people
- City population
- 28,707
- Metro
- Cincinnati, OH-KY-IN
- Population (ZIP)
- 28,940
- Household income
- $68,605
- Rent vs Own
- Severe rent burden
- 678.0
Population outlook (Kenton County) Hauer SSP2
- Today (2025)
- 174,205 people
- By 2030
- 177,897 · +2.1%
- By 2040
- 182,671 · +4.9%
- By 2050
- 183,543 · +5.4%
- By 2075
- 178,977 · +2.7%
- By 2100
- 159,920 · -8.2%
Race, ethnicity, and origin ACS 2023
- Neighborhood character
- Predominantly White (83%)
- Race & ethnicity
- White 83% Two or more races 7% Hispanic / Latino 5% Black 5% Asian 1%
- Hispanic origin (detail)
- Mexican 3%
- Common ancestry
- Slovak 3% Italian 2% Lithuanian 1%
- Foreign-born
- 4% · Canada, Vietnam
- Languages at home
- 94% English-only · Spanish 4%
Political lean MEDSL · Kenton
- 2024 margin
- Strong R (+21.7) · D 38.2% · R 59.9% · Other 1.9%
- 2008→2024 swing
- -0.9pp no change · 2008: -20.9pp · 2024: -21.7pp
- All cycles
- 2024: R+21.7 2020: R+19.3 2016: R+26.1 2012: R+24.3 2008: R+20.9
Not yet ingested
- Civics
- —
Market trends
- HPI YoY
- ▼ -211.57%
- Current HPI
- 215.9599
- Rent YoY
- ▲ 4.22%
- Metro
- Cincinnati, OH-KY-IN
- State GDP YoY
- ▲ 1.81%
- F500 in state
- 4
Industry mix (Fortune 500 HQ in KY)
| Industry | F500 HQs | Revenue |
|---|---|---|
| Healthcare | 1 | $118B |
|
||
| Food / Beverage | 1 | $7B |
|
||
Price history
+558.5% since first listed6 events — show timeline
- 2026-05-07 Price Changed $135,000 NKMLS
- 2026-04-20 Listed $145,000 NKMLS
- 2004-05-20 Sold (Public Records) $72,000 Public Records
- 2004-05-14 Sold (MLS) $72,000 NKMLS
- 2004-04-18 Listed $80,000 NKMLS
- 1987-11-30 Sold (Public Records) $20,500 Public Records
Property tax history
+7.1%/yrLatest (2025): $2,382 · -1.0% YoY. Source: county tax records.
Cash-flow waterfall
monthlySold comps — $/sqft
last 12 mo · ≤1 miLoading sold comps…