 🏷️ Likely Rental
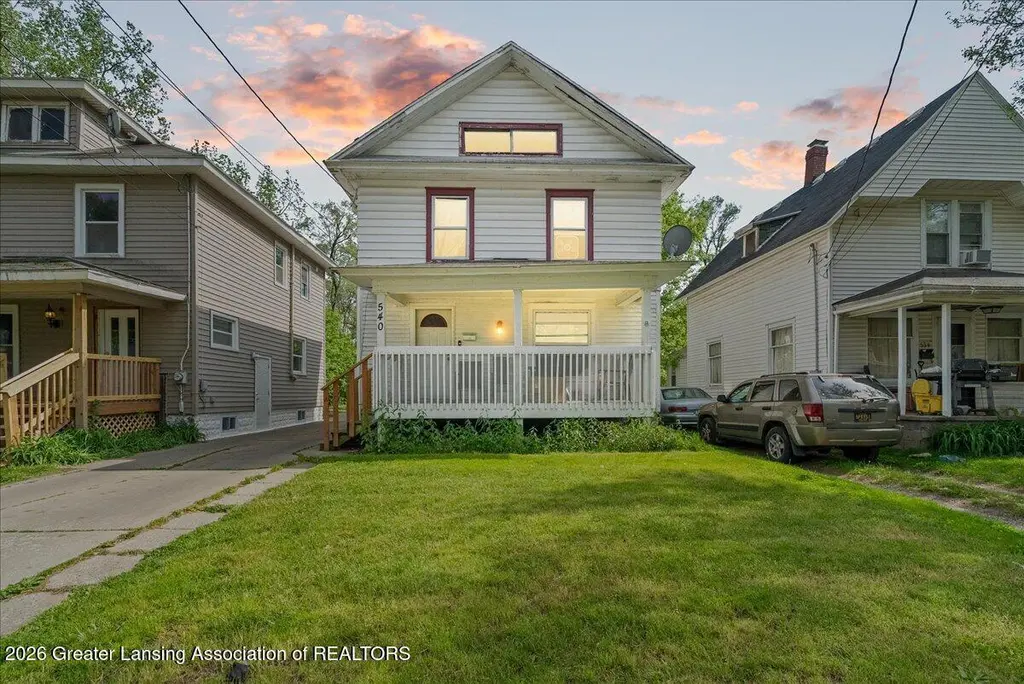
540 Avon St · Lansing, MI
Flood risk 1/10 · Minimal
- FEMA flood zone
- X (unshaded)
- Chance of flooding over 30 yrs
- 0.0%
- Est. flood insurance / yr
- $473 – $860
Fire risk 1/10 · Minimal
- Est. fire insurance / yr
- $784 – $1,456
Heat risk 2/10 · Minimal
- Hot days now (above 96°F)
- 7 days/yr
- Hot days in 30 yrs
- 16 days/yr
Wind risk 2/10 · Minimal
- Chance of severe wind over 30 yrs
- —
Air-quality risk 2/10 · Minimal
- Unhealthy air days now
- 1 days/yr
- Unhealthy air days in 30 yrs
- 2 days/yr
Risk factors via First Street. Map © Google.
Why this score? — see what drove the B grade
The composite is a weighted blend of 9 inputs, each scored 0–100. Each bar is that input's sub-score; the figure is the points it added to the 100-point composite (weight × sub-score).
- Cash flow +28.1/30.0
- ARV discount +15.0/15.0
- DSCR +10.0/10.0
- 1% rule +9.5/10.0
- Livability +4.0/5.0
- Rent growth +3.7/5.0
- Condition / age +2.5/5.0
- Schools +1.9/10.0
- Appreciation +0.0/10.0
$99,000
🖨 Deal sheet 📄 Offer letter ✓ Due diligence
Listing remarks MLS
Welcome to 540 Avon in Lansing, this 3 bedroom home offers a great opportunity for both investors and future owner-occupants. Currently tenant-occupied at $1,400 per month plus utilities, the lease runs through August, providing immediate rental income with future flexibility. Recent updates include fresh paint, new carpet, LVP flooring, roof repair, garage repair with updated garage door, and bathroom improvements, making this property a solid addition to a portfolio or a great option for a future primary residence.
Key facts
- Recent updates
- Garage repair
- Fresh paint
Tags
Property features AI
Finance
- Financial info: Currently used as an investment
Exterior
- Parking: Detached garage (2 garage spaces) with paved shared driveway
- Utilities: Public sewer
- Home design: Traditional style; Two levels; Entry on level 1; Built in 1921
- Construction: Vinyl siding
- Exterior features: Covered porch; City lot; Neighborhood view; Road frontage on a city street; Paved road
Interior
- Kitchen: Disposal; Water heater
- Bedrooms: 3 bedrooms (primary bedroom on entry level)
- Flooring: Carpet; Vinyl
- Bathrooms: 1 full bathroom
- Heating & cooling: Forced air heating (natural gas); No cooling
- Interior features: High speed internet; Laminate counters; Full basement
- Laundry & utility: Laundry in basement
Neighborhood map
What this means for you Summary
Snapshot
- This is a 3-bed/1.0-bath single-family listed at $99k.
Deal economics
- At list price, monthly cash flow is $312 ($4k/yr) — positive.
- The deal already cash-flows at list — no discount required.
- Meets the 1% rule at list price ($1k rent vs $99k).
- Recommended offer: $98k (1.5% below list) — sets the bar for market timing.
- Cap rate 10.1% vs local median 6.0% in Lansing — top-decile yield for the area; either an underpriced asset or a hidden risk that comps aren't pricing in. Stress-test before assuming the spread holds.
Location & tenants
- Location reads 79/100 on livability (#94 in MI, #2,182 nationally) — a middle-class / working-renter tenant base. Strengths: amenities A+, commute A+, cost of living A+; Watch: employment D, schools F, crime F.
- Lansing Public School District (urban): math 14% / reading 23% proficiency, ranked #650 of 760 in MI (top 86%) — low school quality limits family demand, transient renter base, plan for 1-2y turnover; 68% free/reduced lunch — lower-income household profile, screen leases tightly.
- Market conditions: Rents rising fast (+4.7%/yr); 177 active listings in the ZIP; 16 comparable units currently listed for rent nearby; rentals lingering (median 44d on market — plan ~5-8 weeks vacancy on turnover, expect pricing pressure); 56% of comp listings sitting > 30 days — soft ceiling on asking rent; 350 units permitted in Ingham County in 2024 (186 in 5+ unit buildings).
- This rent runs 31% of the median local income ($55k/yr) — at the standard rent-burdened threshold; future hikes will face affordability resistance.
Forward outlook
- Local home prices are declining (-3.0%/yr); year-one equity from $684 of loan paydown is wiped out by about $3k of value loss. Plan a longer hold.
- Ingham County population projected at +11% by 2050 — modest demand growth; plan on rents tracking national, not racing it.
- At projected returns (-3.0% appreciation + 4.7% rent growth), your $28k cash investment doubles in ~8 years — after that, you're playing with house money.
Negotiation context
- It's been on market 22 days — a 2% lower offer ($98k) is reasonable based on typical stale-listing flexibility.
- 11 sale attempts since 11y ago with the ask held roughly flat each time — persistent listings suggest the price (not the market) is what's stuck; bring a comps-based counter.
- Current owner paid $85k; 16% above their basis — modest negotiation headroom, anchor on the comps not their cost.
Risks & watch-outs
- Watch-outs: property tax is 3.2% of price; built in 1921 — expect roof / HVAC / electrical / plumbing capex.
Questions for the listing agent
- Built in 1921 — when were the roof, HVAC, electrical panel, plumbing, and water heater last replaced?
- Property tax is high relative to price — has the assessment been appealed recently, and will the sale trigger a re-assessment?
- Is there a deadline driving the sale (1031 exchange, divorce, estate, relocation)? That informs how much negotiation room exists.
- Schools are F-rated, which usually means shorter tenancies and higher turnover. Who's the typical renter profile here, and what's been the actual vacancy rate?
- Crime grade is F in this area — have there been break-ins, vandalism, or insurance claims at this property in the last 3 years? What carrier currently insures it and at what premium?
- What's the average days-on-market for RENTAL listings here right now (not sales)? A rising rental-DOM trend means longer vacancies and softer asking-rent achievability than the comps imply.
- What's the recent tenant-quality profile in this submarket — average credit score on applications, eviction rate, late-payment / NSF rate, and stable-employment percentage? A property-management company in the area should have these aggregated.
- How much new for-sale + rental construction is in the pipeline within 1–3 miles? Heavy new supply typically softens prices + rents 12–24 months out; constrained supply supports both.
Investment metrics
- 1% rule
- 1.45% ✓
- Cap rate
- 10.08%
- Cash-on-cash
- 13.52%
- DSCR
- 1.60
- GRM
- 5.8
CMA / ARV
- ARV (on-the-fly)
- $196,528
- Comps found
- 12
Show comp detail 12 sales within ~0.75 mi
| Address | Dist | Beds/Ba | Sqft | Sold | Price | $/sf | Match |
|---|---|---|---|---|---|---|---|
| 1501 Shubel Ave | 0.51mi | 2/1.0 (-1) | 1,401 (+1%) | 2mo | $175,000 | $125 | 67 |
| 1601 Coleman Ave | 0.45mi | 4/2.0 (+1) | 1,340 (-3%) | 0mo | $212,000 | $158 | 64 |
| 1406 E Mount Hope Ave | 0.68mi | 3/1.5 | 1,432 (+4%) | 2mo | $185,000 | $129 | 59 |
| 129 E Elm St | 0.58mi | 4/2.0 (+1) | 1,433 (+4%) | 0mo | $159,900 | $112 | 58 |
| 1022 S Grand Ave | 0.59mi | 3/1.0 | 1,478 (+7%) | 4mo | $42,500 | $29 | 58 |
| 1221 Pershing Dr | 0.55mi | 3/2.0 | 1,500 (+8%) | 1mo | $246,000 | $164 | 56 |
| 310 W Barnes Ave | 0.56mi | 3/2.0 | 1,270 (-8%) | 3mo | $180,000 | $142 | 54 |
| 2309 S Pennsylvania Ave | 0.60mi | 4/2.0 (+1) | 1,308 (-6%) | 0mo | $88,900 | $68 | 53 |
| 2201 S Pennsylvania Ave | 0.55mi | 4/2.0 (+1) | 1,286 (-7%) | 1mo | $195,000 | $152 | 53 |
| 1819 Alpha St | 0.46mi | 3/2.0 | 1,208 (-13%) | 2mo | $175,000 | $145 | 52 |
| 2211 Harding Ave | 0.73mi | 3/2.0 | 1,518 (+10%) | 2mo | $232,000 | $153 | 44 |
| 2418 Forest Ave | 0.70mi | 3/2.0 | 1,556 (+12%) | 3mo | $145,000 | $93 | 40 |
Match score weights: distance 35% · size 25% · config 20% · recency 20%. Top-matched comps best support the ARV.
Projected returns pro-forma
-3.0% appreciation · 4.71% rent growth · sell at horizon
- IRR
- 5.9%
- Equity multiple
- 1.23×
- Total profit
- $6,464
- Equity at exit
- $14,761
- IRR
- 17.0%
- Equity multiple
- 2.53×
- Total profit
- $42,332
- Equity at exit
- $8,560
Cash invested: $27,720 (down + closing). Projections, not guarantees.
Landlord ↔ Tenant lean methodology
- Overall (STATE)
- 62 Landlord-Friendly
- State Michigan
- 62 Landlord-Friendly · EVEN
- County
- — inherits STATE
- City
- — inherits STATE
ZIP-level market 48910
- Rents YoY
- 4.7%
- Active inventory
- 177
- Price-to-rent
- 5.8×
Monthly cashflow live
- Estimated rent
- $1,434 high interval (Pro) →
- Mortgage (P&I)
- −$519
- Tax from tax record
- −$260 /mo · $3,119/yr
- Insurance
- −$41
- HOA
- −$0
- Vacancy / Maint / Mgmt
- −$301
- Net cashflow
- $312
Break-even live
UW: 25.0% down · 7.5% · 30yr · 1.5% tax · 5.0% vac · 8.0% maint · 8.0% mgmt
Financing live
Cash to close
- Down payment
- $24,750
- Closing costs
- $2,970
- Reserves months
- —
- Total cash needed
- —
Loan-product check · same deal, 3 products live
Conventional
25% down · 7.5% · 30yr
- Down + closing
- —
- Monthly P&I
- —
- Monthly cashflow
- —
- DSCR
- —
- Eligible?
- —
Personal DTI + credit; lowest rate.
DSCR
20% down · 8.5% · 30yr
- Down + closing
- —
- Monthly P&I
- —
- Monthly cashflow
- —
- DSCR
- —
- Eligible?
- —
No personal income docs; deal must DSCR.
Hard money
10% down · 12.0% · 12mo
- Down + closing
- —
- Monthly P&I
- —
- Monthly cashflow
- —
- DSCR
- —
- Eligible?
- —
Short-term bridge; refi at stabilization.
Rent comps 16 comps
| Address | Beds | Baths | Sqft | Rent | $/sqft | DOM | Units | Dist |
|---|---|---|---|---|---|---|---|---|
| 920 S Washington Ave Lansing, MI | 1.0–2.0 | 1.0–2.0 | 900 | $1,250 | $1.39 | 13d | 1 | 0.72mi |
| 2528 Forest Ave Lansing, MI | 4.0 | 1.0 | 1175 | $1,699 | $1.45 | 43d | 1 | 0.77mi |
| 1027 Climax St Lansing, MI | 3.0 | 1.5 | 1298 | $1,550 | $1.19 | 13d | 1 | 0.79mi |
| 1100 Malcolm X St Unit B Lansing, MI | 2.0 | 1.0 | 979 | $1,050 | $1.07 | 13d | 1 | 0.84mi |
| 605 S Grand Ave Unit 2 Lansing, MI | 4.0 | 1.0 | 1200 | $1,100 | $0.92 | 43d | 1 | 0.87mi |
| 805 Bement St Unit Hosmer 507 Lansing, MI | 2.0 | 1.0 | 1120 | $1,075 | $0.96 | 43d | 1 | 0.94mi |
| 507 S Hosmer St Lansing, MI | 2.0 | 1.0 | 1120 | $1,075 | $0.96 | 43d | 1 | 0.96mi |
| 910 Dakin St Lansing, MI | 3.0 | 1.0 | 908 | $1,295 | $1.43 | 43d | 1 | 0.99mi |
| 1913 Stirling Ave Unit 1 Lansing, MI | 2.0 | 2.0 | 1100 | $1,200 | $1.09 | 43d | 1 | 1.05mi |
| 401 S Washington Sq Unit 205 Lansing, MI | 2.0 | 1.0 | 968 | $1,355 | $1.40 | 43d | 1 | 1.07mi |
| 401 S Washington Sq Unit 201 Lansing, MI | 3.0 | 1.0 | 1254 | $1,560 | $1.24 | 43d | 1 | 1.07mi |
| 430 Dunlap St Lansing, MI | 2.0 | 1.0 | 940 | $1,450 | $1.54 | 21d | 1 | 1.10mi |
| 208 S Bingham St Lansing, MI | 4.0 | 1.0 | 1020 | $1,500 | $1.47 | 13d | 1 | 1.24mi |
| 409 Lathrop St Lansing, MI | 2.0 | 1.0 | 1342 | $1,500 | $1.12 | 21d | 1 | 1.32mi |
| 113 Pere Marquette Dr Lansing, MI | 1.0–2.0 | 1.0–2.0 | 1065 | $2,250 | $2.11 | 13d | 9 | 1.32mi |
| 1317 Lenore Ave Lansing, MI | 2.0 | 1.5 | 1442 | $850 | $0.59 | 43d | 1 | 1.34mi |
Listing history 42 events
-
2026-06-18days on market $99,000 Active 22 DOM
-
2026-06-17days on market $99,000 Active 21 DOM
-
2026-06-16days on market $99,000 Active 20 DOM
-
2026-06-15days on market $99,000 Active 19 DOM
-
2026-06-14days on market $99,000 Active 17 DOM
-
2026-06-13days on market $99,000 Active 16 DOM
-
2026-06-10days on market $99,000 Active 14 DOM
-
2026-06-09days on market $99,000 Active 13 DOM
-
2026-06-08days on market $99,000 Active 12 DOM
-
2026-06-07days on market $99,000 Active 11 DOM
-
2026-06-05days on market $99,000 Active 8 DOM
-
2026-06-03days on market $99,000 Active 7 DOM
-
2026-06-02days on market $99,000 Active 6 DOM
-
2026-06-01days on market $99,000 Active 5 DOM
-
2026-05-31days on market $99,000 Active 4 DOM
-
2026-05-30days on market $99,000 Active 3 DOM
-
2026-05-27$99,000 Active 522-char remark
Show marketing remark (522 chars)
Welcome to 540 Avon in Lansing, this 3 bedroom home offers a great opportunity for both investors and future owner-occupants. Currently tenant-occupied at $1,400 per month plus utilities, the lease runs through August, providing immediate rental income with future flexibility. Recent updates include fresh paint, new carpet, LVP flooring, roof repair, garage repair with updated garage door, and bathroom improvements, making this property a solid addition to a portfolio or a great option for a future primary residence.
-
2026-05-27$99,000 Active
Show marketing remark (522 chars)
Welcome to 540 Avon in Lansing, this 3 bedroom home offers a great opportunity for both investors and future owner-occupants. Currently tenant-occupied at $1,400 per month plus utilities, the lease runs through August, providing immediate rental income with future flexibility. Recent updates include fresh paint, new carpet, LVP flooring, roof repair, garage repair with updated garage door, and bathroom improvements, making this property a solid addition to a portfolio or a great option for a future primary residence.
-
2025-07-28historical $1,400
-
2025-07-01price $1,400
-
2025-06-28$1,350
-
2024-01-13historical $1,350
-
2024-01-09$1,350
-
2023-11-20soldstatus $85,000
-
2023-11-13soldstatus $85,000 468-char remark
Show marketing remark (468 chars)
Attention all Investors!! 3 bed 1 bath licensed rental. Tenant pays $1200 per month and all utilities. Please allow 24 hours notice prior to any showings. Pre-approval or proof of funds is required. Home is being professionally managed through Sustain Management and would be willing to continue with the new owners. The seller would desire to sell the following properties: 121 Smith Lansing, 540 Avon Lansing, and 523 Clifford Lansing as a package deal for $270,000.
-
2023-11-13soldstatus $85,000 Closed
Show marketing remark (468 chars)
Attention all Investors!! 3 bed 1 bath licensed rental. Tenant pays $1200 per month and all utilities. Please allow 24 hours notice prior to any showings. Pre-approval or proof of funds is required. Home is being professionally managed through Sustain Management and would be willing to continue with the new owners. The seller would desire to sell the following properties: 121 Smith Lansing, 540 Avon Lansing, and 523 Clifford Lansing as a package deal for $270,000.
-
2023-09-05status Pending
-
2023-08-28$89,000 468-char remark
Show marketing remark (468 chars)
Attention all Investors!! 3 bed 1 bath licensed rental. Tenant pays $1200 per month and all utilities. Please allow 24 hours notice prior to any showings. Pre-approval or proof of funds is required. Home is being professionally managed through Sustain Management and would be willing to continue with the new owners. The seller would desire to sell the following properties: 121 Smith Lansing, 540 Avon Lansing, and 523 Clifford Lansing as a package deal for $270,000.
-
2023-08-28$89,000 Active
Show marketing remark (468 chars)
Attention all Investors!! 3 bed 1 bath licensed rental. Tenant pays $1200 per month and all utilities. Please allow 24 hours notice prior to any showings. Pre-approval or proof of funds is required. Home is being professionally managed through Sustain Management and would be willing to continue with the new owners. The seller would desire to sell the following properties: 121 Smith Lansing, 540 Avon Lansing, and 523 Clifford Lansing as a package deal for $270,000.
-
2023-01-04soldstatus $65,000
-
2022-12-20status Pending
-
2022-12-19soldstatus $65,000 Closed
-
2022-12-19soldstatus $65,000
-
2022-11-02$65,000 Active
-
2022-11-02$65,000
-
2022-10-07historical
-
2022-09-12price $70,000
-
2022-08-10$70,000
-
2015-04-22soldstatus $16,750
-
2015-04-22soldstatus $16,750
-
2015-02-10$20,900
-
2015-02-10$20,900
ⓘ Source: listings_history table (triggers on properties + properties_extension) + one-shot
backfill from property_details.listing_events for pre-trigger history.
Tax reassessment forecast MI · Partial reset (capped growth)
- Current annual tax
- $3,119 · $260/mo
- Projected year-2 tax
- $3,119 · $260/mo
- Expected delta
- $0/yr ($0/mo · 0.0%)
ⓘ Screening estimate from a state-policy table — verify with the county assessor before closing.
Climate risk First Street
- Flood 1/10 Low FEMA zone X (unshaded) · 0% chance over 30 yrs
- Wildfire 1/10 Low
- Heat 2/10 Low 7 d/yr ≥96°F today · 16 d/yr by 30 yrs out
- Wind 2/10 Low
- Air quality 2/10 Low 1 unhealthy d/yr today · 2 by 30 yrs out
Nearby sold comps map
Loading sold comps map…
Walkable amenities ~0.75 mi
Loading nearby amenities…
Taxation est. · year 1
- Rental income
- $17,205
- − Mortgage interest
- −$5,546
- − Property taxes
- −$3,119
- − Insurance
- −$495
- − Repairs & maintenance
- −$1,376
- − Management
- −$1,376
- − Depreciation
- −$2,880
- Taxable income
- $2,413
- Est. tax owed @ 24.0%
- −$579
- After-tax cash flow
- $3,169/yr
For passive investors: Depreciation is non-cash, so a rental often shows a tax loss while cash-flowing — sheltering income. Rental losses are passive: they offset passive income freely, and up to $25,000/yr can offset ordinary (W-2) income if you actively participate and your MAGI is under $100k (phasing out to $0 by $150k); unused losses carry forward. On sale, claimed depreciation is recaptured at up to 25%, and gains may owe capital-gains tax (a 1031 exchange can defer both). Figures are a year-1 estimate at your 24.0% rate — not tax advice; consult a CPA.
Schools (NCES district)
- District
- Lansing Public School District
- NCES district ID
- 2621150
- Math proficiency
- 14% ▲ 1.00%
- Reading proficiency
- 23% ▲ 3.00%
- Median HH income
- $37,453
- Composite
- 18.76/100
- National rank
- #14002
- State rank
- #650 of 760 in MI
Livability — Lansing
- Score
- 79/100
- State rank
- #94
- US rank
- #2182
Category grades
Schools grade is shown separately in the Schools card above.
Census & demographics
- Census place
- Lansing, MI
- County
- Ingham County · 237,052 people
- City population
- 161,269
- Metro
- Lansing-East Lansing, MI
- Population (ZIP)
- 32,800
- Household income
- $54,712
- Rent vs Own
- Severe rent burden
- 1305.0
Population outlook (Ingham County) Hauer SSP2
- Today (2025)
- 300,362 people
- By 2030
- 307,808 · +2.5%
- By 2040
- 320,492 · +6.7%
- By 2050
- 333,223 · +10.9%
- By 2075
- 373,693 · +24.4%
- By 2100
- 392,021 · +30.5%
Race, ethnicity, and origin ACS 2023
- Neighborhood character
- Diverse neighborhood (Simpson 0.62)
- Race & ethnicity
- White 58% Black 16% Hispanic / Latino 12% Two or more races 12% Asian 4% Native American 1%
- Hispanic origin (detail)
- Mexican 9% Cuban 2%
- Common ancestry
- Romanian 5% Lithuanian 3% Slovak 2%
- Foreign-born
- 9% · Canada, China, Vietnam
- Languages at home
- 87% English-only · Spanish 6% Chinese 1% Other Indo-European 1%
Political lean MEDSL · Ingham
- 2024 margin
- Strong D (+29.7) · D 63.9% · R 34.2% · Other 2.0%
- 2008→2024 swing
- -3.6pp toward R · 2008: 33.3pp · 2024: 29.7pp
- All cycles
- 2024: D+29.7 2020: D+32.2 2016: D+27.6 2012: D+27.9 2008: D+33.3
Not yet ingested
- Civics
- —
Market trends
- HPI YoY
- ▼ -211.82%
- Current HPI
- 196.8087
- Rent YoY
- ▲ 4.71%
- Metro
- Lansing-East Lansing, MI
- State GDP YoY
- ▲ 1.37%
- F500 in state
- 28
Industry mix (Fortune 500 HQ in MI)
| Industry | F500 HQs | Revenue |
|---|---|---|
| Automotive Parts | 3 | $48B |
|
||
| Automotive | 2 | $372B |
|
||
| Chemicals | 1 | $45B |
|
||
| Automotive Retail | 1 | $29B |
|
||
| Healthcare / Medical Devices | 1 | $23B |
|
||
| Automotive Technology | 1 | $20B |
|
||
Price history
+373.7% since first listed26 events — show timeline
- 2026-05-27 Listed $99,000 REALCOMP
- 2026-05-27 Listed $99,000 Greater Lansing AoR
- 2025-07-28 Rental Removed $1,400 BUILDIUM
- 2025-07-01 Price Changed $1,400 BUILDIUM
- 2025-06-28 Listed for Rent $1,350 BUILDIUM
- 2024-01-13 Rental Removed $1,350 BUILDIUM
- 2024-01-09 Listed for Rent $1,350 BUILDIUM
- 2023-11-20 Sold (Public Records) $85,000 Public Records
- 2023-11-13 Sold (MLS) $85,000 Greater Lansing AoR
- 2023-11-13 Sold (MLS) $85,000 REALCOMP
- 2023-09-05 Pending — Greater Lansing AoR
- 2023-08-28 Listed $89,000 Greater Lansing AoR
- 2023-08-28 Listed $89,000 REALCOMP
- 2023-01-04 Sold (Public Records) $65,000 Public Records
- 2022-12-20 Pending — Greater Lansing AoR
- 2022-12-19 Sold (MLS) $65,000 REALCOMP
- 2022-12-19 Sold (MLS) $65,000 Greater Lansing AoR
- 2022-11-02 Listed $65,000 REALCOMP
- 2022-11-02 Listed $65,000 Greater Lansing AoR
- 2022-10-07 Listing Removed — REALCOMP
- 2022-09-12 Price Changed $70,000 Greater Lansing AoR
- 2022-08-10 Listed $70,000 REALCOMP
- 2015-04-22 Sold (MLS) $16,750 Greater Lansing AoR
- 2015-04-22 Sold (MLS) $16,750 REALCOMP
- 2015-02-10 Listed $20,900 Greater Lansing AoR
- 2015-02-10 Listed $20,900 REALCOMP
Property tax history
+6.9%/yrLatest (2025): $3,119 · +3.0% YoY. Source: county tax records.
Cash-flow waterfall
monthlySold comps — $/sqft
last 12 mo · ≤1 miLoading sold comps…