 🏗️ New Construction
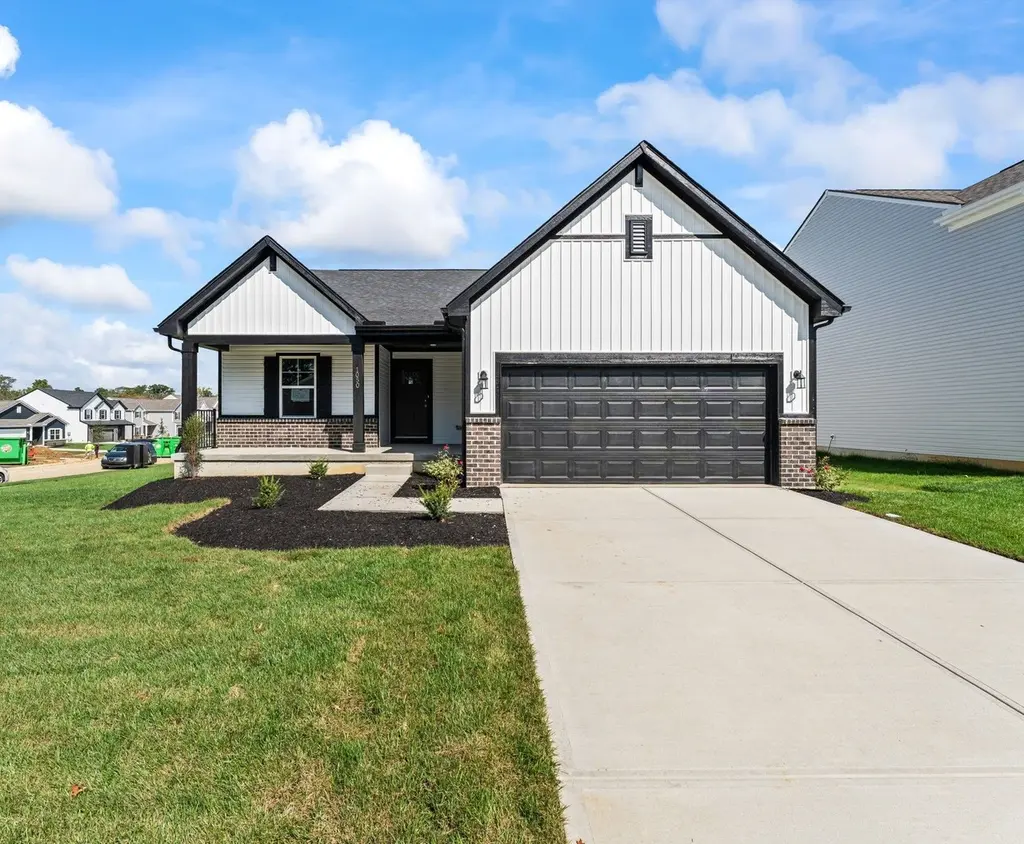
Bradford Plan · Whitestown, IN
Flood risk 1/10 · Minimal
- FEMA flood zone
- X (unshaded)
- Chance of flooding over 30 yrs
- 0.0%
- Est. flood insurance / yr
- $507 – $1,088
Fire risk 1/10 · Minimal
- Est. fire insurance / yr
- $717 – $1,331
Heat risk 2/10 · Minimal
- Hot days now (above 101°F)
- 7 days/yr
- Hot days in 30 yrs
- 17 days/yr
Wind risk 2/10 · Minimal
- Chance of severe wind over 30 yrs
- 1.0%
Air-quality risk 3/10 · Minor
- Unhealthy air days now
- 2 days/yr
- Unhealthy air days in 30 yrs
- 3 days/yr
Risk factors via First Street. Map © Google.
Why this score? — see what drove the F grade
The composite is a weighted blend of 9 inputs, each scored 0–100. Each bar is that input's sub-score; the figure is the points it added to the 100-point composite (weight × sub-score).
- ARV discount +7.5/15.0
- Cash flow +6.3/30.0
- Condition / age +4.0/5.0
- Schools +3.7/10.0
- Livability +3.7/5.0
- Rent growth +2.7/5.0
- 1% rule +1.5/10.0
- DSCR +0.6/10.0
- Appreciation +0.0/10.0
$293,995
🖨 Deal sheet 📄 Offer letter ✓ Due diligence
Listing remarks MLS
The Bradford is the perfect ranch-style floorplan for those looking to downsize or enjoy single-level living with plenty of space. Starting at 1,611 square feet, this three-bedroom, two-bath home can be personalized to fit your lifestyle - with an optional second-floor bonus room for even more living space. Step inside from the charming front porch and you're greeted by a versatile flex room. Use it as a dining area, home office, or creative space - the choice is yours. The L-shaped kitchen offers ample cabinet storage and counter space, with the option to add an island for extra prep area. The open layout connects seamlessly to the great room, perfect for entertaining or spending time with loved ones. The private primary suite is tucked away for relaxation and features an ensuite bath that can be upgraded to include a tiled shower, a 60" shower, or a luxurious garden tub/shower combo. Two additional bedrooms provide space for guests or hobbies. Add a sunroom to enjoy the outdoors year-round, or unwind on the covered patio during warm evenings. With flexible options and thoughtful design, The Bradford by Arbor Homes delivers comfort, convenience, and style - all on one level.
Key facts
- L shaped kitchen
- Versatile flex room
- Open layout
Tags
Neighborhood map
What this means for you Summary
Snapshot
- This is a 3-bed/2.0-bath single-family listed at $294k. Condition is rated good.
Deal economics
- At list price, monthly cash flow is $-613 ($-7k/yr) — negative.
- To cash-flow at today's rent, offer at most $259k (11.9% below list).
- To meet the 1% rule (rent ≥ 1% of price), the offer needs to be $227k (23.0% below list).
- Recommended offer: $227k (23.0% below list) — sets the bar for 1% rule.
Location & tenants
- Location reads 73/100 on livability (#109 in IN) — a middle-class / working-renter tenant base. Strengths: employment A+, housing A+, schools A; Watch: amenities F, commute F, health & safety F.
- Lebanon Community School Corporation (town): math 41% / reading 44% proficiency, ranked #115 of 301 in IN (top 38%) — families likely to look elsewhere, expect single-tenant / working-renter base with shorter leases.
- Market conditions: Rents flat; 268 active listings in the ZIP; 18 comparable units currently listed for rent nearby; rentals leasing fast (median 12d on market — plan ~1-2 weeks tenant-placement turnaround); high-income renter base; 898 units permitted in Boone County in 2024 (0 in 5+ unit buildings).
Forward outlook
- Local home prices are declining (-3.0%/yr); year-one equity from $2k of loan paydown is wiped out by about $10k of value loss. Plan a longer hold.
- Boone County population projected at +46% by 2050 — long-run rental-demand tailwind backs the buy-and-hold thesis.
Negotiation context
- It's been on market 132 days — a 12% lower offer ($259k) is reasonable based on typical stale-listing flexibility.
Questions for the listing agent
- What do current leases actually rent for vs. the listed asking? Can we see a recent rent roll and the last 12 months of T-12 income?
- It's been on market 132 days. Have you received any prior offers? Is the seller open to a 23% concession, seller financing, or rate buy-down credit?
- Why hasn't it sold? Are there any deal-killer items the seller is aware of (foundation, flood, title, zoning, code violations)?
- Is there a deadline driving the sale (1031 exchange, divorce, estate, relocation)? That informs how much negotiation room exists.
- Schools are A-rated — typically a magnet for longer-tenancy family renters. What's the average tenant stay here, and is there a school-zone premium baked into asking?
- The area grade is low — what's the realistic commute time and amenity access for the typical tenant pool here? Any planned neighborhood developments (good or bad) we should know about?
- What's the average days-on-market for RENTAL listings here right now (not sales)? A rising rental-DOM trend means longer vacancies and softer asking-rent achievability than the comps imply.
- What's the recent tenant-quality profile in this submarket — average credit score on applications, eviction rate, late-payment / NSF rate, and stable-employment percentage? A property-management company in the area should have these aggregated.
- How much new for-sale + rental construction is in the pipeline within 1–3 miles? Heavy new supply typically softens prices + rents 12–24 months out; constrained supply supports both.
Investment metrics
- 1% rule
- 0.65% ✗
- Cap rate
- 4.18%
- Cash-on-cash
- -7.55%
- DSCR
- 0.66
- GRM
- 12.8
CMA / ARV
- ARV (median comp)
- $347,578
- List price
- $293,995
- Delta
- -15.42%
- Verdict
- UNDERPRICED
- Comps
- 20 within 1.0 mi
Show comp detail 12 sales within ~0.75 mi
| Address | Dist | Beds/Ba | Sqft | Sold | Price | $/sf | Match |
|---|---|---|---|---|---|---|---|
| 6460 Dusty Laurel Dr | 0.51mi | 3/2.0 | 1,511 (-6%) | 1mo | $282,000 | $187 | 64 |
| 6328 Dusty Laurel Dr | 0.64mi | 3/2.0 | 1,648 (+2%) | 4mo | $320,000 | $194 | 63 |
| 6376 Dusty Laurel Dr | 0.59mi | 3/2.0 | 1,705 (+6%) | 1mo | $320,000 | $188 | 62 |
| 6432 Green Grass Ln | 0.53mi | 3/2.5 | 1,728 (+7%) | 4mo | $305,000 | $177 | 58 |
| 4144 Homestead Dr | 0.56mi | 2/2.0 (-1) | 1,710 (+6%) | 1mo | $335,000 | $196 | 58 |
| 301 S Main St | 0.61mi | 2/2.0 (-1) | 1,632 (+1%) | 12mo | $260,000 | $159 | 55 |
| 3558 Limelight Ln | 0.72mi | 3/2.0 | 1,542 (-4%) | 9mo | $270,000 | $175 | 52 |
| 6588 Ferguson Dr | 0.56mi | 2/2.0 (-1) | 1,495 (-7%) | 7mo | $310,000 | $207 | 50 |
| 706 S Main St | 0.50mi | 2/2.0 (-1) | 1,470 (-9%) | 9mo | $330,000 | $224 | 49 |
| 6625 Ferguson Dr | 0.55mi | 2/2.0 (-1) | 1,495 (-7%) | 13mo | $312,000 | $209 | 46 |
| 6529 Amber Ct | 0.62mi | 2/2.0 (-1) | 1,716 (+6%) | 15mo | $324,000 | $189 | 43 |
| 3504 Limesprings Ln | 0.72mi | 3/2.0 | 1,383 (-14%) | 9mo | $269,900 | $195 | 35 |
Match score weights: distance 35% · size 25% · config 20% · recency 20%. Top-matched comps best support the ARV.
Projected returns pro-forma
-3.0% appreciation · 0.77% rent growth · sell at horizon
- IRR
- -32.0%
- Equity multiple
- -0.03×
- Total profit
- $-100,280
- Equity at exit
- $51,825
- IRR
- -51.4%
- Equity multiple
- -0.61×
- Total profit
- $-156,935
- Equity at exit
- $30,052
Cash invested: $97,322 (down + closing). Projections, not guarantees.
Landlord ↔ Tenant lean methodology
- Overall (STATE)
- 90 Strongly Landlord-Friendly
- State Indiana
- 90 Strongly Landlord-Friendly · R+11
- County
- — inherits STATE
- City
- — inherits STATE
ZIP-level market 46075
- Home prices YoY
- -20.0%
- Rents YoY
- 0.8%
- Active inventory
- 268
- Price-to-rent
- 10.8×
Monthly cashflow live
- Estimated rent
- $2,265 high interval (Pro) →
- Mortgage (P&I)
- −$1,823
- Tax est. 1.5%
- −$434 /mo · $5,214/yr
- Insurance
- −$145
- HOA
- −$0
- Vacancy / Maint / Mgmt
- −$476
- Net cashflow
- $-613
Break-even live
UW: 25.0% down · 7.5% · 30yr · 1.5% tax · 5.0% vac · 8.0% maint · 8.0% mgmt
Financing live
Cash to close
- Down payment
- $86,895
- Closing costs
- $10,427
- Reserves months
- —
- Total cash needed
- —
Loan-product check · same deal, 3 products live
Conventional
25% down · 7.5% · 30yr
- Down + closing
- —
- Monthly P&I
- —
- Monthly cashflow
- —
- DSCR
- —
- Eligible?
- —
Personal DTI + credit; lowest rate.
DSCR
20% down · 8.5% · 30yr
- Down + closing
- —
- Monthly P&I
- —
- Monthly cashflow
- —
- DSCR
- —
- Eligible?
- —
No personal income docs; deal must DSCR.
Hard money
10% down · 12.0% · 12mo
- Down + closing
- —
- Monthly P&I
- —
- Monthly cashflow
- —
- DSCR
- —
- Eligible?
- —
Short-term bridge; refi at stabilization.
Rent comps 18 comps
| Address | Beds | Baths | Sqft | Rent | $/sqft | DOM | Units | Dist |
|---|---|---|---|---|---|---|---|---|
| 3918 Blue Roan Blvd Whitestown, IN | 1.0–3.0 | 1.0–3.0 | 1000 | $2,550 | $2.55 | 1d | 10 | 0.25mi |
| 3845 Stallion St Whitestown, IN | 3.0 | 2.0 | 1250 | $2,399 | $1.92 | 23d | 1 | 0.27mi |
| 3821 Lilac Ln Whitestown, IN | 1.0–4.0 | 1.0–2.0 | 1165 | $1,479 | $1.27 | 1d | 10 | 0.47mi |
| 3786 White Cliff Way Whitestown, IN | 3.0 | 2.0 | 1944 | $1,971 | $1.01 | 43d | 1 | 0.55mi |
| 3807 Tartan Trl Whitestown, IN | 3.0 | 3.0 | 2130 | $2,381 | $1.12 | 43d | 1 | 0.63mi |
| 3550 Limelight Ln Whitestown, IN | 3.0 | 2.0 | 1429 | $2,140 | $1.50 | 7d | 1 | 0.75mi |
| 2881 Cross Branch Dr Whitestown, IN | 3.0–4.0 | 2.5 | 1835 | $2,199 | $1.20 | 19d | 4 | 0.76mi |
| 3823 Indigo Blue Blvd Whitestown, IN | 3.0 | 2.5 | 1992 | $1,941 | $0.97 | 12d | 1 | 0.86mi |
| 6258 Colonial Dr Whitestown, IN | 3.0 | 2.5 | 1900 | $2,150 | $1.13 | 43d | 1 | 0.90mi |
| 3825 Gray Heather Ln Whitestown, IN | 3.0 | 2.5 | 1992 | $1,976 | $0.99 | 7d | 1 | 0.92mi |
| 3835 Dusty Sands Rd Whitestown, IN | 3.0 | 2.0 | 1240 | $2,195 | $1.77 | 23d | 1 | 1.00mi |
| 3366 Firethorn Dr Unit 1236718P Whitestown, IN | 2.0 | 2.0 | 1184 | $6,480 | $5.47 | 21d | 1 | 1.01mi |
| 6389 Wasco Dr Whitestown, IN | 3.0 | 2.5 | 1802 | $2,150 | $1.19 | 3d | 1 | 1.07mi |
| 2606 Plano Dr Unit NA Whitestown, IN | 4.0 | 3.0 | 2119 | $2,600 | $1.23 | 1d | 1 | 1.16mi |
| 6296 Granby Dr Whitestown, IN | 3.0 | 2.5 | 1550 | $2,200 | $1.42 | 1d | 1 | 1.19mi |
| 2557 Lamar Dr Whitestown, IN | 4.0 | 2.5 | 1981 | $2,199 | $1.11 | 43d | 1 | 1.23mi |
| 6831 Orchard Run Cir Whitestown, IN | 4.0 | 2.5 | 2131 | $2,350 | $1.10 | 1d | 1 | 1.28mi |
| 3567 Sugar Grove Dr Unit 1542524P Whitestown, IN | 3.0 | 2.0 | 1829 | $3,581 | $1.96 | 2d | 1 | 1.36mi |
Listing history 14 events
-
2026-06-18days on market $293,995 Active 132 DOM
-
2026-06-17days on market $293,995 Active 131 DOM
-
2026-06-16days on market $293,995 Active 130 DOM
-
2026-06-15days on market $293,995 Active 129 DOM
-
2026-06-13days on market $293,995 Active 127 DOM
-
2026-06-09days on market $293,995 Active 123 DOM
-
2026-06-08days on market $293,995 Active 122 DOM
-
2026-06-07days on market $293,995 Active 121 DOM
-
2026-06-03days on market $293,995 Active 117 DOM
-
2026-06-02days on market $293,995 Active 116 DOM
-
2026-06-01days on market $293,995 Active 115 DOM
-
2026-05-31days on market $293,995 Active 114 DOM
-
2026-02-09price $293,995 1199-char remark
Show marketing remark (1199 chars)
The Bradford is the perfect ranch-style floorplan for those looking to downsize or enjoy single-level living with plenty of space. Starting at 1,611 square feet, this three-bedroom, two-bath home can be personalized to fit your lifestyle - with an optional second-floor bonus room for even more living space. Step inside from the charming front porch and you're greeted by a versatile flex room. Use it as a dining area, home office, or creative space - the choice is yours. The L-shaped kitchen offers ample cabinet storage and counter space, with the option to add an island for extra prep area. The open layout connects seamlessly to the great room, perfect for entertaining or spending time with loved ones. The private primary suite is tucked away for relaxation and features an ensuite bath that can be upgraded to include a tiled shower, a 60" shower, or a luxurious garden tub/shower combo. Two additional bedrooms provide space for guests or hobbies. Add a sunroom to enjoy the outdoors year-round, or unwind on the covered patio during warm evenings. With flexible options and thoughtful design, The Bradford by Arbor Homes delivers comfort, convenience, and style - all on one level.
-
2026-02-07$294,995 Active 1199-char remark
Show marketing remark (1199 chars)
The Bradford is the perfect ranch-style floorplan for those looking to downsize or enjoy single-level living with plenty of space. Starting at 1,611 square feet, this three-bedroom, two-bath home can be personalized to fit your lifestyle - with an optional second-floor bonus room for even more living space. Step inside from the charming front porch and you're greeted by a versatile flex room. Use it as a dining area, home office, or creative space - the choice is yours. The L-shaped kitchen offers ample cabinet storage and counter space, with the option to add an island for extra prep area. The open layout connects seamlessly to the great room, perfect for entertaining or spending time with loved ones. The private primary suite is tucked away for relaxation and features an ensuite bath that can be upgraded to include a tiled shower, a 60" shower, or a luxurious garden tub/shower combo. Two additional bedrooms provide space for guests or hobbies. Add a sunroom to enjoy the outdoors year-round, or unwind on the covered patio during warm evenings. With flexible options and thoughtful design, The Bradford by Arbor Homes delivers comfort, convenience, and style - all on one level.
ⓘ Source: listings_history table (triggers on properties + properties_extension) + one-shot
backfill from property_details.listing_events for pre-trigger history.
Climate risk First Street
- Flood 1/10 Low FEMA zone X (unshaded) · 0% chance over 30 yrs
- Wildfire 1/10 Low
- Heat 2/10 Low 7 d/yr ≥101°F today · 17 d/yr by 30 yrs out
- Wind 2/10 Low 100% chance of damaging wind over 30 yrs
- Air quality 3/10 Moderate 2 unhealthy d/yr today · 3 by 30 yrs out
Nearby sold comps map
Loading sold comps map…
Walkable amenities ~0.75 mi
Loading nearby amenities…
Taxation est. · year 1
- Rental income
- $27,181
- − Mortgage interest
- −$19,470
- − Property taxes
- −$5,214
- − Insurance
- −$1,738
- − Repairs & maintenance
- −$2,174
- − Management
- −$2,174
- − Depreciation
- −$10,111
- Taxable loss
- −$13,701
- Est. tax savings @ 24.0%
- +$3,288
- After-tax cash flow
- $-4,063/yr
For passive investors: Depreciation is non-cash, so a rental often shows a tax loss while cash-flowing — sheltering income. Rental losses are passive: they offset passive income freely, and up to $25,000/yr can offset ordinary (W-2) income if you actively participate and your MAGI is under $100k (phasing out to $0 by $150k); unused losses carry forward. On sale, claimed depreciation is recaptured at up to 25%, and gains may owe capital-gains tax (a 1031 exchange can defer both). Figures are a year-1 estimate at your 24.0% rate — not tax advice; consult a CPA.
Condition & rehab AI · 12 photos
This well-maintained, single-story home with a good condition score is ready for immediate occupancy. It offers a good ROI with updates that can significantly increase its value.
Value-add opportunities
- Resale Paint exterior — Enhances curb appeal
- Both Replace carpet with hardwood — Improves both resale and rental value
- Both Install smart home devices — Enhances convenience and marketability
Renovation cost estimate screening
Value-add ROI direction
- Resale Paint exterior — Enhances curb appeal ↑
- Both Replace carpet with hardwood — Improves both resale and rental value ↑
- Both Install smart home devices — Enhances convenience and marketability ↑
ⓘ Cost ranges are severity-bucket heuristics (US national rule-of-thumb). Get contractor quotes + a written scope before underwriting a rehab budget.
Schools (NCES district)
- District
- Lebanon Community School Corporation
- NCES district ID
- 1805790
- Math proficiency
- 41% ▼ -11.00%
- Reading proficiency
- 44% ▼ -5.00%
- Median HH income
- $52,178
- Composite
- 36.77/100
- National rank
- #4571
- State rank
- #115 of 301 in IN
Livability — Whitestown
- Score
- 73/100
- State rank
- #109
- US rank
- #5691
Category grades
Schools grade is shown separately in the Schools card above.
Census & demographics
- Census place
- Whitestown, IN
- County
- Boone County · 69,822 people
- City population
- 9,509
- Metro
- Indianapolis-Carmel-Anderson, IN
- Population (ZIP)
- 9,509
- Household income
- $117,002
- Rent vs Own
- Severe rent burden
- 287.0
Population outlook (Boone County) Hauer SSP2
- Today (2025)
- 77,877 people
- By 2030
- 85,185 · +9.4%
- By 2040
- 99,753 · +28.1%
- By 2050
- 113,572 · +45.8%
- By 2075
- 145,674 · +87.1%
- By 2100
- 161,165 · +106.9%
Race, ethnicity, and origin ACS 2023
- Neighborhood character
- Predominantly White (84%)
- Race & ethnicity
- White 84% Two or more races 6% Asian 4% Hispanic / Latino 3% Black 3%
- Common ancestry
- Italian 4% Romanian 3% Slovak 2%
- Foreign-born
- 7% · Canada, China
- Languages at home
- 91% English-only · Other Indo-European 5% Spanish 2% Chinese 1%
Political lean MEDSL · Boone
- 2024 margin
- R (+16.0) · D 41.0% · R 57.0% · Other 2.0%
- 2008→2024 swing
- +9.8pp toward D · 2008: -25.8pp · 2024: -16.0pp
- All cycles
- 2024: R+16.0 2020: R+18.4 2016: R+29.5 2012: R+37.8 2008: R+25.8
Not yet ingested
- Civics
- —
Market trends
- HPI YoY
- ▼ -49.51%
- Current HPI
- 198.3353
- Rent YoY
- ▲ 0.77%
- Metro
- Indianapolis-Carmel-Anderson, IN
- State GDP YoY
- ▲ 2.90%
- F500 in state
- 18
Industry mix (Fortune 500 HQ in IN)
| Industry | F500 HQs | Revenue |
|---|---|---|
| Industrial Machinery | 2 | $37B |
|
||
| Healthcare | 1 | $177B |
|
||
| Pharmaceuticals | 1 | $45B |
|
||
| Metals / Steel | 1 | $18B |
|
||
| Agriculture | 1 | $17B |
|
||
| Packaging | 1 | $12B |
|
||
Price history
-0.3% since first listed2 events — show timeline
- 2026-02-09 Price Changed $293,995 Zillow
- 2026-02-07 Listed $294,995 Zillow
Cash-flow waterfall
monthlySold comps — $/sqft
last 12 mo · ≤1 miLoading sold comps…