 🌊 Lakefront
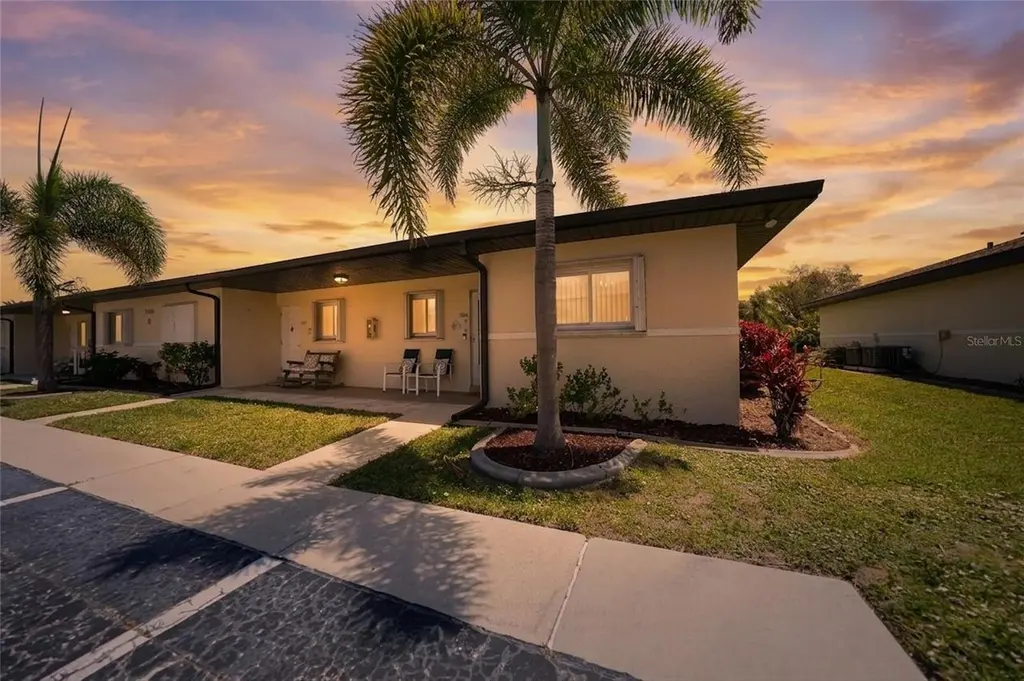
25275 Rampart Blvd #1504 · Harbour Heights, FL
Flood risk 2/10 · Minimal
- FEMA flood zone
- X (unshaded)
- Chance of flooding over 30 yrs
- 0.05%
- Est. flood insurance / yr
- $507 – $1,088
Fire risk 3/10 · Minor
- Est. fire insurance / yr
- $947 – $1,759
Heat risk 10/10 · Severe
- Hot days now (above 107°F)
- 7 days/yr
- Hot days in 30 yrs
- 28 days/yr
Wind risk 10/10 · Severe
- Chance of severe wind over 30 yrs
- 99.0%
Air-quality risk 2/10 · Minimal
- Unhealthy air days now
- 2 days/yr
- Unhealthy air days in 30 yrs
- 2 days/yr
Risk factors via First Street. Map © Google.
Why this score? — see what drove the C- grade
The composite is a weighted blend of 9 inputs, each scored 0–100. Each bar is that input's sub-score; the figure is the points it added to the 100-point composite (weight × sub-score).
- Cash flow +19.4/30.0
- 1% rule +7.5/10.0
- ARV discount +7.5/15.0
- DSCR +6.1/10.0
- Schools +4.6/10.0
- Livability +3.2/5.0
- Condition / age +2.5/5.0
- Rent growth +1.9/5.0
- Appreciation +0.0/10.0
$140,000
🖨 Deal sheet 📄 Offer letter ✓ Due diligence
Listing remarks
Under contract-accepting backup offers. Adorable, 2 bedroom, 2 bathroom Villa located in a desirable first-floor corner unit. Features include storm windows and slider, 2023 A/C, newer water heater, and re-piped in 2024. Roofs and Soffit were recently replaced. Offered fully furnished and turnkey, providing a convenient move-in-ready opportunity. Bright interior with added privacy from the corner location. Ideal for full-time residence, seasonal use, or investment. Fees are only $875 /Quarter! The community features a heated pool and clubhouse with activities, professional bocce court, and a 16-acre lake with fishing piers. Make your appointment today. This won't last!
Key facts
- Bocce court
- Clubhouse
- Newer a/c
Tags
Property features AI
Finance
- Other: Lease restrictions apply
- Financial info: Monthly condo fee listed as $292 (quarterly term); Total annual fees noted as $3,500
- HOA & community: HOA managed by Palmer Property Management; Quarterly condo fee (approx. $292/month; $875 quarterly); Association amenities include clubhouse and pool; HOA fees cover pool, management, maintenance (grounds & structure), sewer, trash, water, and escrow reserves; Association approval required; Community features: clubhouse, community mailbox, deed restrictions, pool; Pets allowed (cats and dogs) with limits — max pet weight about 25 lbs
Exterior
- Parking: Paved parking
- Utilities: Public water; Public sewer; Electricity connected; Cable available; Water connected; Sewer connected
- Home design: Residential villa; One story; East-facing
- Construction: Block construction; Shingle roof; Slab foundation; Built as completed (year not specified)
- Exterior features: Porch; Screened porch; Hurricane shutters; Sliding doors; Vinyl fencing; Lake access with fishing pier; Lot cleared, landscaped and level; Paved road access, public maintained
Interior
- Kitchen: Dishwasher; Microwave; Range; Refrigerator
- Bedrooms: 2 bedrooms
- Flooring: Laminate; Tile
- Bathrooms: 2 full bathrooms
- Heating & cooling: Central heating; Central air conditioning
- Interior features: Ceiling fans; Living room/dining room combo; Split bedroom floor plan; Thermostat; Walk-in closet(s); Window treatments; Shutters; Storm windows; Electric fireplace
- Laundry & utility: Washer and dryer included; Electric dryer hookup; Inside laundry in a closet
Neighborhood map
What this means for you Summary
Snapshot
- This is a 2-bed/2.0-bath condo listed at $140k.
Deal economics
- At list price, monthly cash flow is $157 ($2k/yr) — positive.
- The deal already cash-flows at list — no discount required.
- Meets the 1% rule at list price ($2k rent vs $140k).
- Recommended offer: $136k (3.0% below list) — sets the bar for market timing.
- Cap rate 7.6% vs local median 4.0% in Harbour Heights — top-decile yield for the area; either an underpriced asset or a hidden risk that comps aren't pricing in. Stress-test before assuming the spread holds.
Location & tenants
- Location reads 64/100 on livability (#684 in FL) — a middle-class / working-renter tenant base. Strengths: crime A+, housing A+, employment B; Watch: amenities F, commute F, health & safety D-.
- Charlotte (suburban): math 54% / reading 54% proficiency, ranked #22 of 73 in FL (top 30%) — acceptable for families but not a draw, mixed tenant base, ~2y average lease.
- Zoned schools: Deep Creek Elementary School (math 64% / reading 68%, grade B+, #492 of 2,144 statewide, top 23%, 835 students, 47% FRL); Charlotte High School (math 44% / reading 46%, grade D-, #228 of 667 statewide, top 35%, 1,994 students, 41% FRL).
- Market conditions: Rents soft (-2.6%/yr); 553 active listings in the ZIP; 20 comparable units currently listed for rent nearby; rentals at typical pace (median 21d on market — plan ~3-4 weeks tenant-placement turnaround); 4,585 units permitted in Charlotte County in 2024 (703 in 5+ unit buildings).
Forward outlook
- Local home prices are declining (-3.0%/yr); year-one equity from $968 of loan paydown is wiped out by about $4k of value loss. Plan a longer hold.
- Charlotte County population projected at +24% by 2050 — long-run rental-demand tailwind backs the buy-and-hold thesis.
Negotiation context
- It's been on market 42 days — a 3% lower offer ($136k) is reasonable based on typical stale-listing flexibility.
- 6 sale attempts since 21y ago with the ask held roughly flat each time — persistent listings suggest the price (not the market) is what's stuck; bring a comps-based counter.
Risks & watch-outs
- Climate carrying-cost: severe wind risk, 99% chance of damaging wind over 30y; extreme-heat days projected 7→28/yr by 2055 (HVAC capex compounding) — expect insurance premiums to compound above CPI over the hold.
Questions for the listing agent
- It's been on market 42 days. Have you received any prior offers? Is the seller open to a 3% concession, seller financing, or rate buy-down credit?
- What does the HOA fee cover, when was the last increase, and are there any pending special assessments or reserve-fund shortfalls?
- Any open or pending special assessments — roof, HVAC, plumbing, elevator, façade? What's the per-unit balance and payoff schedule, and is the seller paying it off at close or rolling it to the buyer?
- Is there a deadline driving the sale (1031 exchange, divorce, estate, relocation)? That informs how much negotiation room exists.
- Schools are F-rated, which usually means shorter tenancies and higher turnover. Who's the typical renter profile here, and what's been the actual vacancy rate?
- This sits on a lake — are riparian / water-frontage rights deeded with the parcel? Any dock permits, shoreline easements, or HOA water-use restrictions?
- What's the documented flood / surge / shoreline-erosion history here (FEMA AND non-FEMA — e.g., storm surge, creek backup, septic-field saturation)?
- Any water-quality or seasonal algae-bloom issues that affect tenant satisfaction or short-term-rental demand?
- What's the average days-on-market for RENTAL listings here right now (not sales)? A rising rental-DOM trend means longer vacancies and softer asking-rent achievability than the comps imply.
- What's the recent tenant-quality profile in this submarket — average credit score on applications, eviction rate, late-payment / NSF rate, and stable-employment percentage? A property-management company in the area should have these aggregated.
- How much new apartment / multifamily construction is in the pipeline within 1–3 miles? Heavy new supply (>2% of stock underway) typically softens rents 12–24 months out; light construction supports rent growth.
Investment metrics
- 1% rule
- 1.25% ✓
- Cap rate
- 7.64%
- Cash-on-cash
- 4.81%
- DSCR
- 1.21
- GRM
- 6.7
CMA / ARV
No comps found within radius.
Projected returns pro-forma
-3.0% appreciation · 0.0% rent growth · sell at horizon
- IRR
- -12.9%
- Equity multiple
- 0.55×
- Total profit
- $-17,603
- Equity at exit
- $20,874
- IRR
- -10.9%
- Equity multiple
- 0.45×
- Total profit
- $-21,459
- Equity at exit
- $12,105
Cash invested: $39,200 (down + closing). Projections, not guarantees.
Landlord ↔ Tenant lean methodology
- Overall (STATE)
- 87 Strongly Landlord-Friendly
- State Florida
- 87 Strongly Landlord-Friendly · R+3
- County
- — inherits STATE
- City
- — inherits STATE
ZIP-level market 33983
- Home prices YoY
- -5.1%
- Rents YoY
- -2.6%
- Active inventory
- 553
- Price-to-rent
- 6.7×
Monthly cashflow live
- Estimated rent
- $1,746 high interval (Pro) →
- Mortgage (P&I)
- −$734
- Tax from tax record
- −$138 /mo · $1,659/yr
- Insurance
- −$58
- HOA
- −$291
- Vacancy / Maint / Mgmt
- −$367
- Net cashflow
- $157
Break-even live
UW: 25.0% down · 7.5% · 30yr · 1.5% tax · 5.0% vac · 8.0% maint · 8.0% mgmt
Financing live
Cash to close
- Down payment
- $35,000
- Closing costs
- $4,200
- Reserves months
- —
- Total cash needed
- —
Loan-product check · same deal, 3 products live
Conventional
25% down · 7.5% · 30yr
- Down + closing
- —
- Monthly P&I
- —
- Monthly cashflow
- —
- DSCR
- —
- Eligible?
- —
Personal DTI + credit; lowest rate.
DSCR
20% down · 8.5% · 30yr
- Down + closing
- —
- Monthly P&I
- —
- Monthly cashflow
- —
- DSCR
- —
- Eligible?
- —
No personal income docs; deal must DSCR.
Hard money
10% down · 12.0% · 12mo
- Down + closing
- —
- Monthly P&I
- —
- Monthly cashflow
- —
- DSCR
- —
- Eligible?
- —
Short-term bridge; refi at stabilization.
Rent comps 20 comps
| Address | Beds | Baths | Sqft | Rent | $/sqft | DOM | Units | Dist |
|---|---|---|---|---|---|---|---|---|
| 25225 Rampart Blvd Punta Gorda, FL | 2.0 | 2.0 | 886 | $1,925 | $2.17 | 21d | 5 | 0.19mi |
| 2060 Willow Hammock Cir Unit D304 Punta Gorda, FL | 2.0 | 2.0 | 924 | $1,600 | $1.73 | 21d | 1 | 0.21mi |
| 2121 Heron Lake Dr #204 Punta Gorda, FL | 2.0 | 2.0 | 996 | $1,500 | $1.51 | 21d | 1 | 0.27mi |
| 1499 Capricorn Blvd Port Charlotte, FL | 2.0 | 2.0 | 980 | $1,495 | $1.53 | 21d | 1 | 0.47mi |
| 1408 Rio De Janeiro Ave Punta Gorda, FL | 2.0–3.0 | 2.0 | 1078 | $1,575 | $1.46 | 13d | 6 | 0.96mi |
| 1356 Rio de Janeiro Ave #108 Punta Gorda, FL | 2.0 | 2.0 | 1023 | $1,500 | $1.47 | 21d | 1 | 0.96mi |
| 1330 Rio De Janeiro Ave Unit 3 Punta Gorda, FL | 2.0 | 2.0 | 1017 | $1,325 | $1.30 | 21d | 1 | 0.97mi |
| 1350 Rio de Janeiro Ave Unit 6C Punta Gorda, FL | 2.0 | 2.0 | 1120 | $1,499 | $1.34 | 21d | 1 | 0.97mi |
| 26272 Rampart Blvd #107 Punta Gorda, FL | 2.0 | 2.5 | 1078 | $1,800 | $1.67 | 21d | 1 | 0.99mi |
| 1211 Saxony Cir Unit A-1 Punta Gorda, FL | 2.0 | 2.0 | 1017 | $2,900 | $2.85 | 21d | 1 | 1.09mi |
| 26397 Nadir Rd #204 Punta Gorda, FL | 2.0 | 2.0 | 1105 | $2,500 | $2.26 | 21d | 1 | 1.21mi |
| 26201 Explorer Rd Unit 5 Port Charlotte, FL | 2.0 | 1.5 | 850 | $1,350 | $1.59 | 21d | 1 | 1.24mi |
| 1416 San Cristobal Ave #3 Punta Gorda, FL | 2.0 | 2.0 | 1017 | $3,500 | $3.44 | 21d | 1 | 1.28mi |
| 1416 San Cristobal Ave Unit 3 (C) Punta Gorda, FL | 2.0 | 2.0 | 1017 | $3,200 | $3.15 | 21d | 1 | 1.28mi |
| 25100 Sandhill Blvd Port Charlotte, FL | 2.0 | 2.0 | 860 | $1,788 | $2.08 | 21d | 2 | 1.28mi |
| 26172 Explorer Rd Unit 2 Port Charlotte, FL | 2.0 | 2.0 | 950 | $1,450 | $1.53 | 21d | 1 | 1.31mi |
| 26156 Explorer Rd Punta Gorda, FL | 2.0–3.0 | 2.0 | 1032 | $1,450 | $1.41 | 13d | 1 | 1.31mi |
| 25050 Sandhill Blvd Unit 5B1 Punta Gorda, FL | 2.0 | 2.0 | 900 | $1,500 | $1.67 | 21d | 1 | 1.35mi |
| 26485 Rampart Blvd Punta Gorda, FL | 2.0 | 2.0 | 884 | $1,522 | $1.72 | 21d | 2 | 1.35mi |
| 26461 Explorer Rd Punta Gorda, FL | 2.0 | 2.0 | 1102 | $1,412 | $1.28 | 21d | 2 | 1.42mi |
HOA detail condo
- Monthly dues
- $291 · $3,492/yr
- Likely covers
- waterpool
- Assessments
- None detected in remarks — confirm with the listing agent.
Listing history 19 events
-
2026-06-05remarks 677-char remark
-
2026-06-05statusdays on market $140,000 Pending 42 DOM
-
2026-06-03days on market $140,000 Active 41 DOM
-
2026-06-02days on market $140,000 Active 40 DOM
-
2026-06-01days on market $140,000 Active 39 DOM
-
2026-05-31days on market $140,000 Active 38 DOM
-
2026-05-30days on market $140,000 Active 37 DOM
-
2026-04-23$140,000 Active
-
2025-11-25historical
-
2025-10-28price $164,000
-
2025-06-26price $169,000
-
2025-05-30$175,000 Active
-
2024-05-31historical
-
2024-03-13$199,900 Active
-
2006-05-15soldstatus $122,000
-
2006-02-24$129,900
-
2005-12-30historical
-
2005-12-02$139,900
-
2005-05-26$148,950
ⓘ Source: listings_history table (triggers on properties + properties_extension) + one-shot
backfill from property_details.listing_events for pre-trigger history.
Tax reassessment forecast FL · Resets to sale price
- Current annual tax
- $1,659 · $138/mo
- Projected year-2 tax
- $1,659 · $138/mo
- Expected delta
- $0/yr ($0/mo · 0.0%)
ⓘ Screening estimate from a state-policy table — verify with the county assessor before closing.
Climate risk First Street
- Flood 2/10 Low FEMA zone X (unshaded) · 5% chance over 30 yrs
- Wildfire 3/10 Moderate
- Heat 10/10 Extreme 7 d/yr ≥107°F today · 28 d/yr by 30 yrs out
- Wind 10/10 Extreme 99% chance of damaging wind over 30 yrs
- Air quality 2/10 Low 2 unhealthy d/yr today · 2 by 30 yrs out
Nearby sold comps map
Loading sold comps map…
Walkable amenities ~0.75 mi
Loading nearby amenities…
Taxation est. · year 1
- Rental income
- $20,947
- − Mortgage interest
- −$7,842
- − Property taxes
- −$1,659
- − Insurance
- −$700
- − Repairs & maintenance
- −$1,676
- − Management
- −$1,676
- − HOA
- −$3,492
- − Depreciation
- −$4,073
- Taxable loss
- −$170
- Est. tax savings @ 24.0%
- +$41
- After-tax cash flow
- $1,928/yr
For passive investors: Depreciation is non-cash, so a rental often shows a tax loss while cash-flowing — sheltering income. Rental losses are passive: they offset passive income freely, and up to $25,000/yr can offset ordinary (W-2) income if you actively participate and your MAGI is under $100k (phasing out to $0 by $150k); unused losses carry forward. On sale, claimed depreciation is recaptured at up to 25%, and gains may owe capital-gains tax (a 1031 exchange can defer both). Figures are a year-1 estimate at your 24.0% rate — not tax advice; consult a CPA.
Schools (NCES district)
- District
- Charlotte
- NCES district ID
- 1200240
- Math proficiency
- 54% ▼ -6.00%
- Reading proficiency
- 54% ▼ -1.00%
- Median HH income
- $44,864
- Composite
- 45.62/100
- National rank
- #2586
- State rank
- #22 of 73 in FL
Livability — Harbour Heights
- Score
- 64/100
- State rank
- #684
- US rank
- #14202
Category grades
Schools grade is shown separately in the Schools card above.
Census & demographics
- County
- Charlotte County · 196,994 people
- Metro
- Punta Gorda, FL
- Population (ZIP)
- 18,471
- Household income
- $71,856
- Rent vs Own
- Severe rent burden
- 342.0
Population outlook (Charlotte County) Hauer SSP2
- Today (2025)
- 198,646 people
- By 2030
- 210,507 · +6.0%
- By 2040
- 230,857 · +16.2%
- By 2050
- 247,148 · +24.4%
- By 2075
- 281,777 · +41.8%
- By 2100
- 293,609 · +47.8%
Race, ethnicity, and origin ACS 2023
- Neighborhood character
- Predominantly White (78%)
- Race & ethnicity
- White 78% Hispanic / Latino 9% Black 9% Two or more races 6% Asian 1%
- Hispanic origin (detail)
- Puerto Rican 3% Cuban 2%
- Common ancestry
- Romanian 4% Lithuanian 3% Italian 2%
- Foreign-born
- 11% · Canada, Jamaica
- Languages at home
- 92% English-only · Spanish 4% Other Indo-European 1% Russian/Polish/Slavic 1%
Political lean MEDSL · Charlotte
- 2024 margin
- Solid R (+34.0) · D 32.7% · R 66.7%
- 2008→2024 swing
- -26.7pp toward R · 2008: -7.2pp · 2024: -34.0pp
- All cycles
- 2024: R+34.0 2020: R+26.6 2016: R+27.8 2012: R+14.3 2008: R+7.2
Not yet ingested
- Civics
- —
Market trends
- HPI YoY
- ▼ -18.76%
- Current HPI
- 346.0116
- Rent YoY
- ▼ -2.57%
- Metro
- Punta Gorda, FL
- State GDP YoY
- ▲ 3.28%
- F500 in state
- 36
Industry mix (Fortune 500 HQ in FL)
| Industry | F500 HQs | Revenue |
|---|---|---|
| Industrial Technology | 2 | $29B |
|
||
| Insurance | 2 | $17B |
|
||
| Retail | 1 | $60B |
|
||
| Technology Distribution | 1 | $58B |
|
||
| Homebuilding | 1 | $35B |
|
||
| Technology Manufacturing | 1 | $35B |
|
||
Price history
-6.0% since first listed12 events — show timeline
- 2026-04-23 Listed $140,000 Stellar MLS as Distributed by MLS Grid
- 2025-11-25 Listing Removed — Stellar MLS as Distributed by MLS Grid
- 2025-10-28 Price Changed $164,000 Stellar MLS as Distributed by MLS Grid
- 2025-06-26 Price Changed $169,000 Stellar MLS as Distributed by MLS Grid
- 2025-05-30 Listed $175,000 Stellar MLS as Distributed by MLS Grid
- 2024-05-31 Listing Removed — Stellar MLS as Distributed by MLS Grid
- 2024-03-13 Listed $199,900 Stellar MLS as Distributed by MLS Grid
- 2006-05-15 Sold (MLS) $122,000 Stellar MLS as Distributed by MLS Grid
- 2006-02-24 Listed $129,900 Stellar MLS as Distributed by MLS Grid
- 2005-12-30 Listing Removed — Stellar MLS as Distributed by MLS Grid
- 2005-12-02 Listed $139,900 Stellar MLS as Distributed by MLS Grid
- 2005-05-26 Listed $148,950 Stellar MLS as Distributed by MLS Grid
Property tax history
+9.3%/yrLatest (2025): $1,659 · +3.4% YoY. Source: county tax records.
Cash-flow waterfall
monthlySold comps — $/sqft
last 12 mo · ≤1 miLoading sold comps…