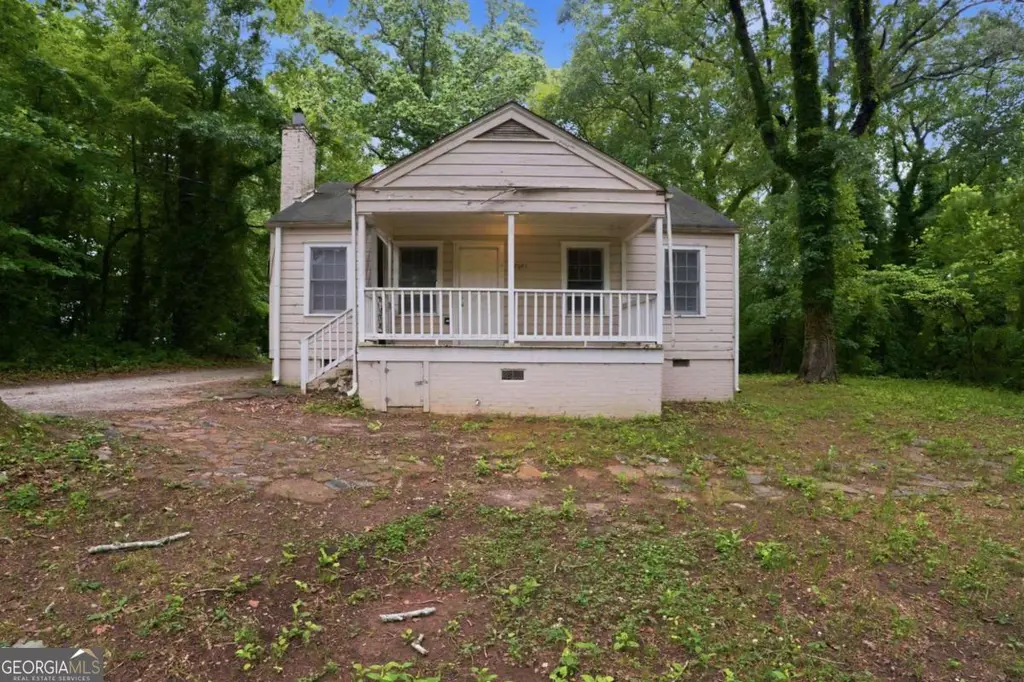
2641 Sylvan Rd · East Point, GA
Flood risk 1/10 · Minimal
- FEMA flood zone
- X (unshaded)
- Chance of flooding over 30 yrs
- 0.0%
- Est. flood insurance / yr
- $473 – $860
Fire risk 1/10 · Minimal
- Est. fire insurance / yr
- $963 – $1,789
Heat risk 6/10 · Moderate
- Hot days now (above 104°F)
- 7 days/yr
- Hot days in 30 yrs
- 18 days/yr
Wind risk 6/10 · Moderate
- Chance of severe wind over 30 yrs
- 27.0%
Air-quality risk 4/10 · Minor
- Unhealthy air days now
- 4 days/yr
- Unhealthy air days in 30 yrs
- 6 days/yr
Risk factors via First Street. Map © Google.
Why this score? — see what drove the B- grade
The composite is a weighted blend of 9 inputs, each scored 0–100. Each bar is that input's sub-score; the figure is the points it added to the 100-point composite (weight × sub-score).
- Cash flow +22.9/30.0
- ARV discount +15.0/15.0
- DSCR +7.3/10.0
- 1% rule +6.8/10.0
- Schools +4.5/10.0
- Livability +3.6/5.0
- Rent growth +2.8/5.0
- Condition / age +2.5/5.0
- Appreciation +0.0/10.0
$133,000
🖨 Deal sheet 📄 Offer letter ✓ Due diligence
Listing remarks MLS
2641 Sylvan Rd is located in a convenient Atlanta area with easy access to major highways, shopping, and public transit options. The home offers a functional layout with a comfortable main living area, a practical kitchen space, and well-sized bedrooms that provide flexibility for everyday use. The property will need some updates, giving buyers an opportunity to improve and personalize the space to their needs. Situated on a residential street with nearby neighborhood amenities, this location also provides quick access to Hartsfield-Jackson Atlanta International Airport and downtown Atlanta.
Key facts
- Well-sized bedrooms
- Residential street
- Functional layout
Tags
Property features AI
Exterior
- Parking: Driveway parking; Open parking available
- Utilities: Water: Other; Sewer: Other; Electric: Other; Other utilities listed
- Home design: One-level home; Resale property; Slab foundation; Wood siding; Composition roof
- Construction: Wood siding construction; Composition shingle roof; Slab foundation
- Exterior features: Asphalt road frontage on a city street
Interior
- Kitchen: Electric range; Refrigerator; Stain-finished cabinets; Eat-in kitchen; Solid surface counters; Open view to the family room
- Bedrooms: Two main-level bedrooms; Bedroom features: Other
- Flooring: Carpet; Vinyl
- Bathrooms: One full bathroom with tub/shower combo (main level)
- Heating & cooling: Central heating (electric); Central air conditioning
- Interior features: Bookcases; Finished basement; One fireplace located in the family room; No shared/common walls
- Laundry & utility: Laundry located in the kitchen
Neighborhood map
What this means for you Summary
Snapshot
- This is a 2-bed/1.0-bath single-family listed at $133k.
Deal economics
- At list price, monthly cash flow is $232 ($3k/yr) — positive.
- The deal already cash-flows at list — no discount required.
- Meets the 1% rule at list price ($2k rent vs $133k).
- Cap rate 8.4% vs local median 5.1% in East Point — top-decile yield for the area; either an underpriced asset or a hidden risk that comps aren't pricing in. Stress-test before assuming the spread holds.
Location & tenants
- Location reads 72/100 on livability (#72 in GA) — a middle-class / working-renter tenant base. Strengths: commute A+, cost of living A+, housing A+; Watch: employment D+, schools F, crime F.
- Fulton County (suburban): math 49% / reading 53% proficiency, ranked #12 of 174 in GA (top 7%) — acceptable for families but not a draw, mixed tenant base, ~2y average lease.
- Market conditions: Rents rising (+1.4%/yr); 283 active listings in the ZIP; 40 comparable units currently listed for rent nearby; rentals at typical pace (median 24d on market — plan ~3-4 weeks tenant-placement turnaround); 11,565 units permitted in Fulton County in 2024 (8,159 in 5+ unit buildings).
Forward outlook
- Local home prices are declining (-3.0%/yr); year-one equity from $920 of loan paydown is wiped out by about $4k of value loss. Plan a longer hold.
- Fulton County population projected at +38% by 2050 — long-run rental-demand tailwind backs the buy-and-hold thesis.
Negotiation context
- Only 14 days on market — expect competitive offers; lowballing is unlikely to land.
- 5 sale attempts since 15y ago with the ask held roughly flat each time — persistent listings suggest the price (not the market) is what's stuck; bring a comps-based counter.
Risks & watch-outs
- Watch-outs: built in 1945 — expect roof / HVAC / electrical / plumbing capex.
- Climate carrying-cost: major wind risk, 27% chance of damaging wind over 30y; extreme-heat days projected 7→18/yr by 2055 (HVAC capex compounding) — expect insurance premiums to compound above CPI over the hold.
Questions for the listing agent
- Built in 1945 — when were the roof, HVAC, electrical panel, plumbing, and water heater last replaced?
- Is there a deadline driving the sale (1031 exchange, divorce, estate, relocation)? That informs how much negotiation room exists.
- Schools are F-rated, which usually means shorter tenancies and higher turnover. Who's the typical renter profile here, and what's been the actual vacancy rate?
- Crime grade is F in this area — have there been break-ins, vandalism, or insurance claims at this property in the last 3 years? What carrier currently insures it and at what premium?
- What's the average days-on-market for RENTAL listings here right now (not sales)? A rising rental-DOM trend means longer vacancies and softer asking-rent achievability than the comps imply.
- What's the recent tenant-quality profile in this submarket — average credit score on applications, eviction rate, late-payment / NSF rate, and stable-employment percentage? A property-management company in the area should have these aggregated.
- How much new for-sale + rental construction is in the pipeline within 1–3 miles? Heavy new supply typically softens prices + rents 12–24 months out; constrained supply supports both.
Investment metrics
- 1% rule
- 1.18% ✓
- Cap rate
- 8.39%
- Cash-on-cash
- 7.49%
- DSCR
- 1.33
- GRM
- 7.0
CMA / ARV
- ARV (on-the-fly)
- $173,400
- Comps found
- 12
Show comp detail 12 sales within ~0.75 mi
| Address | Dist | Beds/Ba | Sqft | Sold | Price | $/sf | Match |
|---|---|---|---|---|---|---|---|
| 732 Quaker St SW | 0.41mi | 2/1.5 | 1,048 (+3%) | 3mo | $235,000 | $224 | 72 |
| 2463 Jewel St | 0.50mi | 3/1.0 (+1) | 1,014 (-1%) | 0mo | $274,900 | $271 | 70 |
| 804 Brookdale Dr SW | 0.29mi | 3/1.0 (+1) | 1,107 (+8%) | 3mo | $188,000 | $170 | 65 |
| 2484 Sylvan Ter | 0.28mi | 2/1.0 | 1,166 (+14%) | 2mo | $133,000 | $114 | 61 |
| 2931 Diana Dr SW | 0.69mi | 3/1.5 (+1) | 1,000 (-2%) | 1mo | $220,000 | $220 | 57 |
| 682 Steve Dr SW | 0.66mi | 2/1.5 | 975 (-4%) | 5mo | $90,000 | $92 | 55 |
| 2928 Diana Dr SW | 0.70mi | 3/1.0 (+1) | 1,000 (-2%) | 5mo | $87,000 | $87 | 55 |
| 1000 Poplar St | 0.68mi | 3/2.0 (+1) | 1,024 (+0%) | 9mo | $131,770 | $129 | 52 |
| 721 Yale Pl SW | 0.71mi | 3/1.0 (+1) | 1,048 (+3%) | 10mo | $162,000 | $155 | 49 |
| 1222 E Forrest Ave | 0.56mi | 2/2.0 | 1,160 (+14%) | 3mo | $225,000 | $194 | 44 |
| 2877 Blount St | 0.49mi | 3/1.0 (+1) | 1,164 (+14%) | 9mo | $105,000 | $90 | 41 |
| 2938 Palm Dr | 0.57mi | 3/2.0 (+1) | 1,150 (+13%) | 3mo | $209,900 | $183 | 41 |
Match score weights: distance 35% · size 25% · config 20% · recency 20%. Top-matched comps best support the ARV.
Projected returns pro-forma
-3.0% appreciation · 1.35% rent growth · sell at horizon
- IRR
- -6.8%
- Equity multiple
- 0.75×
- Total profit
- $-9,237
- Equity at exit
- $19,831
- IRR
- 0.5%
- Equity multiple
- 1.03×
- Total profit
- $1,143
- Equity at exit
- $11,499
Cash invested: $37,240 (down + closing). Projections, not guarantees.
Landlord ↔ Tenant lean methodology
- Overall (STATE)
- 90 Strongly Landlord-Friendly
- State Georgia
- 90 Strongly Landlord-Friendly · R+3
- County
- — inherits STATE
- City
- — inherits STATE
ZIP-level market 30344
- Home prices YoY
- -31.0%
- Rents YoY
- 1.4%
- Active inventory
- 283
- Price-to-rent
- 7.0×
Monthly cashflow live
- Estimated rent
- $1,574 high interval (Pro) →
- Mortgage (P&I)
- −$697
- Tax from tax record
- −$258 /mo · $3,097/yr
- Insurance
- −$55
- HOA
- −$0
- Vacancy / Maint / Mgmt
- −$331
- Net cashflow
- $232
Break-even live
UW: 25.0% down · 7.5% · 30yr · 1.5% tax · 5.0% vac · 8.0% maint · 8.0% mgmt
Financing live
Cash to close
- Down payment
- $33,250
- Closing costs
- $3,990
- Reserves months
- —
- Total cash needed
- —
Loan-product check · same deal, 3 products live
Conventional
25% down · 7.5% · 30yr
- Down + closing
- —
- Monthly P&I
- —
- Monthly cashflow
- —
- DSCR
- —
- Eligible?
- —
Personal DTI + credit; lowest rate.
DSCR
20% down · 8.5% · 30yr
- Down + closing
- —
- Monthly P&I
- —
- Monthly cashflow
- —
- DSCR
- —
- Eligible?
- —
No personal income docs; deal must DSCR.
Hard money
10% down · 12.0% · 12mo
- Down + closing
- —
- Monthly P&I
- —
- Monthly cashflow
- —
- DSCR
- —
- Eligible?
- —
Short-term bridge; refi at stabilization.
Rent comps 40 comps
| Address | Beds | Baths | Sqft | Rent | $/sqft | DOM | Units | Dist |
|---|---|---|---|---|---|---|---|---|
| 2636 Acadia St Atlanta, GA | 3.0 | 2.0 | 1300 | $1,800 | $1.38 | 24d | 1 | 0.19mi |
| 2626 Blount St Atlanta, GA | 2.0 | 1.0 | 1314 | $1,460 | $1.11 | 24d | 1 | 0.23mi |
| 2744 Miles Cir Unit 2746 Atlanta, GA | 2.0 | 1.0 | 800 | $1,295 | $1.62 | 1d | 1 | 0.26mi |
| 2663 Blount St Atlanta, GA | 3.0 | 2.0 | 1168 | $1,650 | $1.41 | 16d | 1 | 0.28mi |
| 2718 Miles Cir Unit 1 Atlanta, GA | 2.0 | 1.0 | 750 | $1,300 | $1.73 | 15d | 1 | 0.29mi |
| 2801 Palm Dr Atlanta, GA | 3.0 | 1.0 | 1064 | $1,550 | $1.46 | 12d | 1 | 0.30mi |
| 2748 Blount St Atlanta, GA | 3.0 | 1.0 | 1068 | $1,850 | $1.73 | 43d | 1 | 0.31mi |
| 2456 Harwood Dr Atlanta, GA | 2.0 | 2.0 | 1176 | $1,995 | $1.70 | 43d | 1 | 0.35mi |
| 2874 Blount St Atlanta, GA | 3.0 | 1.0 | 1190 | $1,750 | $1.47 | 5d | 1 | 0.47mi |
| 2952 Palm Dr Atlanta, GA | 3.0 | 2.0 | 1120 | $1,875 | $1.67 | 5d | 1 | 0.59mi |
| 2710 Winburn Ter Atlanta, GA | 3.0 | 2.0 | 1500 | $1,800 | $1.20 | 43d | 1 | 0.62mi |
| 751 Yale Pl SW Atlanta, GA | 3.0 | 2.0 | 1230 | $1,499 | $1.22 | 24d | 1 | 0.69mi |
| 745 Yale Pl SW Atlanta, GA | 3.0 | 1.0 | 1048 | $2,200 | $2.10 | 24d | 1 | 0.69mi |
| 1255 Pine Ave Unit 2 East Point, GA | 2.0 | 1.0 | 700 | $1,400 | $2.00 | 43d | 1 | 0.69mi |
| 532 Cleveland Ave SW Atlanta, GA | 2.0 | 1.0 | 836 | $950 | $1.14 | 14d | 1 | 0.73mi |
| 532 Cleveland Ave SW Atlanta, GA | 2.0 | 1.0 | 836 | $925 | $1.11 | 22d | 1 | 0.73mi |
| 1100 Washington Cir Atlanta, GA | 1.0–4.0 | 1.0–1.5 | 1000 | $1,333 | $1.33 | 2d | 1 | 0.75mi |
| 1344 Winburn Dr Atlanta, GA | 3.0 | 2.0 | 1388 | $2,100 | $1.51 | 24d | 1 | 0.80mi |
| 1354 Winburn Dr Atlanta, GA | 2.0 | 1.0 | 1089 | $1,750 | $1.61 | 24d | 1 | 0.82mi |
| 1354 Winburn Dr Atlanta, GA | 3.0 | 1.0 | 1000 | $1,850 | $1.85 | 5d | 1 | 0.82mi |
| 488 Pomona Cir SW Atlanta, GA | 3.0 | 1.0 | 1000 | $1,800 | $1.80 | 24d | 1 | 0.83mi |
| 1366 Bryan Ave Unit A Atlanta, GA | 2.0 | 1.5 | 1181 | $1,600 | $1.35 | 43d | 1 | 0.87mi |
| 1377 Pine Ave Atlanta, GA | 3.0 | 2.0 | 1100 | $1,675 | $1.52 | 22d | 1 | 0.91mi |
| 1244 Calhoun Ave Atlanta, GA | 3.0 | 1.5 | 1072 | $1,673 | $1.56 | 43d | 1 | 0.91mi |
| 1347 Washington Rd Unit A East Point, GA | 2.0 | 1.0 | 1250 | $1,049 | $0.84 | 43d | 1 | 0.94mi |
| 3028 Grand Ave SW Atlanta, GA | 1.0 | 1.0 | 1048 | $900 | $0.86 | 5d | 1 | 0.96mi |
| 3018 Grand Ave SW Atlanta, GA | 2.0 | 1.0 | 825 | $1,400 | $1.70 | 4d | 1 | 0.97mi |
| 2875 3rd Ave SW Unit A Atlanta, GA | 2.0 | 1.0 | 900 | $1,245 | $1.38 | 1d | 1 | 0.97mi |
| 1408 Lyle Ave Unit A Atlanta, GA | 2.0 | 1.0 | 842 | $1,350 | $1.60 | 24d | 1 | 1.02mi |
| 643 Langston Dr SW Atlanta, GA | 3.0 | 2.0 | 1180 | $2,000 | $1.69 | 24d | 1 | 1.03mi |
| 3162 Oakdale Rd Atlanta, GA | 3.0 | 1.0 | 1040 | $3,200 | $3.08 | 43d | 1 | 1.05mi |
| 1455 Bryan Ave Unit B Atlanta, GA | 2.0 | 1.0 | 1482 | $1,300 | $0.88 | 24d | 1 | 1.05mi |
| 1305 Clermont Ave Atlanta, GA | 2.0 | 2.0 | 1000 | $1,750 | $1.75 | 24d | 1 | 1.10mi |
| 735 Oak Dr Hapeville, GA | 2.0 | 1.0 | 1053 | $1,550 | $1.47 | 22d | 1 | 1.12mi |
| 3116 Jackson St Atlanta, GA | 2.0 | 2.0 | 1016 | $1,900 | $1.87 | 43d | 1 | 1.19mi |
| 278 Moreland Way Atlanta, GA | 3.0 | 2.0 | 1000 | $1,945 | $1.95 | 24d | 1 | 1.19mi |
| 2021 Brewer Blvd SW Atlanta, GA | 3.0 | 2.0 | 1178 | $1,795 | $1.52 | 7d | 1 | 1.20mi |
| 2952 Holland Ct Atlanta, GA | 1.0 | 1.0 | 1400 | $675 | $0.48 | 1d | 1 | 1.21mi |
| 1060 Regent St SW Atlanta, GA | 3.0 | 2.0 | 1390 | $2,500 | $1.80 | 24d | 1 | 1.23mi |
| 2627 N Church St East Point, GA | 2.0–3.0 | 1.0–2.0 | 1020 | $1,289 | $1.26 | 22d | 2 | 1.27mi |
Listing history 9 events
-
2026-06-18days on market $133,000 Active 14 DOM
-
2026-06-17days on market $133,000 Active 13 DOM
-
2026-06-16days on market $133,000 Active 12 DOM
-
2026-06-15days on market $133,000 Active 11 DOM
-
2026-06-13days on market $133,000 Active 9 DOM
-
2026-06-09days on market $133,000 Active 5 DOM
-
2026-06-08days on market $133,000 Active 4 DOM
-
2026-06-07remarks 598-char remark
-
2026-06-07$133,000 Active 3 DOM
ⓘ Source: listings_history table (triggers on properties + properties_extension) + one-shot
backfill from property_details.listing_events for pre-trigger history.
Tax reassessment forecast GA · Resets to sale price
- Current annual tax
- $3,097 · $258/mo
- Projected year-2 tax
- $3,097 · $258/mo
- Expected delta
- $0/yr ($0/mo · 0.0%)
ⓘ Screening estimate from a state-policy table — verify with the county assessor before closing.
Climate risk First Street
- Flood 1/10 Low FEMA zone X (unshaded) · 0% chance over 30 yrs
- Wildfire 1/10 Low
- Heat 6/10 Major 7 d/yr ≥104°F today · 18 d/yr by 30 yrs out
- Wind 6/10 Major 27% chance of damaging wind over 30 yrs
- Air quality 4/10 Moderate 4 unhealthy d/yr today · 6 by 30 yrs out
Nearby sold comps map
Loading sold comps map…
Walkable amenities ~0.75 mi
Loading nearby amenities…
Taxation est. · year 1
- Rental income
- $18,887
- − Mortgage interest
- −$7,450
- − Property taxes
- −$3,097
- − Insurance
- −$665
- − Repairs & maintenance
- −$1,511
- − Management
- −$1,511
- − Depreciation
- −$3,869
- Taxable income
- $784
- Est. tax owed @ 24.0%
- −$188
- After-tax cash flow
- $2,601/yr
For passive investors: Depreciation is non-cash, so a rental often shows a tax loss while cash-flowing — sheltering income. Rental losses are passive: they offset passive income freely, and up to $25,000/yr can offset ordinary (W-2) income if you actively participate and your MAGI is under $100k (phasing out to $0 by $150k); unused losses carry forward. On sale, claimed depreciation is recaptured at up to 25%, and gains may owe capital-gains tax (a 1031 exchange can defer both). Figures are a year-1 estimate at your 24.0% rate — not tax advice; consult a CPA.
Schools (NCES district)
- District
- Fulton County
- NCES district ID
- 1302280
- Math proficiency
- 49% ▼ -2.00%
- Reading proficiency
- 53% ▬ 0.00%
- Median HH income
- $68,035
- Composite
- 45.33/100
- National rank
- #2640
- State rank
- #12 of 174 in GA
Livability — East Point
- Score
- 72/100
- State rank
- #72
- US rank
- #6314
Category grades
Schools grade is shown separately in the Schools card above.
Census & demographics
- Census place
- East Point, GA
- County
- Fulton County · 1,094,430 people
- City population
- 35,456
- Metro
- Atlanta-Sandy Springs-Alpharetta, GA
- Population (ZIP)
- 35,456
- Household income
- $68,380
- Rent vs Own
- Severe rent burden
- 2226.0
Population outlook (Fulton County) Hauer SSP2
- Today (2025)
- 1,203,707 people
- By 2030
- 1,299,706 · +8.0%
- By 2040
- 1,488,256 · +23.6%
- By 2050
- 1,664,580 · +38.3%
- By 2075
- 2,036,072 · +69.2%
- By 2100
- 2,222,402 · +84.6%
Race, ethnicity, and origin ACS 2023
- Neighborhood character
- Predominantly Black (74%)
- Race & ethnicity
- Black 74% White 11% Hispanic / Latino 11% Two or more races 6%
- Hispanic origin (detail)
- Mexican 7% Puerto Rican 1%
- Common ancestry
- Italian 1% Swiss 1% Russian 1%
- Foreign-born
- 6% · Canada, Jamaica
- Languages at home
- 87% English-only · Spanish 9% Other Indo-European 1% German/W. Germanic 1%
Political lean MEDSL · Fulton
- 2024 margin
- Solid D (+44.9) · D 71.9% · R 27.0% · Other 1.1%
- 2008→2024 swing
- +9.8pp toward D · 2008: 35.0pp · 2024: 44.9pp
- All cycles
- 2024: D+44.9 2020: D+46.4 2016: D+42.1 2012: D+29.6 2008: D+35.0
Not yet ingested
- Civics
- —
Market trends
- HPI YoY
- ▼ -113.15%
- Current HPI
- 251.7916
- Rent YoY
- ▲ 1.35%
- Metro
- Atlanta-Sandy Springs-Alpharetta, GA
- State GDP YoY
- ▲ 2.66%
- F500 in state
- 28
Industry mix (Fortune 500 HQ in GA)
| Industry | F500 HQs | Revenue |
|---|---|---|
| Paper / Packaging | 2 | $29B |
|
||
| Retail | 1 | $160B |
|
||
| Transportation / Logistics | 1 | $91B |
|
||
| Airlines | 1 | $62B |
|
||
| Consumer Goods | 1 | $47B |
|
||
| Utilities | 1 | $25B |
|
||
Price history
+174.2% since first listed20 events — show timeline
- 2026-06-04 Listed $133,000 FMLS
- 2026-06-04 Listed $133,000 GAMLS
- 2021-06-16 Sold (Public Records) $19,113,200 Public Records
- 2015-10-27 Price Changed $27,500 GAMLS
- 2013-10-07 Sold (Public Records) $27,500 Public Records
- 2013-10-02 Price Changed $27,500 FMLS
- 2013-10-02 Listing Removed — FMLS
- 2013-09-27 Sold (MLS) $27,500 GAMLS
- 2013-09-27 Price Changed $40,000 FMLS
- 2013-09-27 Sold (MLS) $27,500 FMLS
- 2013-09-20 Pending — GAMLS
- 2013-09-20 Pending — FMLS
- 2013-09-20 Price Changed $40,000 GAMLS
- 2013-07-20 Price Changed $40,000 GAMLS
- 2013-07-20 Price Changed $40,000 FMLS
- 2013-04-28 Listed $45,000 GAMLS
- 2013-04-22 Listed $45,000 FMLS
- 2012-02-29 Listing Removed — GAMLS
- 2011-09-02 Listed $36,000 GAMLS
- 1990-03-20 Sold (Public Records) $48,500 Public Records
Property tax history
+7.4%/yrLatest (2025): $3,097 · -0.0% YoY. Source: county tax records.
Cash-flow waterfall
monthlySold comps — $/sqft
last 12 mo · ≤1 miLoading sold comps…