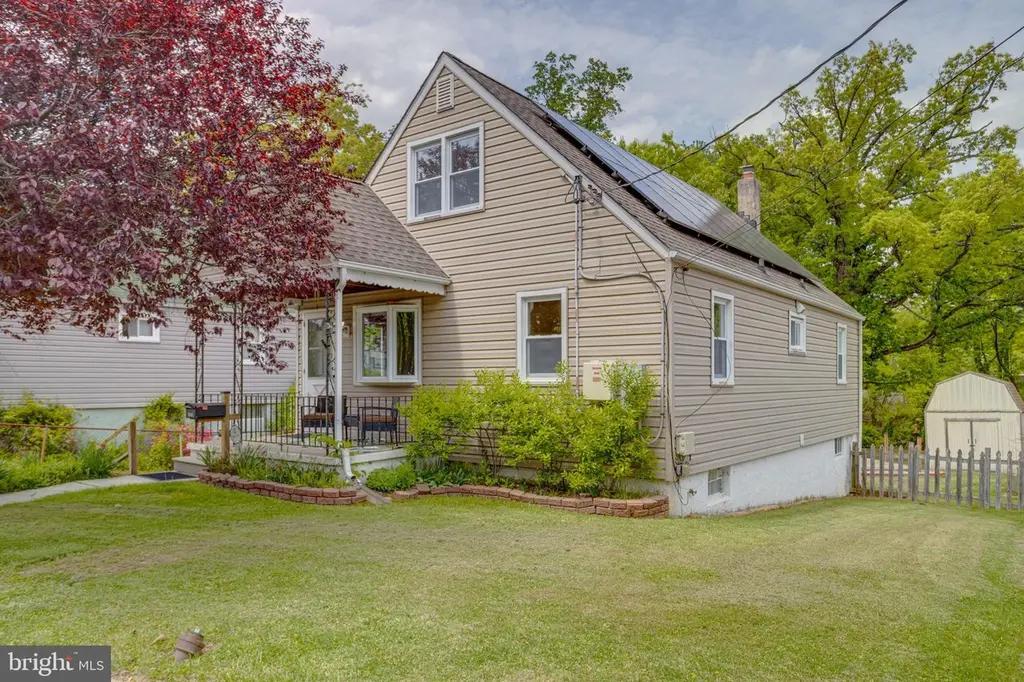
3116 California Ave · Parkville, MD
Flood risk 6/10 · Moderate
- FEMA flood zone
- X (unshaded)
- Chance of flooding over 30 yrs
- 0.75%
- Est. flood insurance / yr
- $473 – $860
Fire risk 1/10 · Minimal
- Est. fire insurance / yr
- $755 – $1,403
Heat risk 7/10 · Major
- Hot days now (above 104°F)
- 7 days/yr
- Hot days in 30 yrs
- 15 days/yr
Wind risk 6/10 · Moderate
- Chance of severe wind over 30 yrs
- 27.0%
Air-quality risk 4/10 · Minor
- Unhealthy air days now
- 5 days/yr
- Unhealthy air days in 30 yrs
- 7 days/yr
Risk factors via First Street. Map © Google.
Why this score? — see what drove the D grade
The composite is a weighted blend of 9 inputs, each scored 0–100. Each bar is that input's sub-score; the figure is the points it added to the 100-point composite (weight × sub-score).
- ARV discount +12.9/15.0
- Cash flow +9.4/30.0
- Rent growth +4.2/5.0
- Livability +3.9/5.0
- DSCR +2.6/10.0
- 1% rule +2.5/10.0
- Condition / age +2.5/5.0
- Schools +2.3/10.0
- Appreciation +0.0/10.0
$315,000
🖨 Deal sheet 📄 Offer letter ✓ Due diligence
Listing remarks
Welcome to this charming 4 bed, 1.5 bath cape cod located in Parkville just seconds off of Harford Rd and I-695, and a short distance from shopping and dining destinations. Pull into the driveway and enter in through the covered front porch. walking inside brings you to a living room area with hardwood floors throughout. Walking straight back through this area will bring you to two carpeted bedrooms and a full bath with tub/shower combo. To the left of this short hallway is the eat in kitchen with plenty of counter space and all appliances included. Sliders off of the kitchen area open out onto the wood rear deck which overlooks the backyard and has steps that walk down to the yard and to t
Key facts
- Covered front porch
- Wood rear deck
- Eat in kitchen
Tags
Property features AI
Finance
- Other: Assessed year and values referenced by assessor
- Financial info: Fee simple ownership; Listed annual ground rent (income/expense note)
Exterior
- Parking: Driveway
- Utilities: Public water; Public sewer; Electric cooling; Natural gas heating and hot water
- Home design: Detached property; Mixed construction
- Construction: Permanent foundation; Above-grade and below-grade structures
- Exterior features: Ground rent exists (paid annually); Lot dimensions reported
Interior
- Bedrooms: Two bedrooms on the main level; Two bedrooms on the upper level
- Bathrooms: One full bathroom; One half bathroom
- Heating & cooling: Central heating (natural gas); Central air conditioning (electric); Natural gas hot water
- Interior features: One fireplace; Fully finished basement; Living area reported as estimated
Neighborhood map
What this means for you Summary
Snapshot
- This is a 4-bed/1.0-bath single-family listed at $315k.
Deal economics
- At list price, monthly cash flow is $-225 ($-3k/yr) — negative.
- To cash-flow at today's rent, offer at most $275k (12.6% below list).
- To meet the 1% rule (rent ≥ 1% of price), the offer needs to be $238k (24.5% below list).
- Recommended offer: $238k (24.5% below list) — sets the bar for 1% rule.
Location & tenants
- Location reads 77/100 on livability (#77 in MD, #2,839 nationally) — a middle-class / working-renter tenant base. Strengths: commute A+, housing A+, health & safety A+; Watch: schools F, crime F.
- Baltimore County Public Schools (suburban): math 15% / reading 34% proficiency, ranked #11 of 24 in MD (top 46%) — low school quality limits family demand, transient renter base, plan for 1-2y turnover.
- Market conditions: Rents rising fast (+6.7%/yr); 225 active listings in the ZIP; 25 comparable units currently listed for rent nearby; rentals at typical pace (median 24d on market — plan ~3-4 weeks tenant-placement turnaround); 48% of comp listings sitting > 30 days — soft ceiling on asking rent; solid renter incomes; 1,511 units permitted in Baltimore County in 2024 (643 in 5+ unit buildings).
- This rent runs 34% of the median local income ($84k/yr) — at the standard rent-burdened threshold; future hikes will face affordability resistance.
Forward outlook
- Local home prices are declining (-3.0%/yr); year-one equity from $2k of loan paydown is wiped out by about $9k of value loss. Plan a longer hold.
- Baltimore County population projected at +12% by 2050 — modest demand growth; plan on rents tracking national, not racing it.
Negotiation context
- Only 5 days on market — expect competitive offers; lowballing is unlikely to land.
Risks & watch-outs
- Watch-outs: built in 1955 — expect roof / HVAC / electrical / plumbing capex.
- Climate carrying-cost: major flood risk; major wind risk, 27% chance of damaging wind over 30y; extreme-heat days projected 7→15/yr by 2055 (HVAC capex compounding) — expect insurance premiums to compound above CPI over the hold.
Questions for the listing agent
- What do current leases actually rent for vs. the listed asking? Can we see a recent rent roll and the last 12 months of T-12 income?
- Built in 1955 — when were the roof, HVAC, electrical panel, plumbing, and water heater last replaced?
- Is there a deadline driving the sale (1031 exchange, divorce, estate, relocation)? That informs how much negotiation room exists.
- Schools are F-rated, which usually means shorter tenancies and higher turnover. Who's the typical renter profile here, and what's been the actual vacancy rate?
- Crime grade is F in this area — have there been break-ins, vandalism, or insurance claims at this property in the last 3 years? What carrier currently insures it and at what premium?
- The area grade is low — what's the realistic commute time and amenity access for the typical tenant pool here? Any planned neighborhood developments (good or bad) we should know about?
- What's the average days-on-market for RENTAL listings here right now (not sales)? A rising rental-DOM trend means longer vacancies and softer asking-rent achievability than the comps imply.
- What's the recent tenant-quality profile in this submarket — average credit score on applications, eviction rate, late-payment / NSF rate, and stable-employment percentage? A property-management company in the area should have these aggregated.
- How much new for-sale + rental construction is in the pipeline within 1–3 miles? Heavy new supply typically softens prices + rents 12–24 months out; constrained supply supports both.
Investment metrics
- 1% rule
- 0.75% ✗
- Cap rate
- 5.43%
- Cash-on-cash
- -3.07%
- DSCR
- 0.86
- GRM
- 11.0
CMA / ARV
- ARV (median comp)
- $357,797
- List price
- $315,000
- Delta
- -11.96%
- Verdict
- UNDERPRICED
- Comps
- 20 within 1.0 mi
Show comp detail 12 sales within ~0.75 mi
| Address | Dist | Beds/Ba | Sqft | Sold | Price | $/sf | Match |
|---|---|---|---|---|---|---|---|
| 9102 Lamaze Rd | 0.34mi | 3/1.5 (-1) | 1,508 (-7%) | 2mo | $375,000 | $249 | 64 |
| 9307 Avondale Rd | 0.41mi | 3/2.5 (-1) | 1,670 (+3%) | 7mo | $306,000 | $183 | 59 |
| 3309 Glenside Dr | 0.27mi | 3/2.5 (-1) | 1,764 (+9%) | 6mo | $365,000 | $207 | 57 |
| 2910 Manns Ave | 0.61mi | 3/1.5 (-1) | 1,598 (-2%) | 6mo | $232,000 | $145 | 56 |
| 3422 Upton Rd | 0.45mi | 3/2.0 (-1) | 1,508 (-7%) | 6mo | $370,000 | $245 | 53 |
| 2924 Manns Ave | 0.55mi | 3/1.0 (-1) | 1,477 (-9%) | 1mo | $284,200 | $192 | 53 |
| 3033 Parktowne Rd | 0.73mi | 3/2.0 (-1) | 1,694 (+4%) | 1mo | $355,600 | $210 | 49 |
| 3017 Parktowne Rd | 0.74mi | 3/2.5 (-1) | 1,591 (-2%) | 3mo | $310,000 | $195 | 49 |
| 2712 Burridge Rd | 0.63mi | 3/2.0 (-1) | 1,508 (-7%) | 2mo | $355,000 | $235 | 48 |
| 2939 Manns Ave | 0.49mi | 3/1.5 (-1) | 1,382 (-15%) | 1mo | $285,000 | $206 | 45 |
| 2812 5th Ave | 0.72mi | 3/1.5 (-1) | 1,454 (-10%) | 2mo | $320,000 | $220 | 40 |
| 3316 Willoughby Rd | 0.60mi | 3/2.5 (-1) | 1,466 (-10%) | 6mo | $330,000 | $225 | 39 |
Match score weights: distance 35% · size 25% · config 20% · recency 20%. Top-matched comps best support the ARV.
Projected returns pro-forma
-3.0% appreciation · 6.68% rent growth · sell at horizon
- IRR
- -17.5%
- Equity multiple
- 0.36×
- Total profit
- $-56,285
- Equity at exit
- $46,968
- IRR
- -4.0%
- Equity multiple
- 0.69×
- Total profit
- $-27,131
- Equity at exit
- $27,235
Cash invested: $88,200 (down + closing). Projections, not guarantees.
Landlord ↔ Tenant lean methodology
- Overall (STATE)
- 27 Tenant-Leaning
- State Maryland
- 27 Tenant-Leaning · D+14
- County
- — inherits STATE
- City
- — inherits STATE
ZIP-level market 21234
- Rents YoY
- 6.7%
- Active inventory
- 225
- Price-to-rent
- 11.0×
Monthly cashflow live
- Estimated rent
- $2,378 high interval (Pro) →
- Mortgage (P&I)
- −$1,652
- Tax from tax record
- −$321 /mo · $3,848/yr
- Insurance
- −$131
- HOA
- −$0
- Vacancy / Maint / Mgmt
- −$499
- Net cashflow
- $-225
Break-even live
UW: 25.0% down · 7.5% · 30yr · 1.5% tax · 5.0% vac · 8.0% maint · 8.0% mgmt
Financing live
Cash to close
- Down payment
- $78,750
- Closing costs
- $9,450
- Reserves months
- —
- Total cash needed
- —
Loan-product check · same deal, 3 products live
Conventional
25% down · 7.5% · 30yr
- Down + closing
- —
- Monthly P&I
- —
- Monthly cashflow
- —
- DSCR
- —
- Eligible?
- —
Personal DTI + credit; lowest rate.
DSCR
20% down · 8.5% · 30yr
- Down + closing
- —
- Monthly P&I
- —
- Monthly cashflow
- —
- DSCR
- —
- Eligible?
- —
No personal income docs; deal must DSCR.
Hard money
10% down · 12.0% · 12mo
- Down + closing
- —
- Monthly P&I
- —
- Monthly cashflow
- —
- DSCR
- —
- Eligible?
- —
Short-term bridge; refi at stabilization.
Rent comps 25 comps
| Address | Beds | Baths | Sqft | Rent | $/sqft | DOM | Units | Dist |
|---|---|---|---|---|---|---|---|---|
| 3407 Orbitan Rd Parkville, MD | 3.0 | 1.5 | 1508 | $2,200 | $1.46 | 23d | 1 | 0.29mi |
| 2908 5th Ave Parkville, MD | 3.0 | 1.0 | 1260 | $1,950 | $1.55 | 43d | 1 | 0.70mi |
| 7935 Belridge Rd Nottingham, MD | 1.0–3.0 | 1.0–1.5 | 974 | $2,172 | $2.23 | 2d | 17 | 0.77mi |
| 3201 E Joppa Rd Parkville, MD | 3.0 | 1.5 | 1812 | $2,800 | $1.55 | 43d | 1 | 0.78mi |
| 3617 Double Rock Ln Parkville, MD | 3.0 | 2.5 | 2000 | $2,395 | $1.20 | 4d | 1 | 0.79mi |
| 24 Maple Hollow Ct Parkville, MD | 3.0 | 3.5 | 1600 | $2,400 | $1.50 | 43d | 1 | 1.08mi |
| 24 Lerner Ct Unit 32H Nottingham, MD | 3.0 | 2.0 | 1556 | $2,295 | $1.47 | 17d | 1 | 1.08mi |
| 8500 Arry Pl Parkville, MD | 3.0 | 2.5 | 2100 | $2,500 | $1.19 | 43d | 1 | 1.11mi |
| 21 Monhegan Ct Unit 28B Nottingham, MD | 3.0 | 2.0 | 1436 | $1,900 | $1.32 | 43d | 1 | 1.12mi |
| 8529 Ramort Dr Unit 22A Nottingham, MD | 3.0 | 2.0 | 1896 | $2,495 | $1.32 | 17d | 1 | 1.12mi |
| 9 Robinway Ct Unit 25E Nottingham, MD | 3.0 | 2.0 | 1500 | $2,750 | $1.83 | 43d | 1 | 1.13mi |
| 8507 Gradien Dr Baltimore, MD | 3.0 | 1.5 | 1056 | $2,100 | $1.99 | 23d | 1 | 1.14mi |
| 9702 Oakdale Ave Parkville, MD | 4.0 | 2.0 | 1188 | $2,000 | $1.68 | 43d | 1 | 1.15mi |
| 2 Durness Ct Unit 30I Nottingham, MD | 3.0 | 2.0 | 1446 | $2,100 | $1.45 | 43d | 1 | 1.16mi |
| 8552 Hydra Ln Unit 11G Nottingham, MD | 4.0 | 2.0 | 1296 | $2,872 | $2.22 | 17d | 1 | 1.22mi |
| 8503 Kings Ridge Rd Parkville, MD | 4.0 | 2.0 | 1200 | $2,100 | $1.75 | 4d | 1 | 1.24mi |
| 9005 Perring Park Rd Parkville, MD | 3.0 | 2.5 | 2146 | $3,000 | $1.40 | 16d | 1 | 1.26mi |
| 8334 Tapu Ct Nottingham, MD | 3.0 | 2.5 | 1302 | $2,100 | $1.61 | 14d | 1 | 1.28mi |
| 21 Kirwin Ct Parkville, MD | 4.0 | 2.5 | 1800 | $2,872 | $1.60 | 17d | 1 | 1.30mi |
| 8768 Cimarron Cir Parkville, MD | 4.0 | 1.5 | 1752 | $2,395 | $1.37 | 23d | 1 | 1.34mi |
| 2912 Hillcrest Ave Parkville, MD | 5.0 | 2.0 | 1648 | $2,900 | $1.76 | 43d | 1 | 1.36mi |
| 3108 Glendale Ave Parkville, MD | 3.0 | 3.0 | 1224 | $2,550 | $2.08 | 23d | 1 | 1.39mi |
| 9730 Red Clover Ct Parkville, MD | 3.0 | 1.5 | 1280 | $2,200 | $1.72 | 43d | 1 | 1.40mi |
| 7839 Birmingham Ave Parkville, MD | 3.0 | 1.0 | 1136 | $1,775 | $1.56 | 43d | 1 | 1.41mi |
| 5 Belhaven Dr Nottingham, MD | 4.0 | 1.5 | 1554 | $2,000 | $1.29 | 43d | 1 | 1.42mi |
Listing history 3 events
-
2026-05-10status Pending 1445-char remark
-
2026-05-08historical 1445-char remark
-
2026-05-03$315,000 Active 1445-char remark
ⓘ Source: listings_history table (triggers on properties + properties_extension) + one-shot
backfill from property_details.listing_events for pre-trigger history.
Tax reassessment forecast MD · Partial reset (capped growth)
- Current annual tax
- $3,848 · $321/mo
- Projected year-2 tax
- $3,848 · $321/mo
- Expected delta
- $0/yr ($0/mo · 0.0%)
ⓘ Screening estimate from a state-policy table — verify with the county assessor before closing.
Climate risk First Street
- Flood 6/10 Major FEMA zone X (unshaded) · 75% chance over 30 yrs
- Wildfire 1/10 Low
- Heat 7/10 Severe 7 d/yr ≥104°F today · 15 d/yr by 30 yrs out
- Wind 6/10 Major 27% chance of damaging wind over 30 yrs
- Air quality 4/10 Moderate 5 unhealthy d/yr today · 7 by 30 yrs out
Nearby sold comps map
Loading sold comps map…
Walkable amenities ~0.75 mi
Loading nearby amenities…
Taxation est. · year 1
- Rental income
- $28,532
- − Mortgage interest
- −$17,645
- − Property taxes
- −$3,848
- − Insurance
- −$1,575
- − Repairs & maintenance
- −$2,283
- − Management
- −$2,283
- − Depreciation
- −$9,164
- Taxable loss
- −$8,265
- Est. tax savings @ 24.0%
- +$1,984
- After-tax cash flow
- $-722/yr
For passive investors: Depreciation is non-cash, so a rental often shows a tax loss while cash-flowing — sheltering income. Rental losses are passive: they offset passive income freely, and up to $25,000/yr can offset ordinary (W-2) income if you actively participate and your MAGI is under $100k (phasing out to $0 by $150k); unused losses carry forward. On sale, claimed depreciation is recaptured at up to 25%, and gains may owe capital-gains tax (a 1031 exchange can defer both). Figures are a year-1 estimate at your 24.0% rate — not tax advice; consult a CPA.
Schools (NCES district)
- District
- Baltimore County Public Schools
- NCES district ID
- 2400120
- Math proficiency
- 15% ▼ -16.00%
- Reading proficiency
- 34% ▼ -5.00%
- Median HH income
- $66,746
- Composite
- 23.17/100
- National rank
- #7948
- State rank
- #11 of 24 in MD
Livability — Parkville
- Score
- 77/100
- State rank
- #77
- US rank
- #2839
Category grades
Schools grade is shown separately in the Schools card above.
Census & demographics
- Census place
- Parkville, MD
- County
- Baltimore County · 769,527 people
- City population
- 66,334
- Metro
- Baltimore-Columbia-Towson, MD
- Population (ZIP)
- 66,334
- Household income
- $83,517
- Rent vs Own
- Severe rent burden
- 2719.0
Population outlook (Baltimore County) Hauer SSP2
- Today (2025)
- 885,518 people
- By 2030
- 909,272 · +2.7%
- By 2040
- 951,547 · +7.5%
- By 2050
- 990,955 · +11.9%
- By 2075
- 1,086,411 · +22.7%
- By 2100
- 1,135,078 · +28.2%
Race, ethnicity, and origin ACS 2023
- Neighborhood character
- Diverse neighborhood (Simpson 0.58)
- Race & ethnicity
- White 58% Black 28% Asian 5% Hispanic / Latino 5% Two or more races 5%
- Common ancestry
- Romanian 5% Lithuanian 1% Italian 1%
- Foreign-born
- 10% · Canada, China, South Korea
- Languages at home
- 89% English-only · Spanish 3% Other Indo-European 2% Tagalog/Filipino 1%
Political lean MEDSL · Baltimore
- 2024 margin
- Strong D (+24.5) · D 61.0% · R 36.5% · Other 2.5%
- 2008→2024 swing
- +9.9pp toward D · 2008: 14.6pp · 2024: 24.5pp
- All cycles
- 2024: D+24.5 2020: D+27.0 2016: D+17.4 2012: D+16.4 2008: D+14.6
Not yet ingested
- Civics
- —
Market trends
- HPI YoY
- ▼ -247.04%
- Current HPI
- 254.3824
- Rent YoY
- ▲ 6.68%
- Metro
- Baltimore-Columbia-Towson, MD
- State GDP YoY
- ▲ 2.97%
- F500 in state
- 12
Industry mix (Fortune 500 HQ in MD)
| Industry | F500 HQs | Revenue |
|---|---|---|
| Aerospace / Defense | 1 | $71B |
|
||
| Utilities | 1 | $25B |
|
||
| Hotels | 1 | $24B |
|
||
| Consumer Goods | 1 | $7B |
|
||
| Real Estate | 1 | $6B |
|
||
| Chemicals | 1 | $2B |
|
||
Price history
+0.6% since first listed4 events — show timeline
- 2026-06-10 Sold (MLS) $317,000 BRIGHT MLS
- 2026-05-10 Pending — BRIGHT MLS
- 2026-05-08 Listing Removed — BRIGHT MLS
- 2026-05-03 Listed $315,000 BRIGHT MLS
Property tax history
+4.3%/yrLatest (2025): $3,848 · +37.4% YoY. Source: county tax records.
Cash-flow waterfall
monthlySold comps — $/sqft
last 12 mo · ≤1 miLoading sold comps…