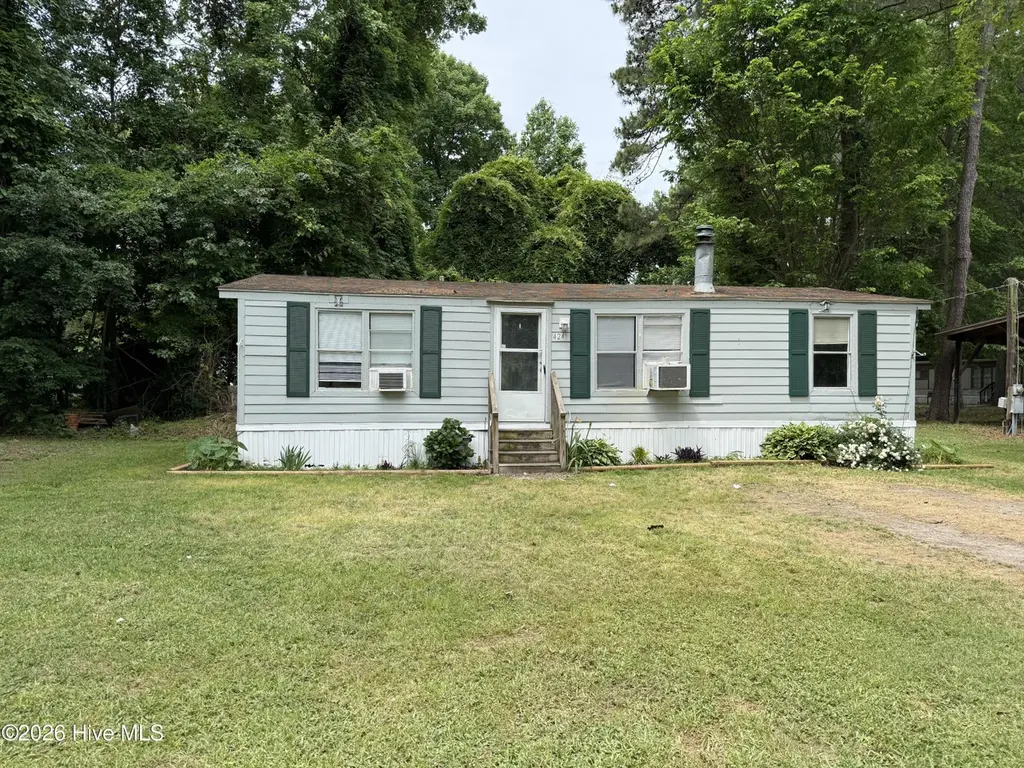
424 White Oak Dr · Cape Colony, NC
Flood risk 5/10 · Moderate
- FEMA flood zone
- X (unshaded)
- Chance of flooding over 30 yrs
- 0.65%
- Est. flood insurance / yr
- $507 – $1,088
Fire risk 3/10 · Minor
- Est. fire insurance / yr
- $906 – $1,684
Heat risk 9/10 · Severe
- Hot days now (above 107°F)
- 7 days/yr
- Hot days in 30 yrs
- 17 days/yr
Wind risk 8/10 · Major
- Chance of severe wind over 30 yrs
- 99.0%
Air-quality risk 1/10 · Minimal
- Unhealthy air days now
- 0 days/yr
- Unhealthy air days in 30 yrs
- 0 days/yr
Risk factors via First Street. Map © Google.
Why this score? — see what drove the C grade
The composite is a weighted blend of 9 inputs, each scored 0–100. Each bar is that input's sub-score; the figure is the points it added to the 100-point composite (weight × sub-score).
- Cash flow +29.4/30.0
- DSCR +10.0/10.0
- 1% rule +7.1/10.0
- Schools +3.3/10.0
- Rent growth +2.5/5.0
- Livability +2.5/5.0
- Condition / age +2.5/5.0
- ARV discount +0.0/15.0
- Appreciation +0.0/10.0
$89,000
🖨 Deal sheet 📄 Offer letter ✓ Due diligence
Listing remarks
This home comes w deeded access to a sandy beach on the Albemarle Sound plus neighborhood boat ramp. Enjoy three bedrooms, two baths, living room open to the kitchen/dining area, separate laundry room and a spacious yard. Located in Edenton's Cape Colony subdivision. Motivated seller!
Key facts
- Spacious yard
- 0.36 acre lot
- Built 1985
Tags
Property features AI
Finance
- Other: Zoning: R15; Subdivision: Cape Colony
- HOA & community: Homeowners association with annual fee of $20; Association includes beach access
Exterior
- Parking: Off-street parking
- Utilities: Public water; Water connected; Septic tank sewer
- Home design: Manufactured home; Single-story (one level); Entry level: 1; Has a view
- Construction: Frame construction; Shingle roof; Crawl space foundation; Built with details noted in remarks
- Exterior features: Beach access and waterfront access; No fencing; Paved road access; Road frontage on city street and state road
Interior
- Kitchen: Refrigerator; Range
- Bedrooms: Total of 6 rooms (bedroom count not separately specified)
- Bathrooms: 2 full bathrooms
- Heating & cooling: Has heating (type: Other); Wall/window air conditioning units
- Interior features: Built-in bookcases; Ceiling fan(s)
- Laundry & utility: Washer hookup; Dedicated laundry room; Electric water heater
Neighborhood map
What this means for you Summary
Snapshot
- This is a 3-bed/1.0-bath manufactured listed at $89k.
Deal economics
- At list price, monthly cash flow is $315 ($4k/yr) — positive.
- The deal already cash-flows at list — no discount required.
- Meets the 1% rule at list price ($1k rent vs $89k).
- Recommended offer: $86k (3.0% below list) — sets the bar for market timing.
Location & tenants
- Location reads: area grade C — affects rentability + tenant quality, not the cash-flow math above.
- Edenton-Chowan Schools (rural): math 37% / reading 42% proficiency, ranked #118 of 178 in NC (top 66%) — families likely to look elsewhere, expect single-tenant / working-renter base with shorter leases.
- Zoned schools: Chowan Middle (math 29% / reading 42%, grade F, #279 of 475 statewide, top 60%, 428 students, 68% FRL); John A Holmes High (math 57% / reading 47%, grade D+, #292 of 535 statewide, top 56%, 592 students, 57% FRL).
- Market conditions: 236 active listings in the ZIP; 48 units permitted in Chowan County in 2024 (0 in 5+ unit buildings).
Forward outlook
- Local home prices are declining (-3.0%/yr); year-one equity from $615 of loan paydown is wiped out by about $3k of value loss. Plan a longer hold.
- Chowan County population projected at -20% by 2050 — secular population decline; favor cash flow + early exit over multi-decade hold.
- At projected returns (-3.0% appreciation + 3.0% rent growth), your $25k cash investment doubles in ~8 years — after that, you're playing with house money.
Negotiation context
- It's been on market 43 days — a 3% lower offer ($86k) is reasonable based on typical stale-listing flexibility.
- Current owner paid $7k; list at $89k implies a 1171% gain — meaningful room to come down on a strong offer.
Risks & watch-outs
- Climate carrying-cost: moderate flood risk; severe wind risk, 99% chance of damaging wind over 30y; extreme-heat days projected 7→17/yr by 2055 (HVAC capex compounding) — expect insurance premiums to compound above CPI over the hold.
Questions for the listing agent
- It's been on market 43 days. Have you received any prior offers? Is the seller open to a 3% concession, seller financing, or rate buy-down credit?
- What does the HOA fee cover, when was the last increase, and are there any pending special assessments or reserve-fund shortfalls?
- Is there a deadline driving the sale (1031 exchange, divorce, estate, relocation)? That informs how much negotiation room exists.
- What's the average days-on-market for RENTAL listings here right now (not sales)? A rising rental-DOM trend means longer vacancies and softer asking-rent achievability than the comps imply.
- What's the recent tenant-quality profile in this submarket — average credit score on applications, eviction rate, late-payment / NSF rate, and stable-employment percentage? A property-management company in the area should have these aggregated.
- How much new for-sale + rental construction is in the pipeline within 1–3 miles? Heavy new supply typically softens prices + rents 12–24 months out; constrained supply supports both.
Investment metrics
- 1% rule
- 1.21% ✓
- Cap rate
- 10.54%
- Cash-on-cash
- 15.16%
- DSCR
- 1.67
- GRM
- 6.9
CMA / ARV
- ARV (on-the-fly)
- $64,400
- Comps found
- 1
Show comp detail 1 sale within ~0.75 mi
| Address | Dist | Beds/Ba | Sqft | Sold | Price | $/sf | Match |
|---|---|---|---|---|---|---|---|
| 106 Holly Dr | 0.32mi | 2/1.5 (-1) | 924 (+0%) | 19mo | $65,000 | $70 | 62 |
Match score weights: distance 35% · size 25% · config 20% · recency 20%. Top-matched comps best support the ARV.
Projected returns pro-forma
-3.0% appreciation · 3.0% rent growth · sell at horizon
- IRR
- 5.8%
- Equity multiple
- 1.22×
- Total profit
- $5,601
- Equity at exit
- $13,270
- IRR
- 15.2%
- Equity multiple
- 2.23×
- Total profit
- $30,563
- Equity at exit
- $7,695
Cash invested: $24,920 (down + closing). Projections, not guarantees.
Landlord ↔ Tenant lean methodology
- Overall (STATE)
- 85 Strongly Landlord-Friendly
- State North Carolina
- 85 Strongly Landlord-Friendly · R+3
- County
- — inherits STATE
- City
- — inherits STATE
ZIP-level market 27932
- Home prices YoY
- -32.1%
- Active inventory
- 236
- Price-to-rent
- 6.9×
Monthly cashflow live
- Estimated rent
- $1,073 medium interval (Pro) →
- Mortgage (P&I)
- −$467
- Tax from tax record
- −$27 /mo · $320/yr
- Insurance
- −$37
- HOA
- −$2
- Vacancy / Maint / Mgmt
- −$225
- Net cashflow
- $315
Break-even live
UW: 25.0% down · 7.5% · 30yr · 1.5% tax · 5.0% vac · 8.0% maint · 8.0% mgmt
Financing live
Cash to close
- Down payment
- $22,250
- Closing costs
- $2,670
- Reserves months
- —
- Total cash needed
- —
Loan-product check · same deal, 3 products live
Conventional
25% down · 7.5% · 30yr
- Down + closing
- —
- Monthly P&I
- —
- Monthly cashflow
- —
- DSCR
- —
- Eligible?
- —
Personal DTI + credit; lowest rate.
DSCR
20% down · 8.5% · 30yr
- Down + closing
- —
- Monthly P&I
- —
- Monthly cashflow
- —
- DSCR
- —
- Eligible?
- —
No personal income docs; deal must DSCR.
Hard money
10% down · 12.0% · 12mo
- Down + closing
- —
- Monthly P&I
- —
- Monthly cashflow
- —
- DSCR
- —
- Eligible?
- —
Short-term bridge; refi at stabilization.
HOA detail
- Monthly dues
- $2 · $24/yr
Listing history 16 events
-
2026-06-18days on market $89,000 Active 43 DOM
-
2026-06-17days on market $89,000 Active 42 DOM
-
2026-06-16days on market $89,000 Active 41 DOM
-
2026-06-15days on market $89,000 Active 40 DOM
-
2026-06-13days on market $89,000 Active 38 DOM
-
2026-06-12days on market $89,000 Active 37 DOM
-
2026-06-09days on market $89,000 Active 34 DOM
-
2026-06-08days on market $89,000 Active 33 DOM
-
2026-06-07days on market $89,000 Active 32 DOM
-
2026-06-07days on market $89,000 Active 31 DOM
-
2026-06-04days on market $89,000 Active 28 DOM
-
2026-06-02days on market $89,000 Active 27 DOM
-
2026-06-01days on market $89,000 Active 26 DOM
-
2026-05-31days on market $89,000 Active 25 DOM
-
2026-05-04$89,000 Active
-
2000-01-20soldstatus $7,000
ⓘ Source: listings_history table (triggers on properties + properties_extension) + one-shot
backfill from property_details.listing_events for pre-trigger history.
Tax reassessment forecast NC · Resets to sale price
- Current annual tax
- $320 · $27/mo
- Projected year-2 tax
- $730 · $61/mo
- Expected delta
- +$410/yr (+$34/mo · 128.4%)
ⓘ Screening estimate from a state-policy table — verify with the county assessor before closing.
Climate risk First Street
- Flood 5/10 Major FEMA zone X (unshaded) · 65% chance over 30 yrs
- Wildfire 3/10 Moderate
- Heat 9/10 Extreme 7 d/yr ≥107°F today · 17 d/yr by 30 yrs out
- Wind 8/10 Severe 99% chance of damaging wind over 30 yrs
- Air quality 1/10 Low 0 unhealthy d/yr today · 0 by 30 yrs out
Nearby sold comps map
Loading sold comps map…
Walkable amenities ~0.75 mi
Loading nearby amenities…
Taxation est. · year 1
- Rental income
- $12,871
- − Mortgage interest
- −$4,985
- − Property taxes
- −$320
- − Insurance
- −$445
- − Repairs & maintenance
- −$1,030
- − Management
- −$1,030
- − HOA
- −$24
- − Depreciation
- −$2,589
- Taxable income
- $2,449
- Est. tax owed @ 24.0%
- −$588
- After-tax cash flow
- $3,191/yr
For passive investors: Depreciation is non-cash, so a rental often shows a tax loss while cash-flowing — sheltering income. Rental losses are passive: they offset passive income freely, and up to $25,000/yr can offset ordinary (W-2) income if you actively participate and your MAGI is under $100k (phasing out to $0 by $150k); unused losses carry forward. On sale, claimed depreciation is recaptured at up to 25%, and gains may owe capital-gains tax (a 1031 exchange can defer both). Figures are a year-1 estimate at your 24.0% rate — not tax advice; consult a CPA.
Schools (NCES district)
- District
- Edenton-Chowan Schools
- NCES district ID
- 3700840
- Math proficiency
- 37% ▼ -2.00%
- Reading proficiency
- 42% ▲ 3.00%
- Median HH income
- $38,516
- Composite
- 32.97/100
- National rank
- #5586
- State rank
- #118 of 178 in NC
Livability — Cape Colony
No livability data for this city. (Only ~50 U.S. cities are tracked.)
Census & demographics
- Census place
- Cape Colony, NC
- Population (ZIP)
- 12,784
Population outlook (Chowan County) Hauer SSP2
- Today (2025)
- 13,627 people
- By 2030
- 13,099 · -3.9%
- By 2040
- 11,899 · -12.7%
- By 2050
- 10,858 · -20.3%
- By 2075
- 9,010 · -33.9%
- By 2100
- 7,463 · -45.2%
Race, ethnicity, and origin ACS 2023
- Neighborhood character
- Majority White (59%)
- Race & ethnicity
- White 59% Black 34% Hispanic / Latino 4% Two or more races 4%
- Common ancestry
- Italian 2% Romanian 1% Serbian 1%
- Foreign-born
- 2% · Canada
- Languages at home
- 96% English-only · Spanish 3% Other Indo-European 1%
Political lean MEDSL · Chowan
- 2024 margin
- Strong R (+22.5) · D 38.4% · R 60.9%
- 2008→2024 swing
- -21.3pp toward R · 2008: -1.1pp · 2024: -22.5pp
- All cycles
- 2024: R+22.5 2020: R+15.7 2016: R+14.3 2012: R+4.9 2008: R+1.1
Not yet ingested
- Civics
- —
Market trends
- HPI YoY
- ▼ -81.59%
- Current HPI
- 172.7448
- Rent YoY
- —
- Metro
- —
- State GDP YoY
- ▲ 3.28%
- F500 in state
- 26
Industry mix (Fortune 500 HQ in NC)
| Industry | F500 HQs | Revenue |
|---|---|---|
| Financial Services | 2 | $213B |
|
||
| Retail | 2 | $95B |
|
||
| Industrial Conglomerate | 1 | $38B |
|
||
| Metals / Steel | 1 | $35B |
|
||
| Utilities | 1 | $30B |
|
||
| Industrial Machinery | 1 | $19B |
|
||
Price history
+1171.4% since first listed2 events — show timeline
- 2026-05-04 Listed $89,000 Hive MLS
- 2000-01-20 Sold (Public Records) $7,000 Public Records
Property tax history
+3.0%/yrLatest (2025): $320 · +0.0% YoY. Source: county tax records.
Cash-flow waterfall
monthlySold comps — $/sqft
last 12 mo · ≤1 miLoading sold comps…