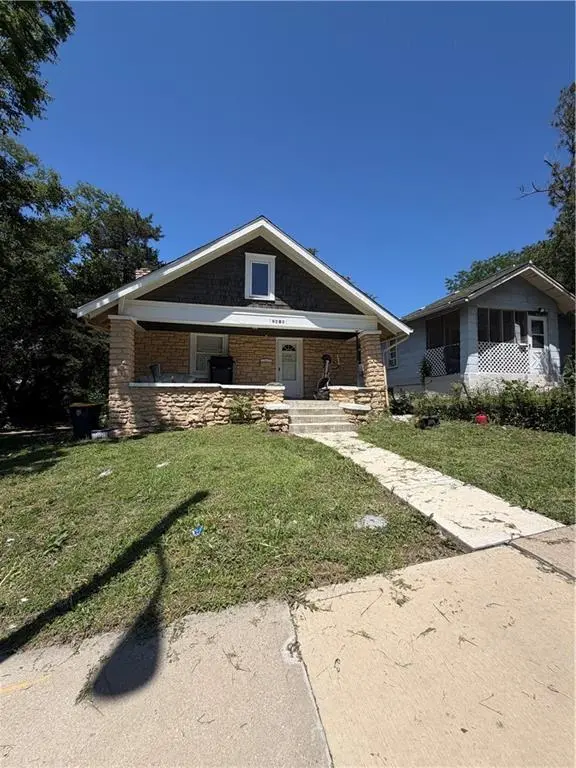
3416 E 58th Ter · Kansas City, MO
Flood risk 1/10 · Minimal
- FEMA flood zone
- X (unshaded)
- Chance of flooding over 30 yrs
- 0.0%
- Est. flood insurance / yr
- $473 – $860
Fire risk 1/10 · Minimal
- Est. fire insurance / yr
- $1,054 – $1,958
Heat risk 4/10 · Minor
- Hot days now (above 106°F)
- 7 days/yr
- Hot days in 30 yrs
- 17 days/yr
Wind risk 2/10 · Minimal
- Chance of severe wind over 30 yrs
- —
Air-quality risk 3/10 · Minor
- Unhealthy air days now
- 3 days/yr
- Unhealthy air days in 30 yrs
- 5 days/yr
Risk factors via First Street. Map © Google.
Why this score? — see what drove the A grade
The composite is a weighted blend of 9 inputs, each scored 0–100. Each bar is that input's sub-score; the figure is the points it added to the 100-point composite (weight × sub-score).
- Cash flow +30.0/30.0
- ARV discount +15.0/15.0
- DSCR +10.0/10.0
- Appreciation +10.0/10.0
- 1% rule +8.9/10.0
- Livability +3.9/5.0
- Rent growth +3.2/5.0
- Condition / age +2.5/5.0
- Schools +1.5/10.0
$110,000
🖨 Deal sheet 📄 Offer letter ✓ Due diligence
Listing remarks MLS
GREAT ADDITION TO YOUR RENTAL PORTFOLIO. WAS PREVIOUSLY RENTED AS IS FOR OVER $500.00 MONTHLY IN AS-IS CONDITION. WITH A LITTLE PAINT AND LOVE, THIS A GREAT RENTAL OR FLIP OPPORTUNITY. 3 BED 1 BATH HOME WITH ORIGINAL HARDWOOD FLOORS. With the average rental rate in the area at 1,320, this is a steal with the return rate value. Don't let this cash investment opportunity pass you by.
Key facts
- Off street parking
- Large backyard
- 8,810 sq ft lot
Tags
Property features AI
Finance
- Other: Lot on paved, publicly maintained road
- HOA & community: No association fees
Exterior
- Parking: Other parking
- Utilities: Public water; Public sewer
- Home design: Single-family residence; 1.5-story layout; Residential property
- Construction: Stone and frame construction; Composition roof
- Exterior features: Front porch
Interior
- Kitchen: Refrigerator; Electric range
- Bedrooms: 3 bedrooms, all on the main level; Primary bedroom features carpet and ceiling fan; Second bedroom with wood floor; Third bedroom with wood floor
- Flooring: Carpet and wood flooring
- Bathrooms: 1 full bathroom
- Heating & cooling: Forced air heating; Electric cooling with window unit(s)
- Interior features: Formal dining area; Ceiling fans; Fireplace in living room; Full basement
- Laundry & utility: Laundry located in the basement
Neighborhood map
What this means for you Summary
Snapshot
- This is a 4-bed/1.0-bath single-family listed at $110k.
Deal economics
- At list price, monthly cash flow is $527 ($6k/yr) — positive.
- The deal already cash-flows at list — no discount required.
- Meets the 1% rule at list price ($2k rent vs $110k).
- Recommended offer: $108k (1.5% below list) — sets the bar for market timing.
- Cap rate 12.0% vs local median 3.9% in Kansas City — top-decile yield for the area; either an underpriced asset or a hidden risk that comps aren't pricing in. Stress-test before assuming the spread holds.
Location & tenants
- Location reads 78/100 on livability (#28 in MO, #2,671 nationally) — a middle-class / working-renter tenant base. Strengths: amenities A+, commute A+, cost of living A+; Watch: schools C-, crime F.
- Kansas City 33 (urban): math 12% / reading 24% proficiency, ranked #308 of 324 in MO (top 95%) — low school quality limits family demand, transient renter base, plan for 1-2y turnover; 75% free/reduced lunch — lower-income household profile, screen leases tightly.
- Market conditions: Rents rising (+3.0%/yr); 93 active listings in the ZIP; 30 comparable units currently listed for rent nearby; rentals at typical pace (median 24d on market — plan ~3-4 weeks tenant-placement turnaround); 4,002 units permitted in Jackson County in 2024 (2,271 in 5+ unit buildings).
- This rent runs 40% of the median local income ($46k/yr) — at the standard rent-burdened threshold; future hikes will face affordability resistance.
Forward outlook
- In year one you build about $12k of equity ($761 loan paydown + $11k appreciation (10.0% local appreciation)).
- Jackson County population projected at +4% by 2050 — modest demand growth; plan on rents tracking national, not racing it.
- At projected returns (10.0% appreciation + 3.0% rent growth), your $31k cash investment doubles in ~2 years — after that, you're playing with house money.
- By year 4, paydown + projected appreciation supports a ~$42k cash-out refi (75% LTV) — recoverable capital for the next deal without selling this one.
Negotiation context
- It's been on market 22 days — a 2% lower offer ($108k) is reasonable based on typical stale-listing flexibility.
- 5 sale attempts since 20y ago; this cycle's ask has dropped $15k (12%) from the opening price — seller is motivated, your offer sets the floor, not the list.
Risks & watch-outs
- Watch-outs: built in 1915 — expect roof / HVAC / electrical / plumbing capex.
Questions for the listing agent
- Built in 1915 — when were the roof, HVAC, electrical panel, plumbing, and water heater last replaced?
- Is there a deadline driving the sale (1031 exchange, divorce, estate, relocation)? That informs how much negotiation room exists.
- Crime grade is F in this area — have there been break-ins, vandalism, or insurance claims at this property in the last 3 years? What carrier currently insures it and at what premium?
- What's the average days-on-market for RENTAL listings here right now (not sales)? A rising rental-DOM trend means longer vacancies and softer asking-rent achievability than the comps imply.
- What's the recent tenant-quality profile in this submarket — average credit score on applications, eviction rate, late-payment / NSF rate, and stable-employment percentage? A property-management company in the area should have these aggregated.
- How much new for-sale + rental construction is in the pipeline within 1–3 miles? Heavy new supply typically softens prices + rents 12–24 months out; constrained supply supports both.
Investment metrics
- 1% rule
- 1.39% ✓
- Cap rate
- 12.04%
- Cash-on-cash
- 20.54%
- DSCR
- 1.91
- GRM
- 6.0
CMA / ARV
- ARV (on-the-fly)
- $142,504
- Comps found
- 12
Show comp detail 12 sales within ~0.75 mi
| Address | Dist | Beds/Ba | Sqft | Sold | Price | $/sf | Match |
|---|---|---|---|---|---|---|---|
| 5800 Askew Ave | 0.09mi | 4/2.0 | 1,584 (+4%) | 6mo | $85,000 | $54 | 79 |
| 3511 E 58th Ter | 0.06mi | 3/2.0 (-1) | 1,588 (+5%) | 7mo | $150,000 | $94 | 75 |
| 5945 Jackson Ave | 0.51mi | 3/1.5 (-1) | 1,500 (-1%) | 10mo | $89,000 | $59 | 59 |
| 5732 Askew Ave | 0.09mi | 3/2.0 (-1) | 1,336 (-12%) | 13mo | $159,999 | $120 | 56 |
| 3928 E 58 St | 0.33mi | 3/1.0 (-1) | 1,656 (+9%) | 10mo | $135,000 | $82 | 56 |
| 5707 College Ave | 0.17mi | 3/2.5 (-1) | 1,355 (-11%) | 10mo | $199,900 | $148 | 55 |
| 6139 S Benton Ave | 0.53mi | 4/2.0 | 1,379 (-9%) | 4mo | $75,000 | $54 | 53 |
| 4319 E 56 St | 0.62mi | 4/1.5 | 1,368 (-10%) | 1mo | $175,000 | $128 | 52 |
| 4225 E 60th Ter | 0.60mi | 3/2.0 (-1) | 1,410 (-7%) | 8mo | $175,000 | $124 | 45 |
| 5547 Olive St | 0.70mi | 3/1.0 (-1) | 1,402 (-8%) | 7mo | $84,900 | $61 | 44 |
| 4001 E 55th St | 0.54mi | 4/2.0 | 1,704 (+12%) | 12mo | $175,000 | $103 | 41 |
| 4401 E 56th Ter | 0.64mi | 3/2.0 (-1) | 1,600 (+6%) | 14mo | $150,000 | $94 | 40 |
Match score weights: distance 35% · size 25% · config 20% · recency 20%. Top-matched comps best support the ARV.
Projected returns pro-forma
10.0% appreciation · 2.98% rent growth · sell at horizon
- IRR
- 39.6%
- Equity multiple
- 4.03×
- Total profit
- $93,430
- Equity at exit
- $99,097
- IRR
- 34.1%
- Equity multiple
- 9.07×
- Total profit
- $248,614
- Equity at exit
- $213,706
Cash invested: $30,800 (down + closing). Projections, not guarantees.
Landlord ↔ Tenant lean methodology
- Overall (STATE)
- 81 Strongly Landlord-Friendly
- State Missouri
- 81 Strongly Landlord-Friendly · R+10
- County
- — inherits STATE
- City
- — inherits STATE
ZIP-level market 64132
- Home prices YoY
- 23.6%
- Rents YoY
- 3.0%
- Active inventory
- 93
- Price-to-rent
- 6.0×
Monthly cashflow live
- Estimated rent
- $1,527 high interval (Pro) →
- Mortgage (P&I)
- −$577
- Tax from tax record
- −$56 /mo · $674/yr
- Insurance
- −$46
- HOA
- −$0
- Vacancy / Maint / Mgmt
- −$321
- Net cashflow
- $527
Break-even live
UW: 25.0% down · 7.5% · 30yr · 1.5% tax · 5.0% vac · 8.0% maint · 8.0% mgmt
Financing live
Cash to close
- Down payment
- $27,500
- Closing costs
- $3,300
- Reserves months
- —
- Total cash needed
- —
Loan-product check · same deal, 3 products live
Conventional
25% down · 7.5% · 30yr
- Down + closing
- —
- Monthly P&I
- —
- Monthly cashflow
- —
- DSCR
- —
- Eligible?
- —
Personal DTI + credit; lowest rate.
DSCR
20% down · 8.5% · 30yr
- Down + closing
- —
- Monthly P&I
- —
- Monthly cashflow
- —
- DSCR
- —
- Eligible?
- —
No personal income docs; deal must DSCR.
Hard money
10% down · 12.0% · 12mo
- Down + closing
- —
- Monthly P&I
- —
- Monthly cashflow
- —
- DSCR
- —
- Eligible?
- —
Short-term bridge; refi at stabilization.
Rent comps 30 comps
| Address | Beds | Baths | Sqft | Rent | $/sqft | DOM | Units | Dist |
|---|---|---|---|---|---|---|---|---|
| 5752 College Ave Kansas City, MO | 4.0 | 1.0 | 1120 | $1,600 | $1.43 | 16d | 1 | 0.11mi |
| 5650 Askew Ave Kansas City, MO | 4.0 | 2.0 | 1200 | $1,341 | $1.12 | 23d | 1 | 0.18mi |
| 3821 E 58th St Kansas City, MO | 3.0 | 1.5 | 1153 | $1,350 | $1.17 | 16d | 1 | 0.29mi |
| 2811 E 58th St Kansas City, MO | 4.0 | 1.0 | 1348 | $1,473 | $1.09 | 43d | 1 | 0.37mi |
| 3861 E 60th St Kansas City, MO | 3.0 | 2.0 | 1491 | $1,250 | $0.84 | 2d | 1 | 0.44mi |
| 5801 Wabash Ave Kansas City, MO | 3.0 | 1.0 | 1200 | $1,200 | $1.00 | 43d | 1 | 0.57mi |
| 5824 Wabash Ave Kansas City, MO | 3.0 | 1.0 | 1276 | $1,050 | $0.82 | 43d | 1 | 0.59mi |
| 6328 College Ave Kansas City, MO | 3.0 | 1.5 | 1856 | $1,399 | $0.75 | 3d | 1 | 0.63mi |
| 4212 E 55th St Kansas City, MO | 4.0 | 2.0 | 1132 | $1,800 | $1.59 | 43d | 1 | 0.69mi |
| 5215 Walrond Ave Kansas City, MO | 4.0 | 2.0 | 1198 | $1,710 | $1.43 | 23d | 1 | 0.77mi |
| 6431 S Benton Ave Kansas City, MO | 3.0 | 1.0 | 1160 | $1,225 | $1.06 | 23d | 1 | 0.81mi |
| 5712 Garfield Ave Kansas City, MO | 4.0 | 2.0 | 2200 | $1,900 | $0.86 | 16d | 1 | 0.85mi |
| 5708 Euclid Ave Kansas City, MO | 4.0 | 2.0 | 1350 | $1,600 | $1.19 | 16d | 1 | 0.92mi |
| 5414 Brooklyn Ave Kansas City, MO | 3.0 | 1.5 | 1856 | $1,650 | $0.89 | 16d | 1 | 0.94mi |
| 5531 Euclid Ave Kansas City, MO | 3.0 | 1.0 | 1135 | $1,300 | $1.15 | 43d | 1 | 0.94mi |
| 5344 Brooklyn Ave Kansas City, MO | 3.0 | 1.0 | 2040 | $1,495 | $0.73 | 7d | 1 | 0.97mi |
| 5038 S Benton Ave Kansas City, MO | 4.0 | 3.0 | 1500 | $1,875 | $1.25 | 21d | 1 | 1.02mi |
| 5410 Euclid Ave Kansas City, MO | 3.0 | 2.0 | 1119 | $1,395 | $1.25 | 43d | 1 | 1.04mi |
| 5430 Michigan Ave Kansas City, MO | 3.0 | 1.0 | 1710 | $1,100 | $0.64 | 19d | 1 | 1.08mi |
| 5524 Woodland Ave Kansas City, MO | 3.0 | 1.0 | 1243 | $1,095 | $0.88 | 23d | 1 | 1.09mi |
| 4935 College Ave Kansas City, MO | 3.0 | 1.0 | 1216 | $1,350 | $1.11 | 23d | 1 | 1.09mi |
| 2420 E 51st St Kansas City, MO | 3.0 | 2.0 | 1460 | $1,350 | $0.92 | 23d | 1 | 1.11mi |
| 5241 Brookwood Ave Kansas City, MO | 3.0 | 2.0 | 1431 | $1,550 | $1.08 | 43d | 1 | 1.17mi |
| 5114 Brooklyn Ave Kansas City, MO | 3.0 | 1.5 | 1116 | $1,300 | $1.16 | 7d | 1 | 1.18mi |
| 6812 College Ave Kansas City, MO | 4.0 | 2.0 | 1152 | $1,795 | $1.56 | 23d | 1 | 1.21mi |
| 6821 Bales Ave Kansas City, MO | 3.0 | 1.5 | 1430 | $1,595 | $1.12 | 19d | 1 | 1.23mi |
| 2237 E 67th St Kansas City, MO | 4.0 | 1.0 | 1300 | $1,500 | $1.15 | 16d | 1 | 1.25mi |
| 5115 Woodland Ave Kansas City, MO | 4.0 | 1.0 | 1136 | $1,700 | $1.50 | 43d | 1 | 1.34mi |
| 4653 Benton Blvd Kansas City, MO | 3.0 | 2.0 | 1594 | $1,600 | $1.00 | 7d | 1 | 1.47mi |
| 5618 Forest Ave Kansas City, MO | 3.0 | 1.0 | 1198 | $1,275 | $1.06 | 16d | 1 | 1.49mi |
Listing history 32 events
-
2026-06-18price $110,000 Active 22 DOM
-
2026-06-18days on market $125,000 Active 22 DOM
-
2026-06-17days on market $125,000 Active 21 DOM
-
2026-06-16days on market $125,000 Active 20 DOM
-
2026-06-15days on market $125,000 Active 19 DOM
-
2026-06-13days on market $125,000 Active 17 DOM
-
2026-06-09days on market $125,000 Active 13 DOM
-
2026-06-08days on market $125,000 Active 12 DOM
-
2026-06-07days on market $125,000 Active 11 DOM
-
2026-06-05days on market $125,000 Active 8 DOM
-
2026-06-03days on market $125,000 Active 7 DOM
-
2026-06-02days on market $125,000 Active 6 DOM
-
2026-06-01days on market $125,000 Active 5 DOM
-
2026-05-31days on market $125,000 Active 4 DOM
-
2026-05-27$125,000 Active
-
2023-08-30soldstatus
-
2023-08-28soldstatus Closed 384-char remark
Show marketing remark (384 chars)
GREAT ADDITION TO YOUR RENTAL PORTFOLIO. WAS PREVIOUSLY RENTED AS IS FOR OVER $500.00 MONTHLY IN AS-IS CONDITION. WITH A LITTLE PAINT AND LOVE, THIS A GREAT RENTAL OR FLIP OPPORTUNITY. 3 BED 1 BATH HOME WITH ORIGINAL HARDWOOD FLOORS. With the average rental rate in the area at 1,320, this is a steal with the return rate value. Don't let this cash investment opportunity pass you by.
-
2023-08-15status Pending 384-char remark
Show marketing remark (384 chars)
GREAT ADDITION TO YOUR RENTAL PORTFOLIO. WAS PREVIOUSLY RENTED AS IS FOR OVER $500.00 MONTHLY IN AS-IS CONDITION. WITH A LITTLE PAINT AND LOVE, THIS A GREAT RENTAL OR FLIP OPPORTUNITY. 3 BED 1 BATH HOME WITH ORIGINAL HARDWOOD FLOORS. With the average rental rate in the area at 1,320, this is a steal with the return rate value. Don't let this cash investment opportunity pass you by.
-
2023-08-10$59,900 Active 384-char remark
Show marketing remark (384 chars)
GREAT ADDITION TO YOUR RENTAL PORTFOLIO. WAS PREVIOUSLY RENTED AS IS FOR OVER $500.00 MONTHLY IN AS-IS CONDITION. WITH A LITTLE PAINT AND LOVE, THIS A GREAT RENTAL OR FLIP OPPORTUNITY. 3 BED 1 BATH HOME WITH ORIGINAL HARDWOOD FLOORS. With the average rental rate in the area at 1,320, this is a steal with the return rate value. Don't let this cash investment opportunity pass you by.
-
2012-01-09soldstatus 237-char remark
Show marketing remark (237 chars)
Great Investment Property. Has already been rehabbed, but still needs cleaned out, but updated kitchen and bath. Still has furnace and hot water tank. Just needs paint and carpet cleaning and will be move in ready. Great rental property.
-
2011-09-12$13,900 237-char remark
Show marketing remark (237 chars)
Great Investment Property. Has already been rehabbed, but still needs cleaned out, but updated kitchen and bath. Still has furnace and hot water tank. Just needs paint and carpet cleaning and will be move in ready. Great rental property.
-
2009-08-28soldstatus
-
2008-11-03soldstatus
-
2008-11-03soldstatus
-
2008-10-22soldstatus $360,000
-
2007-09-04historical
-
2007-08-21$92,000
-
2006-10-23soldstatus
-
2006-02-07$25,000
-
2003-09-03soldstatus
-
2003-02-07soldstatus
-
1984-02-01soldstatus
ⓘ Source: listings_history table (triggers on properties + properties_extension) + one-shot
backfill from property_details.listing_events for pre-trigger history.
Tax reassessment forecast MO · Resets to sale price
- Current annual tax
- $674 · $56/mo
- Projected year-2 tax
- $1,067 · $89/mo
- Expected delta
- +$392/yr (+$33/mo · 58.2%)
ⓘ Screening estimate from a state-policy table — verify with the county assessor before closing.
Climate risk First Street
- Flood 1/10 Low FEMA zone X (unshaded) · 0% chance over 30 yrs
- Wildfire 1/10 Low
- Heat 4/10 Moderate 7 d/yr ≥106°F today · 17 d/yr by 30 yrs out
- Wind 2/10 Low
- Air quality 3/10 Moderate 3 unhealthy d/yr today · 5 by 30 yrs out
Nearby sold comps map
Loading sold comps map…
Walkable amenities ~0.75 mi
Loading nearby amenities…
Taxation est. · year 1
- Rental income
- $18,321
- − Mortgage interest
- −$6,162
- − Property taxes
- −$674
- − Insurance
- −$550
- − Repairs & maintenance
- −$1,466
- − Management
- −$1,466
- − Depreciation
- −$3,200
- Taxable income
- $4,803
- Est. tax owed @ 24.0%
- −$1,153
- After-tax cash flow
- $5,174/yr
For passive investors: Depreciation is non-cash, so a rental often shows a tax loss while cash-flowing — sheltering income. Rental losses are passive: they offset passive income freely, and up to $25,000/yr can offset ordinary (W-2) income if you actively participate and your MAGI is under $100k (phasing out to $0 by $150k); unused losses carry forward. On sale, claimed depreciation is recaptured at up to 25%, and gains may owe capital-gains tax (a 1031 exchange can defer both). Figures are a year-1 estimate at your 24.0% rate — not tax advice; consult a CPA.
Schools (NCES district)
- District
- Kansas City 33
- NCES district ID
- 2916400
- Math proficiency
- 12% ▼ -8.00%
- Reading proficiency
- 24% ▬ 0.00%
- Median HH income
- $35,227
- Composite
- 14.8/100
- National rank
- #9387
- State rank
- #308 of 324 in MO
Livability — Kansas City
- Score
- 78/100
- State rank
- #28
- US rank
- #2671
Category grades
Schools grade is shown separately in the Schools card above.
Census & demographics
- Census place
- Kansas City, MO
- County
- Jackson County · 687,798 people
- City population
- 439,467
- Metro
- Kansas City, MO-KS
- Population (ZIP)
- 12,084
- Household income
- $45,622
- Rent vs Own
- Severe rent burden
- 679.0
Population outlook (Jackson County) Hauer SSP2
- Today (2025)
- 719,589 people
- By 2030
- 731,456 · +1.6%
- By 2040
- 746,689 · +3.8%
- By 2050
- 749,289 · +4.1%
- By 2075
- 736,227 · +2.3%
- By 2100
- 668,210 · -7.1%
Race, ethnicity, and origin ACS 2023
- Neighborhood character
- Predominantly Black (66%)
- Race & ethnicity
- Black 66% White 16% Hispanic / Latino 11% Two or more races 10%
- Hispanic origin (detail)
- Mexican 9%
- Common ancestry
- Italian 2% Scotch-Irish 1% Romanian 1%
- Foreign-born
- 6% · Canada, Jamaica
- Languages at home
- 92% English-only · Spanish 7%
Political lean MEDSL · Jackson
- 2024 margin
- D (+19.3) · D 58.9% · R 39.5% · Other 1.6%
- 2008→2024 swing
- -6.1pp toward R · 2008: 25.4pp · 2024: 19.3pp
- All cycles
- 2024: D+19.3 2020: D+22.0 2016: D+16.6 2012: D+19.0 2008: D+25.4
Not yet ingested
- Civics
- —
Market trends
- HPI YoY
- ▲ 79.13%
- Current HPI
- 414.4305
- Rent YoY
- ▲ 2.98%
- Metro
- Kansas City, MO-KS
- State GDP YoY
- ▲ 1.84%
- F500 in state
- 20
Industry mix (Fortune 500 HQ in MO)
| Industry | F500 HQs | Revenue |
|---|---|---|
| Healthcare | 1 | $163B |
|
||
| Insurance | 1 | $21B |
|
||
| Industrial Technology | 1 | $17B |
|
||
| Retail | 1 | $16B |
|
||
| Industrial Distribution | 1 | $10B |
|
||
| Utilities | 1 | $9B |
|
||
Price history
+400.0% since first listed18 events — show timeline
- 2026-05-27 Listed $125,000 Heartland MLS as Distributed by MLS Grid
- 2023-08-30 Sold (Public Records) — Public Records
- 2023-08-28 Sold (MLS) — Heartland MLS as Distributed by MLS Grid
- 2023-08-15 Pending — Heartland MLS as Distributed by MLS Grid
- 2023-08-10 Listed $59,900 Heartland MLS as Distributed by MLS Grid
- 2012-01-09 Sold (MLS) — Heartland MLS as Distributed by MLS Grid
- 2011-09-12 Listed $13,900 Heartland MLS as Distributed by MLS Grid
- 2009-08-28 Sold (Public Records) — Public Records
- 2008-11-03 Sold (Public Records) — Public Records
- 2008-11-03 Sold (Public Records) — Public Records
- 2008-10-22 Sold (Public Records) $360,000 Public Records
- 2007-09-04 Listing Removed — Heartland MLS as Distributed by MLS Grid
- 2007-08-21 Listed $92,000 Heartland MLS as Distributed by MLS Grid
- 2006-10-23 Sold (MLS) — Heartland MLS as Distributed by MLS Grid
- 2006-02-07 Listed $25,000 Heartland MLS as Distributed by MLS Grid
- 2003-09-03 Sold (Public Records) — Public Records
- 2003-02-07 Sold (Public Records) — Public Records
- 1984-02-01 Sold (Public Records) — Public Records
Property tax history
+7.4%/yrLatest (2025): $674 · -4.3% YoY. Source: county tax records.
Cash-flow waterfall
monthlySold comps — $/sqft
last 12 mo · ≤1 miLoading sold comps…