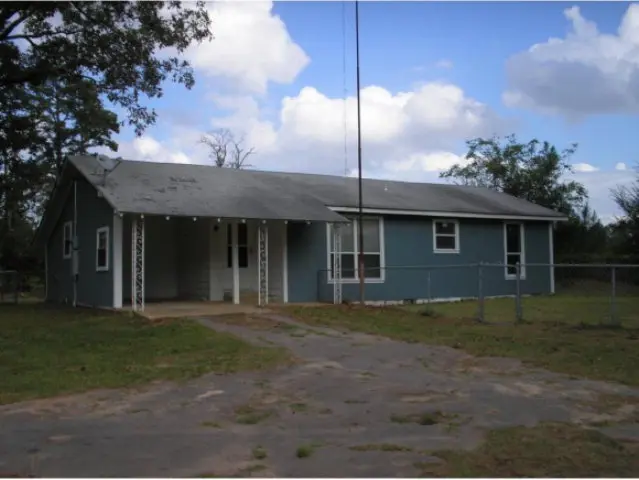
26841 Fm 95 S · Garrison, TX
Flood risk 1/10 · Minimal
- FEMA flood zone
- X (unshaded)
- Chance of flooding over 30 yrs
- 0.0%
- Est. flood insurance / yr
- $507 – $1,088
Fire risk 4/10 · Minor
- Est. fire insurance / yr
- $1,222 – $2,270
Heat risk 7/10 · Major
- Hot days now (above 110°F)
- 7 days/yr
- Hot days in 30 yrs
- 24 days/yr
Wind risk 8/10 · Major
- Chance of severe wind over 30 yrs
- 80.0%
Air-quality risk 1/10 · Minimal
- Unhealthy air days now
- 0 days/yr
- Unhealthy air days in 30 yrs
- 0 days/yr
Risk factors via First Street. Map © Google.
Why this score? — see what drove the C- grade
The composite is a weighted blend of 9 inputs, each scored 0–100. Each bar is that input's sub-score; the figure is the points it added to the 100-point composite (weight × sub-score).
- Cash flow +16.5/30.0
- ARV discount +7.5/15.0
- Appreciation +7.5/10.0
- DSCR +5.1/10.0
- 1% rule +4.9/10.0
- Schools +4.0/10.0
- Livability +3.2/5.0
- Rent growth +2.5/5.0
- Condition / age +2.5/5.0
$100,000
🖨 Deal sheet 📄 Offer letter ✓ Due diligence
Listing remarks MLS
Close in and country quiet. 3 Bedroom 2 Bath with 1 car carport. 1248 sq ft. central heat and air. Located on . 726 Acre with fenced back yard. All appliances one year old, Recent exterior and interior paint. Also there is a place for RV. Water already in place beside extra driveway. Feel free to contact Jim Crawford at 936-462-0007 to set up showing or with any questions.
Key facts
- 0.73 acre lot
- Built 1950
- Listed 4 days
Neighborhood map
What this means for you Summary
Snapshot
- This is a 3-bed/2.0-bath single-family listed at $100k.
Deal economics
- At list price, monthly cash flow is $58 ($692/yr) — positive.
- The deal already cash-flows at list — no discount required.
- To meet the 1% rule (rent ≥ 1% of price), the offer needs to be $99k (1.2% below list).
- Recommended offer: $99k (1.2% below list) — sets the bar for 1% rule.
Location & tenants
- Location reads 64/100 on livability (#745 in TX) — a middle-class / working-renter tenant base. Strengths: crime A+, cost of living A+, housing A+; Watch: amenities F, commute F, employment F.
- Garrison ISD (rural): math 47% / reading 48% proficiency, ranked #233 of 826 in TX (top 28%) — families likely to look elsewhere, expect single-tenant / working-renter base with shorter leases.
- Zoned schools: Garrison El (math 52% / reading 52%, grade C-, #742 of 4,322 statewide, top 19%, 355 students, 58% FRL).
- Market conditions: 71 active listings in the ZIP; 4 units permitted in Rusk County in 2024 (0 in 5+ unit buildings).
Forward outlook
- In year one you build about $6k of equity ($691 loan paydown + $5k appreciation (5.1% local appreciation)).
- Rusk County population projected to shrink 5% by 2050 — rents likely to lag national; underwrite the cash flow, not the appreciation.
- At projected returns (5.1% appreciation + 3.0% rent growth), your $28k cash investment doubles in ~4 years — after that, you're playing with house money.
- By year 6, paydown + projected appreciation supports a ~$31k cash-out refi (75% LTV) — recoverable capital for the next deal without selling this one.
Negotiation context
- Only 4 days on market — expect competitive offers; lowballing is unlikely to land.
- 2 sale attempts since 10y ago with the ask held roughly flat each time — persistent listings suggest the price (not the market) is what's stuck; bring a comps-based counter.
Risks & watch-outs
- Watch-outs: built in 1950 — expect roof / HVAC / electrical / plumbing capex.
- Climate carrying-cost: severe wind risk, 80% chance of damaging wind over 30y; extreme-heat days projected 7→24/yr by 2055 (HVAC capex compounding) — expect insurance premiums to compound above CPI over the hold.
Questions for the listing agent
- Built in 1950 — when were the roof, HVAC, electrical panel, plumbing, and water heater last replaced?
- Is there a deadline driving the sale (1031 exchange, divorce, estate, relocation)? That informs how much negotiation room exists.
- What's the average days-on-market for RENTAL listings here right now (not sales)? A rising rental-DOM trend means longer vacancies and softer asking-rent achievability than the comps imply.
- What's the recent tenant-quality profile in this submarket — average credit score on applications, eviction rate, late-payment / NSF rate, and stable-employment percentage? A property-management company in the area should have these aggregated.
- How much new for-sale + rental construction is in the pipeline within 1–3 miles? Heavy new supply typically softens prices + rents 12–24 months out; constrained supply supports both.
Investment metrics
- 1% rule
- 0.99% ✗
- Cap rate
- 6.99%
- Cash-on-cash
- 2.47%
- DSCR
- 1.11
- GRM
- 8.4
CMA / ARV
No comps found within radius.
Projected returns pro-forma
5.06% appreciation · 3.0% rent growth · sell at horizon
- IRR
- 15.2%
- Equity multiple
- 1.97×
- Total profit
- $27,118
- Equity at exit
- $57,053
- IRR
- 15.7%
- Equity multiple
- 3.81×
- Total profit
- $78,720
- Equity at exit
- $98,786
Cash invested: $28,000 (down + closing). Projections, not guarantees.
Landlord ↔ Tenant lean methodology
- Overall (STATE)
- 87 Strongly Landlord-Friendly
- State Texas
- 87 Strongly Landlord-Friendly · R+5
- County
- — inherits STATE
- City
- — inherits STATE
ZIP-level market 75946
- Home prices YoY
- 3.1%
- Active inventory
- 71
- Price-to-rent
- 8.4×
Monthly cashflow live
- Estimated rent
- $988 medium interval (Pro) →
- Mortgage (P&I)
- −$524
- Tax from tax record
- −$157 /mo · $1,883/yr
- Insurance
- −$42
- HOA
- −$0
- Vacancy / Maint / Mgmt
- −$208
- Net cashflow
- $58
Break-even live
UW: 25.0% down · 7.5% · 30yr · 1.5% tax · 5.0% vac · 8.0% maint · 8.0% mgmt
Financing live
Cash to close
- Down payment
- $25,000
- Closing costs
- $3,000
- Reserves months
- —
- Total cash needed
- —
Loan-product check · same deal, 3 products live
Conventional
25% down · 7.5% · 30yr
- Down + closing
- —
- Monthly P&I
- —
- Monthly cashflow
- —
- DSCR
- —
- Eligible?
- —
Personal DTI + credit; lowest rate.
DSCR
20% down · 8.5% · 30yr
- Down + closing
- —
- Monthly P&I
- —
- Monthly cashflow
- —
- DSCR
- —
- Eligible?
- —
No personal income docs; deal must DSCR.
Hard money
10% down · 12.0% · 12mo
- Down + closing
- —
- Monthly P&I
- —
- Monthly cashflow
- —
- DSCR
- —
- Eligible?
- —
Short-term bridge; refi at stabilization.
Listing history 9 events
-
2025-06-21status Pending
-
2025-06-17$100,000 Active
-
2022-06-06soldstatus
-
2022-01-27soldstatus
-
2016-03-28soldstatus
-
2016-02-11soldstatus 376-char remark
Show marketing remark (376 chars)
Close in and country quiet. 3 Bedroom 2 Bath with 1 car carport. 1248 sq ft. central heat and air. Located on . 726 Acre with fenced back yard. All appliances one year old, Recent exterior and interior paint. Also there is a place for RV. Water already in place beside extra driveway. Feel free to contact Jim Crawford at 936-462-0007 to set up showing or with any questions.
-
2016-01-06$52,000 376-char remark
Show marketing remark (376 chars)
Close in and country quiet. 3 Bedroom 2 Bath with 1 car carport. 1248 sq ft. central heat and air. Located on . 726 Acre with fenced back yard. All appliances one year old, Recent exterior and interior paint. Also there is a place for RV. Water already in place beside extra driveway. Feel free to contact Jim Crawford at 936-462-0007 to set up showing or with any questions.
-
2003-05-05soldstatus
-
1987-02-17soldstatus
ⓘ Source: listings_history table (triggers on properties + properties_extension) + one-shot
backfill from property_details.listing_events for pre-trigger history.
Tax reassessment forecast TX · Resets to sale price
- Current annual tax
- $1,883 · $157/mo
- Projected year-2 tax
- $1,883 · $157/mo
- Expected delta
- $0/yr ($0/mo · 0.0%)
ⓘ Screening estimate from a state-policy table — verify with the county assessor before closing.
Climate risk First Street
- Flood 1/10 Low FEMA zone X (unshaded) · 0% chance over 30 yrs
- Wildfire 4/10 Moderate
- Heat 7/10 Severe 7 d/yr ≥110°F today · 24 d/yr by 30 yrs out
- Wind 8/10 Severe 80% chance of damaging wind over 30 yrs
- Air quality 1/10 Low 0 unhealthy d/yr today · 0 by 30 yrs out
Nearby sold comps map
Loading sold comps map…
Walkable amenities ~0.75 mi
Loading nearby amenities…
Taxation est. · year 1
- Rental income
- $11,858
- − Mortgage interest
- −$5,602
- − Property taxes
- −$1,883
- − Insurance
- −$500
- − Repairs & maintenance
- −$949
- − Management
- −$949
- − Depreciation
- −$2,909
- Taxable loss
- −$933
- Est. tax savings @ 24.0%
- +$224
- After-tax cash flow
- $916/yr
For passive investors: Depreciation is non-cash, so a rental often shows a tax loss while cash-flowing — sheltering income. Rental losses are passive: they offset passive income freely, and up to $25,000/yr can offset ordinary (W-2) income if you actively participate and your MAGI is under $100k (phasing out to $0 by $150k); unused losses carry forward. On sale, claimed depreciation is recaptured at up to 25%, and gains may owe capital-gains tax (a 1031 exchange can defer both). Figures are a year-1 estimate at your 24.0% rate — not tax advice; consult a CPA.
Schools (NCES district)
- District
- Garrison ISD
- NCES district ID
- 4820400
- Math proficiency
- 47% ▼ -3.00%
- Reading proficiency
- 48% ▲ 1.00%
- Median HH income
- $43,414
- Composite
- 40.09/100
- National rank
- #3808
- State rank
- #233 of 826 in TX
Livability — Garrison
- Score
- 64/100
- State rank
- #745
- US rank
- #13767
Category grades
Schools grade is shown separately in the Schools card above.
Census & demographics
- Population (ZIP)
- 3,536
Population outlook (Rusk County) Hauer SSP2
- Today (2025)
- 52,498 people
- By 2030
- 52,093 · -0.8%
- By 2040
- 50,866 · -3.1%
- By 2050
- 49,696 · -5.3%
- By 2075
- 48,583 · -7.5%
- By 2100
- 43,265 · -17.6%
Race, ethnicity, and origin ACS 2023
- Neighborhood character
- Predominantly White (74%)
- Race & ethnicity
- White 74% Black 17% Two or more races 7% Hispanic / Latino 4%
- Common ancestry
- Italian 3% Slovak 1% Lithuanian 1%
- Foreign-born
- 3% · Canada
- Languages at home
- 96% English-only · Spanish 4%
Political lean MEDSL · Rusk
- 2024 margin
- Solid R (+59.4) · D 20.0% · R 79.4%
- 2008→2024 swing
- -13.2pp toward R · 2008: -46.3pp · 2024: -59.4pp
- All cycles
- 2024: R+59.4 2020: R+55.7 2016: R+56.5 2012: R+51.1 2008: R+46.3
Not yet ingested
- Civics
- —
Market trends
- HPI YoY
- ▲ 5.06%
- Current HPI
- 169.019
- Rent YoY
- —
- Metro
- —
- State GDP YoY
- ▲ 3.95%
- F500 in state
- 110
Industry mix (Fortune 500 HQ in TX)
| Industry | F500 HQs | Revenue |
|---|---|---|
| Energy | 16 | $1,198B |
|
||
| Technology | 5 | $198B |
|
||
| Engineering / Construction | 4 | $72B |
|
||
| Energy Services | 3 | $60B |
|
||
| Utilities | 3 | $41B |
|
||
| Healthcare | 2 | $330B |
|
||
Price history
+92.3% since first listed9 events — show timeline
- 2025-06-21 Pending — NTREIS
- 2025-06-17 Listed $100,000 NTREIS
- 2022-06-06 Sold (Public Records) — Public Records
- 2022-01-27 Sold (Public Records) — Public Records
- 2016-03-28 Sold (Public Records) — Public Records
- 2016-02-11 Sold (MLS) — Deep East Texas MLS
- 2016-01-06 Listed $52,000 Deep East Texas MLS
- 2003-05-05 Sold (Public Records) — Public Records
- 1987-02-17 Sold (Public Records) — Public Records
Property tax history
+5.3%/yrLatest (2025): $1,883 · +12.9% YoY. Source: county tax records.
Cash-flow waterfall
monthlySold comps — $/sqft
last 12 mo · ≤1 miLoading sold comps…