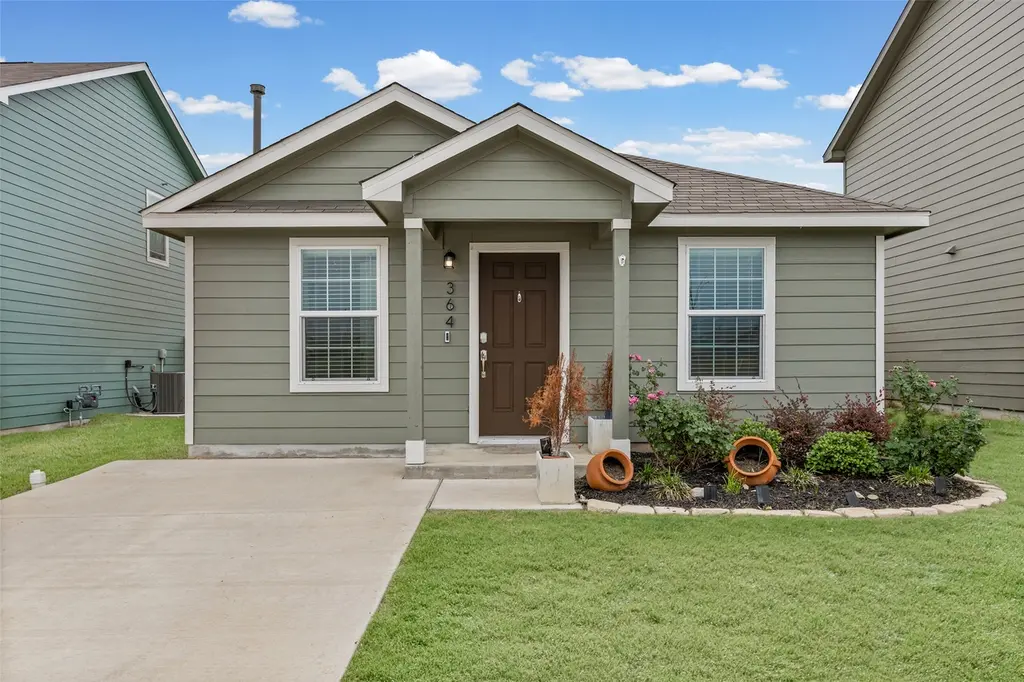
364 Gabbro Gdns · San Marcos, TX
Flood risk 1/10 · Minimal
- FEMA flood zone
- X (unshaded)
- Chance of flooding over 30 yrs
- 0.0%
- Est. flood insurance / yr
- $507 – $1,088
Fire risk 3/10 · Minor
- Est. fire insurance / yr
- $1,222 – $2,270
Heat risk 8/10 · Major
- Hot days now (above 108°F)
- 7 days/yr
- Hot days in 30 yrs
- 23 days/yr
Wind risk 8/10 · Major
- Chance of severe wind over 30 yrs
- 80.0%
Air-quality risk 1/10 · Minimal
- Unhealthy air days now
- 0 days/yr
- Unhealthy air days in 30 yrs
- 0 days/yr
Risk factors via First Street. Map © Google.
Why this score? — see what drove the D- grade
The composite is a weighted blend of 9 inputs, each scored 0–100. Each bar is that input's sub-score; the figure is the points it added to the 100-point composite (weight × sub-score).
- ARV discount +11.4/15.0
- Cash flow +7.1/30.0
- Appreciation +4.5/10.0
- Livability +4.0/5.0
- Schools +3.5/10.0
- 1% rule +2.6/10.0
- Condition / age +2.5/5.0
- DSCR +1.3/10.0
- Rent growth +1.2/5.0
$235,500
🖨 Deal sheet 📄 Offer letter ✓ Due diligence
Listing remarks
Charming and cozy three-bedroom, two-bathroom home featuring a modern kitchen with a spacious island and plenty of recessed lighting throughout. The home includes solar panels under a 20-year lease at $52.00 per month plus tax. Conveniently located with easy access to IH-35 via the newly widened Yarrington Rd, making commutes to Austin, San Marcos, and Kyle much quicker.
Key facts
- Spacious island
- Easy access to ih-35
- Modern kitchen
Tags
Property features AI
Finance
- Other: Solar panels (photovoltaic) for energy generation
- HOA & community: Membership in Sunset Oaks HOA; HOA fee $45 monthly (includes common area maintenance); Community playground and park
Exterior
- Parking: Driveway parking for 2 vehicles
- Security: Smoke detectors
- Utilities: Electricity connected; Natural gas connected; Water connected (private); Sewer connected (private)
- Home design: Single-story home; Resale property; Faces northwest
- Construction: Built by Lennar; HardiPlank exterior; Composition/shingle roof; Slab foundation; Built (year per public records)
- Exterior features: Private yard; Exterior steps; Automatic sprinklers; Small trees; Backyard wood fencing
Interior
- Kitchen: Dishwasher; Gas range; Microwave; Disposal; Exhaust/vented exhaust fan; Refrigerator
- Bedrooms: 3 main-level bedrooms
- Flooring: Vinyl flooring
- Bathrooms: 2 full bathrooms
- Heating & cooling: Central heating (natural gas); Central electric air conditioning
- Interior features: Breakfast bar; Kitchen island; Main-level primary bedroom; Quartz countertops; Recessed lighting; Walk-in closet(s); Double-pane windows with screens
- Laundry & utility: Laundry room; Washer hookup; Electric dryer hookup; Washer; Dryer; Gas water heater
Neighborhood map
What this means for you Summary
Snapshot
- This is a 3-bed/2.0-bath single-family listed at $236k.
Deal economics
- At list price, monthly cash flow is $-340 ($-4k/yr) — negative.
- To cash-flow at today's rent, offer at most $176k (25.5% below list).
- To meet the 1% rule (rent ≥ 1% of price), the offer needs to be $180k (23.6% below list).
- Recommended offer: $176k (25.5% below list) — sets the bar for cash-flow.
- Cap rate 4.6% vs local median 3.1% in San Marcos — top-decile yield for the area; either an underpriced asset or a hidden risk that comps aren't pricing in. Stress-test before assuming the spread holds.
Location & tenants
- Location reads 81/100 on livability (#30 in TX, #1,601 nationally) — a professional / high-income tenant draw. Strengths: amenities A+, cost of living A+, health & safety A+; Watch: crime D+, schools F, employment F.
- Hays CISD (rural): math 35% / reading 41% proficiency, ranked #390 of 826 in TX (top 47%) — families likely to look elsewhere, expect single-tenant / working-renter base with shorter leases.
- Market conditions: Rents falling (-5.4%/yr); 307 active listings in the ZIP; 35 comparable units currently listed for rent nearby; rentals at typical pace (median 18d on market — plan ~3-4 weeks tenant-placement turnaround); solid renter incomes; 5,270 units permitted in Hays County in 2024 (1,464 in 5+ unit buildings).
Forward outlook
- Local home prices are declining (-1.0%/yr); year-one equity from $2k of loan paydown is wiped out by about $2k of value loss. Plan a longer hold.
- Hays County population projected at +93% by 2050 — long-run rental-demand tailwind backs the buy-and-hold thesis.
Negotiation context
- It's been on market 47 days — a 3% lower offer ($228k) is reasonable based on typical stale-listing flexibility.
Risks & watch-outs
- Climate carrying-cost: severe wind risk, 80% chance of damaging wind over 30y; extreme-heat days projected 7→23/yr by 2055 (HVAC capex compounding) — expect insurance premiums to compound above CPI over the hold.
Questions for the listing agent
- What do current leases actually rent for vs. the listed asking? Can we see a recent rent roll and the last 12 months of T-12 income?
- It's been on market 47 days. Have you received any prior offers? Is the seller open to a 25% concession, seller financing, or rate buy-down credit?
- What does the HOA fee cover, when was the last increase, and are there any pending special assessments or reserve-fund shortfalls?
- Is there a deadline driving the sale (1031 exchange, divorce, estate, relocation)? That informs how much negotiation room exists.
- Schools are F-rated, which usually means shorter tenancies and higher turnover. Who's the typical renter profile here, and what's been the actual vacancy rate?
- Crime grade is D in this area — have there been break-ins, vandalism, or insurance claims at this property in the last 3 years? What carrier currently insures it and at what premium?
- The area grade is low — what's the realistic commute time and amenity access for the typical tenant pool here? Any planned neighborhood developments (good or bad) we should know about?
- What's the average days-on-market for RENTAL listings here right now (not sales)? A rising rental-DOM trend means longer vacancies and softer asking-rent achievability than the comps imply.
- What's the recent tenant-quality profile in this submarket — average credit score on applications, eviction rate, late-payment / NSF rate, and stable-employment percentage? A property-management company in the area should have these aggregated.
- How much new for-sale + rental construction is in the pipeline within 1–3 miles? Heavy new supply typically softens prices + rents 12–24 months out; constrained supply supports both.
Investment metrics
- 1% rule
- 0.76% ✗
- Cap rate
- 4.56%
- Cash-on-cash
- -6.18%
- DSCR
- 0.73
- GRM
- 10.9
CMA / ARV
- ARV (median comp)
- $257,723
- List price
- $235,500
- Delta
- -8.62%
- Verdict
- FAIR
- Comps
- 20 within 1.0 mi
Show comp detail 12 sales within ~0.75 mi
| Address | Dist | Beds/Ba | Sqft | Sold | Price | $/sf | Match |
|---|---|---|---|---|---|---|---|
| 130 Soapstone Pass | 0.13mi | 3/2.5 | 1,450 (0%) | 5mo | $179,900 | $124 | 88 |
| 130 Soapstone Pass | 0.13mi | 3/2.5 | 1,450 (0%) | 5mo | $170,000 | $117 | 88 |
| 125 Gabbro Gdns | 0.24mi | 3/2.0 | 1,450 (0%) | 1mo | $217,000 | $150 | 88 |
| 234 Fairlawn Way | 0.22mi | 3/2.0 | 1,580 (+9%) | 1mo | $309,900 | $196 | 74 |
| 221 Fairlawn Way | 0.21mi | 3/2.0 | 1,580 (+9%) | 2mo | $309,900 | $196 | 74 |
| 465 Low Pasture Trl | 0.29mi | 3/2.0 | 1,572 (+8%) | 1mo | $297,065 | $189 | 71 |
| 433 Low Pasture Trl | 0.29mi | 3/2.0 | 1,280 (-12%) | 1mo | $268,990 | $210 | 66 |
| 606 Aplite Pass | 0.37mi | 3/2.0 | 1,305 (-10%) | 4mo | $225,000 | $172 | 63 |
| 162 Gabbro Gdns | 0.20mi | 4/2.0 (+1) | 1,616 (+11%) | 5mo | $199,999 | $124 | 62 |
| 313 Haywood Cres | 0.62mi | 4/2.0 (+1) | 1,468 (+1%) | 7mo | $267,100 | $182 | 58 |
| 256 Estallo Way | 0.66mi | 4/2.0 (+1) | 1,468 (+1%) | 7mo | $267,100 | $182 | 56 |
| 281 Estallo Way | 0.65mi | 3/2.0 | 1,306 (-10%) | 8mo | $262,410 | $201 | 46 |
Match score weights: distance 35% · size 25% · config 20% · recency 20%. Top-matched comps best support the ARV.
Projected returns pro-forma
-1.02% appreciation · 0.0% rent growth · sell at horizon
- IRR
- -16.3%
- Equity multiple
- 0.32×
- Total profit
- $-44,787
- Equity at exit
- $56,568
- IRR
- -12.7%
- Equity multiple
- -0.03×
- Total profit
- $-67,878
- Equity at exit
- $59,162
Cash invested: $65,940 (down + closing). Projections, not guarantees.
Landlord ↔ Tenant lean methodology
- Overall (STATE)
- 87 Strongly Landlord-Friendly
- State Texas
- 87 Strongly Landlord-Friendly · R+5
- County
- — inherits STATE
- City
- — inherits STATE
ZIP-level market 78656
- Home prices YoY
- -0.5%
- Rents YoY
- -5.4%
- Active inventory
- 307
- Price-to-rent
- 10.9×
Monthly cashflow live
- Estimated rent
- $1,800 high interval (Pro) →
- Mortgage (P&I)
- −$1,235
- Tax from tax record
- −$383 /mo · $4,601/yr
- Insurance
- −$98
- HOA
- −$45
- Vacancy / Maint / Mgmt
- −$378
- Net cashflow
- $-340
Break-even live
UW: 25.0% down · 7.5% · 30yr · 1.5% tax · 5.0% vac · 8.0% maint · 8.0% mgmt
Financing live
Cash to close
- Down payment
- $58,875
- Closing costs
- $7,065
- Reserves months
- —
- Total cash needed
- —
Loan-product check · same deal, 3 products live
Conventional
25% down · 7.5% · 30yr
- Down + closing
- —
- Monthly P&I
- —
- Monthly cashflow
- —
- DSCR
- —
- Eligible?
- —
Personal DTI + credit; lowest rate.
DSCR
20% down · 8.5% · 30yr
- Down + closing
- —
- Monthly P&I
- —
- Monthly cashflow
- —
- DSCR
- —
- Eligible?
- —
No personal income docs; deal must DSCR.
Hard money
10% down · 12.0% · 12mo
- Down + closing
- —
- Monthly P&I
- —
- Monthly cashflow
- —
- DSCR
- —
- Eligible?
- —
Short-term bridge; refi at stabilization.
Rent comps 35 comps
| Address | Beds | Baths | Sqft | Rent | $/sqft | DOM | Units | Dist |
|---|---|---|---|---|---|---|---|---|
| 427 Gabbro Gdns Maxwell, TX | 3.0 | 2.0 | 1402 | $1,550 | $1.11 | 43d | 1 | 0.05mi |
| 328 Mica Trl Maxwell, TX | 4.0 | 2.0 | 1627 | $1,595 | $0.98 | 43d | 1 | 0.12mi |
| 300 Geode Gln Maxwell, TX | 4.0 | 2.5 | 1712 | $1,795 | $1.05 | 43d | 1 | 0.12mi |
| 230 Gabbro Gdns Maxwell, TX | 3.0 | 2.0 | 1440 | $1,500 | $1.04 | 17d | 1 | 0.15mi |
| 543 Gabbro Gdns Maxwell, TX | 4.0 | 2.0 | 1627 | $1,695 | $1.04 | 21d | 1 | 0.15mi |
| 566 Gabbro Gdns Maxwell, TX | 4.0 | 2.5 | 1837 | $1,850 | $1.01 | 16d | 1 | 0.16mi |
| 296 Agate Cliff Dr Maxwell, TX | 3.0 | 2.0 | 1421 | $1,695 | $1.19 | 11d | 1 | 0.18mi |
| 192 Gabbro Gdns Maxwell, TX | 4.0 | 2.5 | 1610 | $1,699 | $1.06 | 43d | 1 | 0.18mi |
| 147 Gabbro Gdns Maxwell, TX | 3.0 | 2.0 | 1450 | $1,441 | $0.99 | 43d | 1 | 0.23mi |
| 283 Soapstone Pass Maxwell, TX | 3.0 | 2.0 | 1440 | $1,609 | $1.12 | 16d | 1 | 0.24mi |
| 312 Soapstone Pass Maxwell, TX | 3.0 | 2.0 | 1450 | $1,600 | $1.10 | 43d | 1 | 0.24mi |
| 275 Aplite Pass Maxwell, TX | 2.0–5.0 | 2.0–3.5 | 1733 | $2,160 | $1.25 | 1d | 1 | 0.38mi |
| 214 Kyanite Dr Maxwell, TX | 4.0 | 2.5 | 1535 | $1,650 | $1.07 | 43d | 1 | 0.41mi |
| 351 Cobb Branch Dr Maxwell, TX | 3.0–4.0 | 2.0–3.0 | 1616 | $1,780 | $1.10 | 1d | 4 | 0.43mi |
| 171 Haywood Mnr Maxwell, TX | 3.0 | 2.0 | 1533 | $1,850 | $1.21 | 4d | 1 | 0.68mi |
| 274 Jade St Maxwell, TX | 4.0 | 2.0 | 1468 | $1,795 | $1.22 | 43d | 1 | 0.73mi |
| 124 Hidden Branch Cv Maxwell, TX | 3.0 | 2.5 | 1698 | $1,845 | $1.09 | 4d | 1 | 0.74mi |
| 251 Tempest Trl Maxwell, TX | 3.0 | 2.0 | 1553 | $1,650 | $1.06 | 17d | 1 | 0.76mi |
| 146 White Dunes Dr Maxwell, TX | 3.0 | 2.5 | 1698 | $1,850 | $1.09 | 12d | 1 | 0.76mi |
| 146 White Dunes Dr Maxwell, TX | 3.0 | 2.0 | 1698 | $1,850 | $1.09 | 43d | 1 | 0.76mi |
| 1259 Delta Crst Maxwell, TX | 4.0 | 2.0 | 1522 | $1,695 | $1.11 | 17d | 1 | 0.79mi |
| 293 Tempest Trl Maxwell, TX | 3.0 | 2.5 | 1698 | $1,825 | $1.07 | 4d | 1 | 0.79mi |
| 108 White Dunes Dr Maxwell, TX | 3.0 | 2.0 | 1514 | $1,800 | $1.19 | 4d | 1 | 0.79mi |
| 108 White Dunes Dr Maxwell, TX | 3.0 | 2.0 | 1514 | $1,800 | $1.19 | 17d | 1 | 0.79mi |
| 108 White Dunes Dr Maxwell, TX | 3.0 | 2.0 | 1514 | $1,800 | $1.19 | 23d | 1 | 0.79mi |
| 211 Living Reef Dr Maxwell, TX | 3.0 | 2.5 | 1782 | $1,840 | $1.03 | 17d | 1 | 0.82mi |
| 195 Living Reef Dr Maxwell, TX | 3.0 | 2.5 | 1782 | $1,900 | $1.07 | 4d | 1 | 0.83mi |
| 151 Living Reef Dr Maxwell, TX | 3.0 | 2.5 | 1782 | $1,895 | $1.06 | 4d | 1 | 0.86mi |
| 170 Living Reef Dr Maxwell, TX | 3.0 | 2.0 | 1500 | $1,850 | $1.23 | 43d | 1 | 0.87mi |
| 444 Delta Crst Maxwell, TX | 3.0 | 2.5 | 1830 | $1,850 | $1.01 | 4d | 1 | 0.89mi |
| 704 Delta Crst Maxwell, TX | 3.0–5.0 | 2.0–3.0 | 1904 | $1,694 | $0.89 | 1d | 15 | 1.08mi |
| 531 Paris St Maxwell, TX | 4.0 | 2.0 | 1667 | $1,950 | $1.17 | 1d | 1 | 1.23mi |
| 839 Gully St Maxwell, TX | 2.0–4.0 | 2.0 | 1105 | $1,528 | $1.38 | 1d | 306 | 1.25mi |
| 205 E Lima Dr Maxwell, TX | 4.0 | 2.0 | 1600 | $1,999 | $1.25 | 23d | 1 | 1.28mi |
| 245 Bethpage Dr San Marcos, TX | 4.0 | 2.0 | 1845 | $1,950 | $1.06 | 43d | 1 | 1.41mi |
HOA detail
- Monthly dues
- $45 · $540/yr
Listing history 15 events
-
2026-06-18days on market $235,500 Active 47 DOM
-
2026-06-17days on market $235,500 Active 46 DOM
-
2026-06-16days on market $235,500 Active 45 DOM
-
2026-06-15days on market $235,500 Active 44 DOM
-
2026-06-13days on market $235,500 Active 42 DOM
-
2026-06-09days on market $235,500 Active 38 DOM
-
2026-06-08days on market $235,500 Active 37 DOM
-
2026-06-07days on market $235,500 Active 36 DOM
-
2026-06-05days on market $235,500 Active 33 DOM
-
2026-06-03days on market $235,500 Active 32 DOM
-
2026-06-02days on market $235,500 Active 31 DOM
-
2026-06-01days on market $235,500 Active 30 DOM
-
2026-05-31days on market $235,500 Active 29 DOM
-
2026-05-11price $235,500 373-char remark
-
2026-05-02$269,000 Active 373-char remark
ⓘ Source: listings_history table (triggers on properties + properties_extension) + one-shot
backfill from property_details.listing_events for pre-trigger history.
Tax reassessment forecast TX · Resets to sale price
- Current annual tax
- $4,601 · $383/mo
- Projected year-2 tax
- $4,601 · $383/mo
- Expected delta
- $0/yr ($0/mo · 0.0%)
ⓘ Screening estimate from a state-policy table — verify with the county assessor before closing.
Climate risk First Street
- Flood 1/10 Low FEMA zone X (unshaded) · 0% chance over 30 yrs
- Wildfire 3/10 Moderate
- Heat 8/10 Severe 7 d/yr ≥108°F today · 23 d/yr by 30 yrs out
- Wind 8/10 Severe 80% chance of damaging wind over 30 yrs
- Air quality 1/10 Low 0 unhealthy d/yr today · 0 by 30 yrs out
Nearby sold comps map
Loading sold comps map…
Walkable amenities ~0.75 mi
Loading nearby amenities…
Taxation est. · year 1
- Rental income
- $21,599
- − Mortgage interest
- −$13,192
- − Property taxes
- −$4,601
- − Insurance
- −$1,178
- − Repairs & maintenance
- −$1,728
- − Management
- −$1,728
- − HOA
- −$540
- − Depreciation
- −$6,851
- Taxable loss
- −$8,218
- Est. tax savings @ 24.0%
- +$1,972
- After-tax cash flow
- $-2,103/yr
For passive investors: Depreciation is non-cash, so a rental often shows a tax loss while cash-flowing — sheltering income. Rental losses are passive: they offset passive income freely, and up to $25,000/yr can offset ordinary (W-2) income if you actively participate and your MAGI is under $100k (phasing out to $0 by $150k); unused losses carry forward. On sale, claimed depreciation is recaptured at up to 25%, and gains may owe capital-gains tax (a 1031 exchange can defer both). Figures are a year-1 estimate at your 24.0% rate — not tax advice; consult a CPA.
Schools (NCES district)
- District
- Hays CISD
- NCES district ID
- 4800010
- Math proficiency
- 35% ▼ -15.00%
- Reading proficiency
- 41% ▼ -5.00%
- Median HH income
- $70,570
- Composite
- 34.78/100
- National rank
- #5118
- State rank
- #390 of 826 in TX
Livability — San Marcos
- Score
- 81/100
- State rank
- #30
- US rank
- #1601
Category grades
Schools grade is shown separately in the Schools card above.
Census & demographics
- County
- Caldwell County · 25,195 people
- City population
- 88,583
- Metro
- Austin-Round Rock-Georgetown, TX
- Population (ZIP)
- 2,847
- Household income
- $81,346
- Rent vs Own
- Severe rent burden
- 89.0
Population outlook (Hays County) Hauer SSP2
- Today (2025)
- 286,948 people
- By 2030
- 336,923 · +17.4%
- By 2040
- 441,894 · +54.0%
- By 2050
- 553,462 · +92.9%
- By 2075
- 838,261 · +192.1%
- By 2100
- 1,063,658 · +270.7%
Race, ethnicity, and origin ACS 2023
- Neighborhood character
- Predominantly Hispanic (76%)
- Race & ethnicity
- Hispanic / Latino 76% Two or more races 21% White 20% Black 4%
- Hispanic origin (detail)
- Mexican 72%
- Common ancestry
- Romanian 4% Slovak 2% Lithuanian 1%
- Foreign-born
- 18% · Canada
- Languages at home
- 45% English-only · Spanish 55%
Political lean MEDSL · Hays
- 2024 margin
- Lean D (+5.7) · D 52.1% · R 46.5% · Other 1.4%
- 2008→2024 swing
- +7.7pp toward D · 2008: -2.0pp · 2024: 5.7pp
- All cycles
- 2024: D+5.7 2020: D+10.8 2016: R+0.9 2012: R+10.4 2008: R+2.0
Not yet ingested
- Civics
- —
Market trends
- HPI YoY
- ▼ -1.02%
- Current HPI
- 228.3622
- Rent YoY
- ▼ -5.36%
- Metro
- Austin-Round Rock-Georgetown, TX
- State GDP YoY
- ▲ 3.95%
- F500 in state
- 110
Industry mix (Fortune 500 HQ in TX)
| Industry | F500 HQs | Revenue |
|---|---|---|
| Energy | 16 | $1,198B |
|
||
| Technology | 5 | $198B |
|
||
| Engineering / Construction | 4 | $72B |
|
||
| Energy Services | 3 | $60B |
|
||
| Utilities | 3 | $41B |
|
||
| Healthcare | 2 | $330B |
|
||
Price history
-12.5% since first listed2 events — show timeline
- 2026-05-11 Price Changed $235,500 Unlock MLS
- 2026-05-02 Listed $269,000 Unlock MLS
Property tax history
+10.6%/yrLatest (2025): $4,601 · -3.3% YoY. Source: county tax records.
Cash-flow waterfall
monthlySold comps — $/sqft
last 12 mo · ≤1 miLoading sold comps…