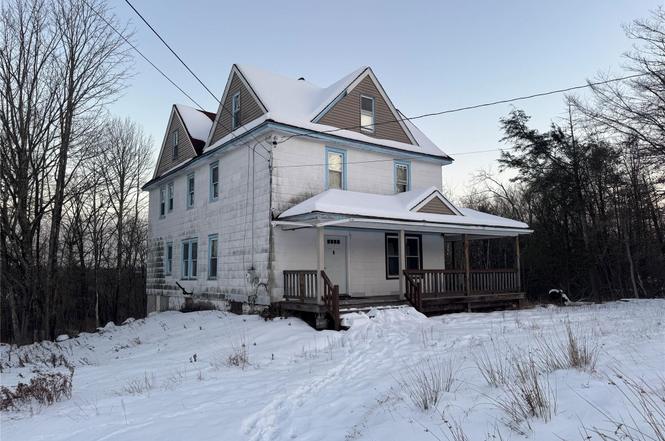
74 Cold Spring Rd · Liberty, NY
Flood risk 1/10 · Minimal
- FEMA flood zone
- X (unshaded)
- Chance of flooding over 30 yrs
- 0.0%
- Est. flood insurance / yr
- $473 – $860
Fire risk 1/10 · Minimal
- Est. fire insurance / yr
- $691 – $1,283
Heat risk 2/10 · Minimal
- Hot days now (above 90°F)
- 7 days/yr
- Hot days in 30 yrs
- 17 days/yr
Wind risk 2/10 · Minimal
- Chance of severe wind over 30 yrs
- 4.0%
Air-quality risk 2/10 · Minimal
- Unhealthy air days now
- 0 days/yr
- Unhealthy air days in 30 yrs
- 1 days/yr
Risk factors via First Street. Map © Google.
Why this score? — see what drove the C+ grade
The composite is a weighted blend of 9 inputs, each scored 0–100. Each bar is that input's sub-score; the figure is the points it added to the 100-point composite (weight × sub-score).
- ARV discount +15.0/15.0
- Cash flow +14.7/30.0
- Appreciation +10.0/10.0
- 1% rule +5.6/10.0
- DSCR +4.5/10.0
- Livability +3.1/5.0
- Schools +2.8/10.0
- Rent growth +2.5/5.0
- Condition / age +2.5/5.0
$199,999
🖨 Deal sheet 📄 Offer letter ✓ Due diligence
Listing remarks
Welcome to this spacious 9-bedroom SRO property located in Liberty, NY. This fixer-upper offers exceptional potential for the right buyer with vision. Formerly operated as a boarding house, this home features nine bedrooms (5 legal bedrooms), along with multiple dens and office spaces that provide flexible layout options. With its generous footprint and classic structure, the property presents an ideal opportunity for a savvy investor, owner-operator, or those seeking to create an individual compound or multi-use residence.
Key facts
- Generous footprint
- Classic structure
- 1.17 acre lot
Tags
Neighborhood map
What this means for you Summary
Snapshot
- This is a 5-bed/2.0-bath single-family listed at $200k.
Deal economics
- At list price, monthly cash flow is $51 ($609/yr) — positive.
- The deal already cash-flows at list — no discount required.
- Meets the 1% rule at list price ($2k rent vs $200k).
- Recommended offer: $194k (3.0% below list) — sets the bar for market timing.
- Cap rate 6.6% vs local median 3.8% in Liberty — top-decile yield for the area; either an underpriced asset or a hidden risk that comps aren't pricing in. Stress-test before assuming the spread holds.
Location & tenants
- Location reads 62/100 on livability (#890 in NY) — a middle-class / working-renter tenant base. Strengths: cost of living A+, health & safety A+, housing B+; Watch: crime D+, amenities F, commute F.
- Liberty Central School District (town): math 31% / reading 34% proficiency, ranked #569 of 590 in NY (top 96%) — families likely to look elsewhere, expect single-tenant / working-renter base with shorter leases.
- Zoned schools: Liberty Elementary School (math 27% / reading 42%, grade F, #1,577 of 2,108 statewide, top 77%, 691 students, 64% FRL); Liberty Middle School (math 12% / reading 29%, grade F, #664 of 729 statewide, top 91%, 529 students, 68% FRL); Liberty High School (math 92% / reading 70%, grade A, #495 of 1,100 statewide, top 46%, 596 students, 62% FRL) — zoned schools average 65% FRL vs 48% district-wide (16 pts higher); higher-poverty schools than district average — tighter screening recommended.
- Zoned-school proficiency averages 45% at this address vs 32% district-wide (+13 pts) — the actual schools serving this property are materially stronger than the Liberty Central School District average implies; a family-tenant draw the district grade alone would hide.
- Market conditions: 65 active listings in the ZIP; 2 comparable units currently listed for rent nearby; 739 units permitted in Sullivan County in 2024 (5 in 5+ unit buildings).
Forward outlook
- In year one you build about $21k of equity ($1k loan paydown + $20k appreciation (10.0% local appreciation)).
- Sullivan County population projected at -24% by 2050 — secular population decline; favor cash flow + early exit over multi-decade hold.
- At projected returns (10.0% appreciation + 3.0% rent growth), your $56k cash investment doubles in ~3 years — after that, you're playing with house money.
- By year 2, paydown + projected appreciation supports a ~$34k cash-out refi (75% LTV) — recoverable capital for the next deal without selling this one.
Negotiation context
- It's been on market 46 days — a 3% lower offer ($194k) is reasonable based on typical stale-listing flexibility.
- 2 sale attempts with the ask held roughly flat each time — persistent listings suggest the price (not the market) is what's stuck; bring a comps-based counter.
Risks & watch-outs
- Watch-outs: property tax is 2.9% of price; built in 1910 — expect roof / HVAC / electrical / plumbing capex.
Questions for the listing agent
- It's been on market 46 days. Have you received any prior offers? Is the seller open to a 3% concession, seller financing, or rate buy-down credit?
- Built in 1910 — when were the roof, HVAC, electrical panel, plumbing, and water heater last replaced?
- Property tax is high relative to price — has the assessment been appealed recently, and will the sale trigger a re-assessment?
- Is there a deadline driving the sale (1031 exchange, divorce, estate, relocation)? That informs how much negotiation room exists.
- Crime grade is D in this area — have there been break-ins, vandalism, or insurance claims at this property in the last 3 years? What carrier currently insures it and at what premium?
- What's the average days-on-market for RENTAL listings here right now (not sales)? A rising rental-DOM trend means longer vacancies and softer asking-rent achievability than the comps imply.
- What's the recent tenant-quality profile in this submarket — average credit score on applications, eviction rate, late-payment / NSF rate, and stable-employment percentage? A property-management company in the area should have these aggregated.
- How much new for-sale + rental construction is in the pipeline within 1–3 miles? Heavy new supply typically softens prices + rents 12–24 months out; constrained supply supports both.
Investment metrics
- 1% rule
- 1.06% ✓
- Cap rate
- 6.60%
- Cash-on-cash
- 1.09%
- DSCR
- 1.05
- GRM
- 7.9
CMA / ARV
- ARV (on-the-fly)
- $322,320
- Comps found
- 6
Show comp detail 6 sales within ~0.75 mi
| Address | Dist | Beds/Ba | Sqft | Sold | Price | $/sf | Match |
|---|---|---|---|---|---|---|---|
| 74 Cold Spring Rd | 0.00mi | 5/2.0 | 2,040 (0%) | 1mo | $199,999 | $98 | 100 |
| 9 Delaware Ave | 0.37mi | 4/2.5 (-1) | 1,970 (-3%) | 17mo | $312,000 | $158 | 56 |
| 404 N Main St | 0.54mi | 6/2.0 (+1) | 1,800 (-12%) | 1mo | $225,000 | $125 | 49 |
| 72 Lincoln Pl | 0.72mi | 4/2.0 (-1) | 1,842 (-10%) | 0mo | $269,000 | $146 | 45 |
| 22 Marion Ave | 0.66mi | 4/1.5 (-1) | 2,228 (+9%) | 6mo | $369,000 | $166 | 42 |
| 182 Cold Spring Rd | 0.43mi | 4/2.0 (-1) | 2,280 (+12%) | 18mo | $366,000 | $161 | 40 |
Match score weights: distance 35% · size 25% · config 20% · recency 20%. Top-matched comps best support the ARV.
Projected returns pro-forma
10.0% appreciation · 3.0% rent growth · sell at horizon
- IRR
- 25.1%
- Equity multiple
- 3.01×
- Total profit
- $112,334
- Equity at exit
- $180,175
- IRR
- 22.2%
- Equity multiple
- 6.87×
- Total profit
- $328,614
- Equity at exit
- $388,554
Cash invested: $56,000 (down + closing). Projections, not guarantees.
Landlord ↔ Tenant lean methodology
- Overall (STATE)
- 15 Strongly Tenant-Friendly
- State New York
- 15 Strongly Tenant-Friendly · D+10
- County
- — inherits STATE
- City
- — inherits STATE
ZIP-level market 12754
- Home prices YoY
- 28.0%
- Active inventory
- 65
- Price-to-rent
- 7.9×
Monthly cashflow live
- Estimated rent
- $2,111 medium interval (Pro) →
- Mortgage (P&I)
- −$1,049
- Tax from tax record
- −$485 /mo · $5,821/yr
- Insurance
- −$83
- HOA
- −$0
- Vacancy / Maint / Mgmt
- −$443
- Net cashflow
- $51
Break-even live
UW: 25.0% down · 7.5% · 30yr · 1.5% tax · 5.0% vac · 8.0% maint · 8.0% mgmt
Financing live
Cash to close
- Down payment
- $50,000
- Closing costs
- $6,000
- Reserves months
- —
- Total cash needed
- —
Loan-product check · same deal, 3 products live
Conventional
25% down · 7.5% · 30yr
- Down + closing
- —
- Monthly P&I
- —
- Monthly cashflow
- —
- DSCR
- —
- Eligible?
- —
Personal DTI + credit; lowest rate.
DSCR
20% down · 8.5% · 30yr
- Down + closing
- —
- Monthly P&I
- —
- Monthly cashflow
- —
- DSCR
- —
- Eligible?
- —
No personal income docs; deal must DSCR.
Hard money
10% down · 12.0% · 12mo
- Down + closing
- —
- Monthly P&I
- —
- Monthly cashflow
- —
- DSCR
- —
- Eligible?
- —
Short-term bridge; refi at stabilization.
Rent comps 2 comps
| Address | Beds | Baths | Sqft | Rent | $/sqft | DOM | Units | Dist |
|---|---|---|---|---|---|---|---|---|
| 12 Liberty St Liberty, NY | 4.0 | 2.5 | 2200 | $2,350 | $1.07 | 23d | 1 | 0.48mi |
| 44 Webster Ave Liberty, NY | 6.0 | 1.0 | 2092 | $1,750 | $0.84 | 23d | 1 | 0.77mi |
Listing history 8 events
-
2026-02-02status Pending
-
2025-12-18$199,999 Active
-
2025-12-16historical
-
2025-10-01price $280,000
-
2025-05-05$325,000 Active
-
2023-03-27soldstatus $200,000
-
2002-07-03soldstatus $50,000
-
1995-01-13soldstatus $79,000
ⓘ Source: listings_history table (triggers on properties + properties_extension) + one-shot
backfill from property_details.listing_events for pre-trigger history.
Tax reassessment forecast NY · Partial reset (capped growth)
- Current annual tax
- $5,821 · $485/mo
- Projected year-2 tax
- $5,821 · $485/mo
- Expected delta
- $0/yr ($0/mo · 0.0%)
ⓘ Screening estimate from a state-policy table — verify with the county assessor before closing.
Climate risk First Street
- Flood 1/10 Low FEMA zone X (unshaded) · 0% chance over 30 yrs
- Wildfire 1/10 Low
- Heat 2/10 Low 7 d/yr ≥90°F today · 17 d/yr by 30 yrs out
- Wind 2/10 Low 4% chance of damaging wind over 30 yrs
- Air quality 2/10 Low 0 unhealthy d/yr today · 1 by 30 yrs out
Nearby sold comps map
Loading sold comps map…
Walkable amenities ~0.75 mi
Loading nearby amenities…
Taxation est. · year 1
- Rental income
- $25,337
- − Mortgage interest
- −$11,203
- − Property taxes
- −$5,821
- − Insurance
- −$1,000
- − Repairs & maintenance
- −$2,027
- − Management
- −$2,027
- − Depreciation
- −$5,818
- Taxable loss
- −$2,559
- Est. tax savings @ 24.0%
- +$614
- After-tax cash flow
- $1,223/yr
For passive investors: Depreciation is non-cash, so a rental often shows a tax loss while cash-flowing — sheltering income. Rental losses are passive: they offset passive income freely, and up to $25,000/yr can offset ordinary (W-2) income if you actively participate and your MAGI is under $100k (phasing out to $0 by $150k); unused losses carry forward. On sale, claimed depreciation is recaptured at up to 25%, and gains may owe capital-gains tax (a 1031 exchange can defer both). Figures are a year-1 estimate at your 24.0% rate — not tax advice; consult a CPA.
Schools (NCES district)
- District
- Liberty Central School District
- NCES district ID
- 3617220
- Math proficiency
- 31% ▼ -8.00%
- Reading proficiency
- 34% ▼ -4.00%
- Median HH income
- $43,542
- Composite
- 27.65/100
- National rank
- #6920
- State rank
- #569 of 590 in NY
Livability — Liberty
- Score
- 62/100
- State rank
- #890
- US rank
- #17254
Category grades
Schools grade is shown separately in the Schools card above.
Census & demographics
- City population
- 8,525
- Population (ZIP)
- 8,525
Population outlook (Sullivan County) Hauer SSP2
- Today (2025)
- 68,974 people
- By 2030
- 65,609 · -4.9%
- By 2040
- 58,878 · -14.6%
- By 2050
- 52,500 · -23.9%
- By 2075
- 39,941 · -42.1%
- By 2100
- 28,880 · -58.1%
Race, ethnicity, and origin ACS 2023
- Neighborhood character
- Diverse neighborhood (Simpson 0.56)
- Race & ethnicity
- White 56% Hispanic / Latino 36% Two or more races 8% Black 4% Asian 2% Native American 1%
- Hispanic origin (detail)
- Mexican 3% Puerto Rican 7% Dominican 2%
- Common ancestry
- Romanian 3% Lithuanian 2% Scotch-Irish 1%
- Foreign-born
- 22% · Canada, Dominican Republic, Jamaica
- Languages at home
- 71% English-only · Spanish 25% Other Indo-European 2% French/Haitian/Cajun 1%
Political lean MEDSL · Sullivan
- 2024 margin
- R (+16.7) · D 41.6% · R 58.4%
- 2008→2024 swing
- -26.2pp toward R · 2008: 9.5pp · 2024: -16.7pp
- All cycles
- 2024: R+16.7 2020: R+9.2 2016: R+13.7 2012: D+10.4 2008: D+9.5
Not yet ingested
- Civics
- —
Market trends
- HPI YoY
- ▲ 100.10%
- Current HPI
- 457.3342
- Rent YoY
- —
- Metro
- —
- State GDP YoY
- ▲ 2.60%
- F500 in state
- 92
Industry mix (Fortune 500 HQ in NY)
| Industry | F500 HQs | Revenue |
|---|---|---|
| Financial Services | 10 | $950B |
|
||
| Consumer Goods | 9 | $162B |
|
||
| Insurance | 4 | $225B |
|
||
| Telecommunications | 2 | $144B |
|
||
| Pharmaceuticals | 2 | $112B |
|
||
| Media / Entertainment | 2 | $69B |
|
||
Price history
+153.2% since first listed8 events — show timeline
- 2026-02-02 Pending — OneKey® MLS as Distributed by MLS Grid
- 2025-12-18 Listed $199,999 OneKey® MLS as Distributed by MLS Grid
- 2025-12-16 Listing Removed — OneKey® MLS as Distributed by MLS Grid
- 2025-10-01 Price Changed $280,000 OneKey® MLS as Distributed by MLS Grid
- 2025-05-05 Listed $325,000 OneKey® MLS as Distributed by MLS Grid
- 2023-03-27 Sold (Public Records) $200,000 Public Records
- 2002-07-03 Sold (Public Records) $50,000 Public Records
- 1995-01-13 Sold (Public Records) $79,000 Public Records
Property tax history
-0.3%/yrLatest (2025): $5,821 · +0.8% YoY. Source: county tax records.
Cash-flow waterfall
monthlySold comps — $/sqft
last 12 mo · ≤1 miLoading sold comps…