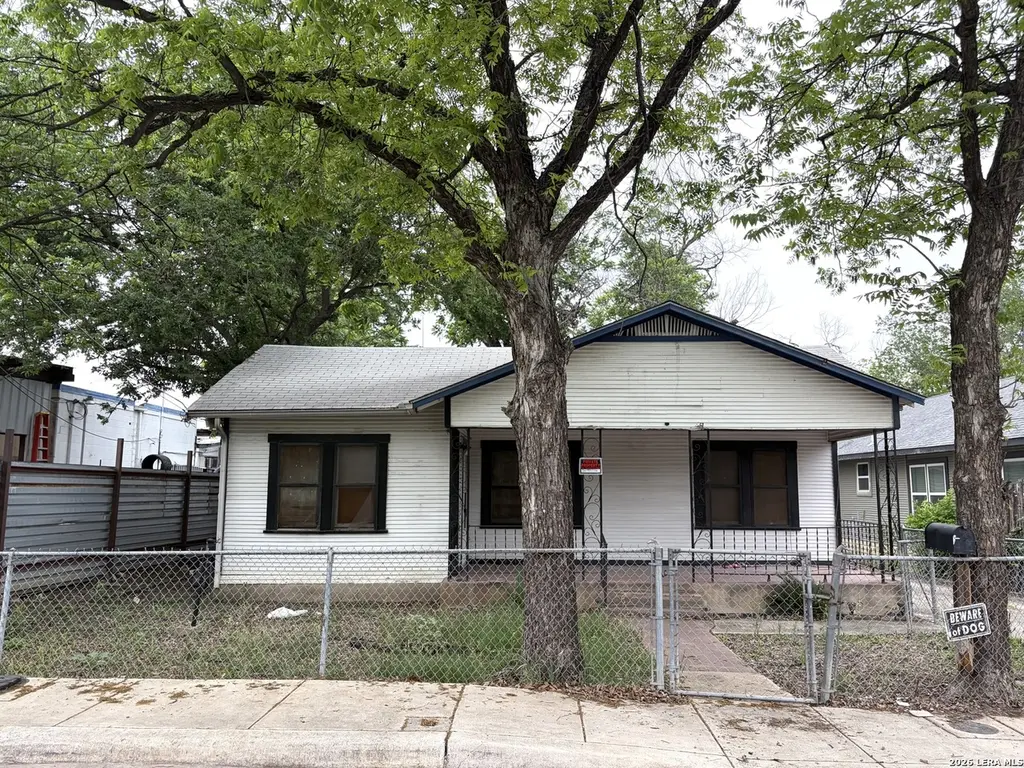
319 Mckay · San Antonio, TX
Flood risk 4/10 · Minor
- FEMA flood zone
- X (unshaded)
- Chance of flooding over 30 yrs
- 0.2%
- Est. flood insurance / yr
- $507 – $1,088
Fire risk 1/10 · Minimal
- Est. fire insurance / yr
- $1,222 – $2,270
Heat risk 8/10 · Major
- Hot days now (above 109°F)
- 7 days/yr
- Hot days in 30 yrs
- 22 days/yr
Wind risk 8/10 · Major
- Chance of severe wind over 30 yrs
- 80.0%
Air-quality risk 2/10 · Minimal
- Unhealthy air days now
- 1 days/yr
- Unhealthy air days in 30 yrs
- 2 days/yr
Risk factors via First Street. Map © Google.
Why this score? — see what drove the B grade
The composite is a weighted blend of 9 inputs, each scored 0–100. Each bar is that input's sub-score; the figure is the points it added to the 100-point composite (weight × sub-score).
- Cash flow +27.6/30.0
- 1% rule +10.0/10.0
- Appreciation +10.0/10.0
- DSCR +9.7/10.0
- ARV discount +7.5/15.0
- Livability +4.0/5.0
- Condition / age +2.5/5.0
- Rent growth +2.1/5.0
- Schools +1.4/10.0
$110,000
🖨 Deal sheet 📄 Offer letter ✓ Due diligence
Listing remarks
This property presents a prime opportunity for investors seeking their next renovation project. This home is ready for transformation with a solid layout. Three-bedroom and two full-bath! Surrounded by ongoing development and revitalization. Send me your offers.
Key facts
- 6,272 sq ft lot
- Built 1935
- Listed 49 days
Property features AI
Finance
- Other: Possession at closing/funding; For sale
- Financial info: Down payment resources not indicated
- HOA & community: Located in the Beanville subdivision
Exterior
- Parking: No parking details provided
- Utilities: Water service by SAWS; Sewer service by SAWS; Electric service by CPS; Gas service by CPS; City garbage service
- Home design: Pre-owned single-family property; Approximately 91 years old
- Construction: Siding exterior; Composition roof
- Exterior features: Covered patio; Patio slab; Chain link fence; Paved streets, sidewalks, and streetlights
Interior
- Kitchen: Eat-in kitchen (11 x 10)
- Bedrooms: Master bedroom (10 x 10) with full bath; Bedroom 2 (8 x 8); Bedroom 3 (8 x 8)
- Flooring: Other (see remarks)
- Bathrooms: Two full bathrooms; Master bath with tub/shower combination (7 x 7)
- Heating & cooling: Electric heating; Window air conditioner (1)
- Interior features: One living area; Eat-in kitchen; Washer and dryer connections
- Laundry & utility: Washer connection; Dryer connection
Neighborhood map
What this means for you Summary
Snapshot
- This is a 2-bed/1.0-bath single-family listed at $110k.
Deal economics
- At list price, monthly cash flow is $329 ($4k/yr) — positive.
- The deal already cash-flows at list — no discount required.
- Meets the 1% rule at list price ($2k rent vs $110k).
- Recommended offer: $107k (3.0% below list) — sets the bar for market timing.
- Cap rate 9.9% vs local median 3.8% in San Antonio — top-decile yield for the area; either an underpriced asset or a hidden risk that comps aren't pricing in. Stress-test before assuming the spread holds.
Location & tenants
- Location reads 80/100 on livability (#31 in TX, #1,616 nationally) — a professional / high-income tenant draw. Strengths: amenities A+, commute A+, cost of living A+; Watch: crime F.
- San Antonio ISD (urban): math 12% / reading 22% proficiency, ranked #805 of 826 in TX (top 98%) — low school quality limits family demand, transient renter base, plan for 1-2y turnover; 80% free/reduced lunch — lower-income household profile, screen leases tightly.
- Zoned schools: Hillcrest El (math 8% / reading 12%, grade F, #4,259 of 4,322 statewide, top 99%, 354 students, 93% FRL); Burbank H S (math 9% / reading 20%, grade F, #1,522 of 1,632 statewide, top 94%, 1,319 students, 90% FRL, charter).
- Market conditions: Rents soft (-1.4%/yr); 94 active listings in the ZIP; 40 comparable units currently listed for rent nearby; rentals at typical pace (median 20d on market — plan ~3-4 weeks tenant-placement turnaround); 8,308 units permitted in Bexar County in 2024 (2,506 in 5+ unit buildings).
Forward outlook
- In year one you build about $12k of equity ($761 loan paydown + $11k appreciation (10.0% local appreciation)).
- Bexar County population projected at +50% by 2050 — long-run rental-demand tailwind backs the buy-and-hold thesis.
- At projected returns (10.0% appreciation + 0.0% rent growth), your $31k cash investment doubles in ~2 years — after that, you're playing with house money.
- By year 4, paydown + projected appreciation supports a ~$42k cash-out refi (75% LTV) — recoverable capital for the next deal without selling this one.
Negotiation context
- It's been on market 49 days — a 3% lower offer ($107k) is reasonable based on typical stale-listing flexibility.
- 2 sale attempts with the ask held roughly flat each time — persistent listings suggest the price (not the market) is what's stuck; bring a comps-based counter.
Risks & watch-outs
- Watch-outs: property tax is 3.9% of price; built in 1935 — expect roof / HVAC / electrical / plumbing capex.
- Climate carrying-cost: severe wind risk, 80% chance of damaging wind over 30y; extreme-heat days projected 7→22/yr by 2055 (HVAC capex compounding) — expect insurance premiums to compound above CPI over the hold.
Questions for the listing agent
- It's been on market 49 days. Have you received any prior offers? Is the seller open to a 3% concession, seller financing, or rate buy-down credit?
- Built in 1935 — when were the roof, HVAC, electrical panel, plumbing, and water heater last replaced?
- Property tax is high relative to price — has the assessment been appealed recently, and will the sale trigger a re-assessment?
- Is there a deadline driving the sale (1031 exchange, divorce, estate, relocation)? That informs how much negotiation room exists.
- Crime grade is F in this area — have there been break-ins, vandalism, or insurance claims at this property in the last 3 years? What carrier currently insures it and at what premium?
- What's the average days-on-market for RENTAL listings here right now (not sales)? A rising rental-DOM trend means longer vacancies and softer asking-rent achievability than the comps imply.
- What's the recent tenant-quality profile in this submarket — average credit score on applications, eviction rate, late-payment / NSF rate, and stable-employment percentage? A property-management company in the area should have these aggregated.
- How much new for-sale + rental construction is in the pipeline within 1–3 miles? Heavy new supply typically softens prices + rents 12–24 months out; constrained supply supports both.
Investment metrics
- 1% rule
- 1.51% ✓
- Cap rate
- 9.88%
- Cash-on-cash
- 12.83%
- DSCR
- 1.57
- GRM
- 5.5
CMA / ARV
- ARV (median comp)
- $287,130
- List price
- $110,000
- Delta
- -61.69%
- Verdict
- UNDERPRICED
- Comps
- 20 within 1.0 mi
Show comp detail 12 sales within ~0.75 mi
| Address | Dist | Beds/Ba | Sqft | Sold | Price | $/sf | Match |
|---|---|---|---|---|---|---|---|
| 250 Oelkers | 0.24mi | 3/2.0 (+1) | 1,416 (-3%) | 8mo | $224,900 | $159 | 68 |
| 302 Regent | 0.39mi | 3/2.0 (+1) | 1,471 (+0%) | 13mo | $219,000 | $149 | 61 |
| 559 W Highland Blvd | 0.60mi | 3/1.0 (+1) | 1,409 (-4%) | 1mo | $165,000 | $117 | 60 |
| 118 Tipton | 0.14mi | 3/2.0 (+1) | 1,256 (-14%) | 2mo | $249,500 | $199 | 60 |
| 335 Helena St | 0.44mi | 3/2.0 (+1) | 1,404 (-4%) | 7mo | $400,000 | $285 | 58 |
| 212 W Baylor | 0.52mi | 3/2.0 (+1) | 1,507 (+3%) | 6mo | $298,900 | $198 | 56 |
| 206 E Lambert | 0.44mi | 3/2.0 (+1) | 1,344 (-8%) | 4mo | $264,000 | $196 | 54 |
| 147 E Baylor | 0.36mi | 2/2.0 | 1,680 (+15%) | 2mo | $315,000 | $188 | 53 |
| 519 W Mitchell | 0.15mi | 3/2.0 (+1) | 1,259 (-14%) | 11mo | $264,900 | $210 | 52 |
| 124 E Baylor | 0.39mi | 3/2.0 (+1) | 1,600 (+9%) | 13mo | $259,900 | $162 | 46 |
| 214 E Theo Ave | 0.55mi | 3/2.0 (+1) | 1,350 (-8%) | 13mo | $254,000 | $188 | 42 |
| 341 Lone Star | 0.59mi | 3/2.0 (+1) | 1,276 (-13%) | 8mo | $305,000 | $239 | 36 |
Match score weights: distance 35% · size 25% · config 20% · recency 20%. Top-matched comps best support the ARV.
Projected returns pro-forma
10.0% appreciation · 0.0% rent growth · sell at horizon
- IRR
- 32.1%
- Equity multiple
- 3.47×
- Total profit
- $76,178
- Equity at exit
- $99,097
- IRR
- 26.6%
- Equity multiple
- 7.48×
- Total profit
- $199,451
- Equity at exit
- $213,706
Cash invested: $30,800 (down + closing). Projections, not guarantees.
Landlord ↔ Tenant lean methodology
- Overall (STATE)
- 87 Strongly Landlord-Friendly
- State Texas
- 87 Strongly Landlord-Friendly · R+5
- County
- — inherits STATE
- City
- — inherits STATE
ZIP-level market 78204
- Home prices YoY
- 6.4%
- Rents YoY
- -1.4%
- Active inventory
- 94
- Price-to-rent
- 5.5×
Monthly cashflow live
- Estimated rent
- $1,660 high interval (Pro) →
- Mortgage (P&I)
- −$577
- Tax from tax record
- −$359 /mo · $4,310/yr
- Insurance
- −$46
- HOA
- −$0
- Vacancy / Maint / Mgmt
- −$349
- Net cashflow
- $329
Break-even live
UW: 25.0% down · 7.5% · 30yr · 1.5% tax · 5.0% vac · 8.0% maint · 8.0% mgmt
Financing live
Cash to close
- Down payment
- $27,500
- Closing costs
- $3,300
- Reserves months
- —
- Total cash needed
- —
Loan-product check · same deal, 3 products live
Conventional
25% down · 7.5% · 30yr
- Down + closing
- —
- Monthly P&I
- —
- Monthly cashflow
- —
- DSCR
- —
- Eligible?
- —
Personal DTI + credit; lowest rate.
DSCR
20% down · 8.5% · 30yr
- Down + closing
- —
- Monthly P&I
- —
- Monthly cashflow
- —
- DSCR
- —
- Eligible?
- —
No personal income docs; deal must DSCR.
Hard money
10% down · 12.0% · 12mo
- Down + closing
- —
- Monthly P&I
- —
- Monthly cashflow
- —
- DSCR
- —
- Eligible?
- —
Short-term bridge; refi at stabilization.
Rent comps 40 comps
| Address | Beds | Baths | Sqft | Rent | $/sqft | DOM | Units | Dist |
|---|---|---|---|---|---|---|---|---|
| 323 W Mitchell St San Antonio, TX | 1.0–2.0 | 1.0–2.0 | 788 | $1,257 | $1.59 | 3d | 1 | 0.10mi |
| 271 E Lambert St San Antonio, TX | 3.0 | 1.0 | 950 | $1,250 | $1.32 | 20d | 1 | 0.38mi |
| 120 Bank St San Antonio, TX | 3.0 | 2.0 | 1035 | $1,450 | $1.40 | 20d | 1 | 0.49mi |
| 120 Bank St San Antonio, TX | 3.0 | 2.0 | 1035 | $1,495 | $1.44 | 43d | 1 | 0.49mi |
| 131 Elsie Unit 301 San Antonio, TX | 2.0 | 1.0 | 950 | $795 | $0.84 | 4d | 1 | 0.54mi |
| 222 E Mitchell St San Antonio, TX | 2.0 | 1.0–2.0 | 972 | $1,825 | $1.88 | 2d | 16 | 0.54mi |
| 413 Probandt San Antonio, TX | 2.0 | 1.0 | 996 | $1,400 | $1.41 | 20d | 1 | 0.60mi |
| 110 Dowdy St San Antonio, TX | 3.0 | 1.0 | 1120 | $1,395 | $1.25 | 24d | 1 | 0.62mi |
| 147 Saint Francis Ave San Antonio, TX | 3.0 | 2.0 | 1224 | $1,800 | $1.47 | 4d | 1 | 0.62mi |
| 438 Pruitt Ave #1 San Antonio, TX | 2.0 | 1.0 | 980 | $1,245 | $1.27 | 43d | 1 | 0.71mi |
| 423 Blue Star Unit 710 San Antonio, TX | 2.0 | 2.0 | 1209 | $1,929 | $1.60 | 3d | 1 | 0.76mi |
| 114 Teresa San Antonio, TX | 3.0 | 1.0 | 984 | $1,450 | $1.47 | 24d | 1 | 0.77mi |
| 222 Glass Ave San Antonio, TX | 2.0 | 2.0 | 1007 | $2,400 | $2.38 | 43d | 1 | 0.79mi |
| 330 Clay St #24 San Antonio, TX | 2.0 | 2.0 | 1424 | $2,395 | $1.68 | 12d | 1 | 0.81mi |
| 330 Clay St #28 San Antonio, TX | 3.0 | 2.5 | 1670 | $2,400 | $1.44 | 43d | 1 | 0.81mi |
| 262 E Cevallos San Antonio, TX | 2.0 | 2.5 | 1354 | $2,055 | $1.52 | 43d | 1 | 0.86mi |
| 302 E Cevallos St Unit 1 San Antonio, TX | 2.0 | 1.0 | 1132 | $1,550 | $1.37 | 24d | 1 | 0.87mi |
| 301 E Cevallos San Antonio, TX | 2.0 | 1.0–2.5 | 983 | $1,819 | $1.85 | 3d | 14 | 0.89mi |
| 127 Clay #2 San Antonio, TX | 1.0 | 1.0 | 936 | $1,250 | $1.34 | 43d | 1 | 0.92mi |
| 415 Furnish Ave San Antonio, TX | 3.0 | 2.0 | 1670 | $1,995 | $1.19 | 17d | 1 | 0.94mi |
| 215 E Cevallos San Antonio, TX | 3.0 | 1.0–3.0 | 1162 | $2,348 | $2.02 | 1d | 20 | 0.97mi |
| 1722 S Saint Marys St San Antonio, TX | 1.0 | 1.0 | 880 | $1,350 | $1.53 | 14d | 1 | 0.98mi |
| 203 Nogalitos St #5 San Antonio, TX | 3.0 | 2.5 | 1872 | $3,100 | $1.66 | 24d | 1 | 0.98mi |
| 134 Gladstone St San Antonio, TX | 2.0 | 1.0 | 1407 | $1,000 | $0.71 | 11d | 1 | 0.99mi |
| 2007 S Presa St San Antonio, TX | 2.0 | 1.0 | 1276 | $1,800 | $1.41 | 14d | 1 | 1.00mi |
| 1426 S Alamo St Unit D-142 San Antonio, TX | 1.0 | 1.0 | 1253 | $1,165 | $0.93 | 43d | 1 | 1.03mi |
| 310 Finton Unit A San Antonio, TX | 1.0 | 1.0 | 960 | $850 | $0.89 | 43d | 1 | 1.04mi |
| 161 Kaine St San Antonio, TX | 3.0 | 1.0 | 1000 | $1,450 | $1.45 | 17d | 1 | 1.06mi |
| 122 Biering St #2 San Antonio, TX | 2.0 | 1.0 | 1472 | $1,100 | $0.75 | 43d | 1 | 1.06mi |
| 1519 S Presa St San Antonio, TX | 3.0 | 3.5 | 1747 | $3,200 | $1.83 | 43d | 1 | 1.07mi |
| 220 Hansford St San Antonio, TX | 3.0 | 2.0 | 1269 | $1,600 | $1.26 | 3d | 1 | 1.08mi |
| 614 Barbe St San Antonio, TX | 2.0 | 2.0 | 1200 | $1,500 | $1.25 | 24d | 1 | 1.09mi |
| 308 Keller St San Antonio, TX | 3.0 | 2.0 | 1296 | $3,400 | $2.62 | 43d | 1 | 1.09mi |
| 305 Keller St Unit NA San Antonio, TX | 3.0 | 2.0 | 1200 | $1,800 | $1.50 | 14d | 1 | 1.09mi |
| 517 Hicks Ave San Antonio, TX | 3.0 | 2.0 | 1520 | $1,700 | $1.12 | 43d | 1 | 1.10mi |
| 302 W Cevallos Unit 1 San Antonio, TX | 2.0 | 1.0 | 1132 | $1,550 | $1.37 | 24d | 1 | 1.11mi |
| 1901 S San Marcos Unit 710 San Antonio, TX | 2.0 | 2.0 | 985 | $1,147 | $1.16 | 3d | 1 | 1.12mi |
| 227 Claudia St Unit 1 San Antonio, TX | 2.0 | 1.5 | 1809 | $3,500 | $1.93 | 12d | 1 | 1.13mi |
| 227 Claudia St Unit 1 San Antonio, TX | 2.0 | 1.5 | 1809 | $3,500 | $1.93 | 14d | 1 | 1.13mi |
| 227 Claudia St Unit 3 San Antonio, TX | 2.0 | 1.0 | 887 | $2,495 | $2.81 | 20d | 1 | 1.13mi |
Listing history 19 events
-
2026-06-18days on market $110,000 Active 49 DOM
-
2026-06-17days on market $110,000 Active 48 DOM
-
2026-06-16statusdays on market $110,000 Active 47 DOM
-
2026-06-15days on market $110,000 Price Change 46 DOM
-
2026-06-13days on market $110,000 Price Change 44 DOM
-
2026-06-09days on market $110,000 Price Change 40 DOM
-
2026-06-08days on market $110,000 Price Change 39 DOM
-
2026-06-07pricestatusdays on market $110,000 Price Change 38 DOM
-
2026-06-04days on market $115,000 Active 35 DOM
-
2026-06-03days on market $115,000 Active 34 DOM
-
2026-06-02days on market $115,000 Active 33 DOM
-
2026-06-01days on market $115,000 Active 32 DOM
-
2026-05-31days on market $115,000 Active 31 DOM
-
2026-04-30$115,000 New 262-char remark
-
2026-04-29soldstatus
-
2026-03-23soldstatus
-
2025-09-18historical
-
2025-08-23price $115,000
-
2025-08-14$125,000 New
ⓘ Source: listings_history table (triggers on properties + properties_extension) + one-shot
backfill from property_details.listing_events for pre-trigger history.
Tax reassessment forecast TX · Resets to sale price
- Current annual tax
- $4,310 · $359/mo
- Projected year-2 tax
- $4,310 · $359/mo
- Expected delta
- $0/yr ($0/mo · 0.0%)
ⓘ Screening estimate from a state-policy table — verify with the county assessor before closing.
Climate risk First Street
- Flood 4/10 Moderate FEMA zone X (unshaded) · 20% chance over 30 yrs
- Wildfire 1/10 Low
- Heat 8/10 Severe 7 d/yr ≥109°F today · 22 d/yr by 30 yrs out
- Wind 8/10 Severe 80% chance of damaging wind over 30 yrs
- Air quality 2/10 Low 1 unhealthy d/yr today · 2 by 30 yrs out
Nearby sold comps map
Loading sold comps map…
Walkable amenities ~0.75 mi
Loading nearby amenities…
Taxation est. · year 1
- Rental income
- $19,916
- − Mortgage interest
- −$6,162
- − Property taxes
- −$4,310
- − Insurance
- −$550
- − Repairs & maintenance
- −$1,593
- − Management
- −$1,593
- − Depreciation
- −$3,200
- Taxable income
- $2,508
- Est. tax owed @ 24.0%
- −$602
- After-tax cash flow
- $3,349/yr
For passive investors: Depreciation is non-cash, so a rental often shows a tax loss while cash-flowing — sheltering income. Rental losses are passive: they offset passive income freely, and up to $25,000/yr can offset ordinary (W-2) income if you actively participate and your MAGI is under $100k (phasing out to $0 by $150k); unused losses carry forward. On sale, claimed depreciation is recaptured at up to 25%, and gains may owe capital-gains tax (a 1031 exchange can defer both). Figures are a year-1 estimate at your 24.0% rate — not tax advice; consult a CPA.
Schools (NCES district)
- District
- San Antonio ISD
- NCES district ID
- 4838730
- Math proficiency
- 12% ▼ -21.00%
- Reading proficiency
- 22% ▼ -7.00%
- Median HH income
- $30,952
- Composite
- 13.57/100
- National rank
- #9512
- State rank
- #805 of 826 in TX
Livability — San Antonio
- Score
- 80/100
- State rank
- #31
- US rank
- #1616
Category grades
Schools grade is shown separately in the Schools card above.
Census & demographics
- Census place
- San Antonio, TX
- County
- Bexar County · 1,990,555 people
- City population
- 1,806,925
- Metro
- San Antonio-New Braunfels, TX
- Population (ZIP)
- 11,983
- Household income
- $60,255
- Rent vs Own
- Severe rent burden
- 545.0
Population outlook (Bexar County) Hauer SSP2
- Today (2025)
- 2,336,851 people
- By 2030
- 2,560,728 · +9.6%
- By 2040
- 3,020,569 · +29.3%
- By 2050
- 3,493,522 · +49.5%
- By 2075
- 4,668,459 · +99.8%
- By 2100
- 5,533,242 · +136.8%
Race, ethnicity, and origin ACS 2023
- Neighborhood character
- Predominantly Hispanic (82%)
- Race & ethnicity
- Hispanic / Latino 82% Two or more races 37% White 15% Black 2% Native American 2%
- Hispanic origin (detail)
- Mexican 74%
- Common ancestry
- Romanian 3% Italian 2% Lithuanian 1%
- Foreign-born
- 15% · Canada
- Languages at home
- 50% English-only · Spanish 49%
Political lean MEDSL · Bexar
- 2024 margin
- Lean D (+9.8) · D 54.3% · R 44.6% · Other 1.1%
- 2008→2024 swing
- +4.2pp toward D · 2008: 5.6pp · 2024: 9.8pp
- All cycles
- 2024: D+9.8 2020: D+18.2 2016: D+13.5 2012: D+4.6 2008: D+5.6
Not yet ingested
- Civics
- —
Market trends
- HPI YoY
- ▲ 14.91%
- Current HPI
- 249.0597
- Rent YoY
- ▼ -1.44%
- Metro
- San Antonio-New Braunfels, TX
- State GDP YoY
- ▲ 3.95%
- F500 in state
- 110
Industry mix (Fortune 500 HQ in TX)
| Industry | F500 HQs | Revenue |
|---|---|---|
| Energy | 16 | $1,198B |
|
||
| Technology | 5 | $198B |
|
||
| Engineering / Construction | 4 | $72B |
|
||
| Energy Services | 3 | $60B |
|
||
| Utilities | 3 | $41B |
|
||
| Healthcare | 2 | $330B |
|
||
Price history
-12.0% since first listed7 events — show timeline
- 2026-06-06 Price Changed $110,000 LERA
- 2026-04-30 Listed $115,000 LERA
- 2026-04-29 Sold (Public Records) — Public Records
- 2026-03-23 Sold (Public Records) — Public Records
- 2025-09-18 Listing Removed — LERA
- 2025-08-23 Price Changed $115,000 LERA
- 2025-08-14 Listed $125,000 LERA
Property tax history
+10.0%/yrLatest (2025): $4,310 · +3.6% YoY. Source: county tax records.
Cash-flow waterfall
monthlySold comps — $/sqft
last 12 mo · ≤1 miLoading sold comps…