54 Iroquois No. Plan · Fort Myers Beach, FL
Flood risk No data
- FEMA flood zone
- —
- Chance of flooding over 30 yrs
- —
- Est. flood insurance / yr
- —
Fire risk No data
- Est. fire insurance / yr
- —
Heat risk No data
- Hot days now (above threshold)
- —
- Hot days in 30 yrs
- —
Wind risk No data
- Chance of severe wind over 30 yrs
- —
Air-quality risk No data
- Unhealthy air days now
- —
- Unhealthy air days in 30 yrs
- —
Risk factors via First Street. Map © Google.
Why this score? — see what drove the B grade
The composite is a weighted blend of 9 inputs, each scored 0–100. Each bar is that input's sub-score; the figure is the points it added to the 100-point composite (weight × sub-score).
- Cash flow +30.0/30.0
- DSCR +10.0/10.0
- 1% rule +8.9/10.0
- ARV discount +7.5/15.0
- Condition / age +4.8/5.0
- Schools +4.1/10.0
- Livability +3.5/5.0
- Rent growth +2.5/5.0
- Appreciation +0.0/10.0
$193,995
🖨 Deal sheet 📄 Offer letter ✓ Due diligence
Listing remarks
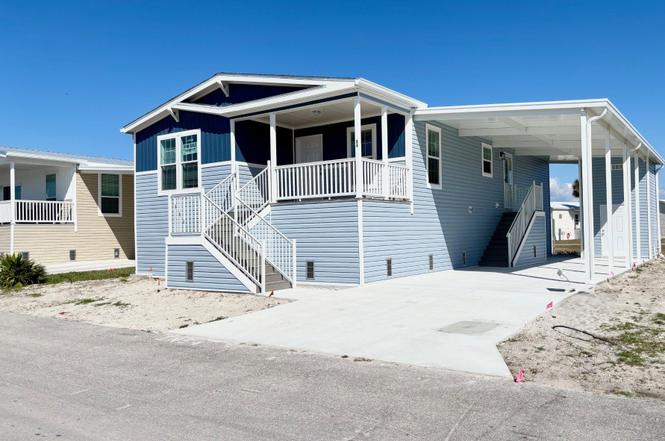
This brand-new, 1,393-square-foot home offers a perfect blend of modern luxury and coastal relaxation, situated in the highly sought-after Sun Resorts and Residences in Fort Myers Beach. Designed with an emphasis on light and space, this 2-bedroom, 2-bathroom residence is the ideal sanctuary for those looking to enjoy the best of the 55+ Florida lifestyle. Interior Highlights Modern Open Concept: The heart of the home features a seamless open floor plan that connects the kitchen, dining, and living areas perfect for entertaining or quiet evenings in. Soaring Ceilings & Lighting: High ceilings and strategically placed recessed lighting create an airy, expansive feel throughout the enti
Key facts
- Luxury finishes
- Modern open concept
- Chef s kitchen
Tags
Property features AI
Finance
- Financial info: List price $193,995
Exterior
- Home design: Single-family plan
- Exterior features: Living area approximately 1393
Interior
- Bedrooms: 2 bedrooms
- Bathrooms: 2 full bathrooms
- Interior features: Plan: 54 Iroquois No.
Neighborhood map
What this means for you Summary
Snapshot
- This is a 2-bed/2.0-bath manufactured listed at $194k. Condition is rated excellent.
Deal economics
- At list price, monthly cash flow is $796 ($10k/yr) — positive.
- The deal already cash-flows at list — no discount required.
- Meets the 1% rule at list price ($3k rent vs $194k).
- Recommended offer: $177k (9.0% below list) — sets the bar for market timing.
- Cap rate 11.2% vs local median 0.3% in Fort Myers Beach — top-decile yield for the area; either an underpriced asset or a hidden risk that comps aren't pricing in. Stress-test before assuming the spread holds.
Location & tenants
- Location reads 69/100 on livability (#489 in FL) — a middle-class / working-renter tenant base. Strengths: crime A+, employment A+, schools A-; Watch: amenities F, commute F, cost of living F.
- Lee (suburban): math 47% / reading 50% proficiency, ranked #42 of 73 in FL (top 58%) — families likely to look elsewhere, expect single-tenant / working-renter base with shorter leases.
- Market conditions: 876 active listings in the ZIP; 40 comparable units currently listed for rent nearby; rentals at typical pace (median 24d on market — plan ~3-4 weeks tenant-placement turnaround); solid renter incomes; 15,411 units permitted in Lee County in 2024 (4,686 in 5+ unit buildings).
- This rent runs 41% of the median local income ($79k/yr) — at the standard rent-burdened threshold; future hikes will face affordability resistance.
Forward outlook
- Local home prices are declining (-3.0%/yr); year-one equity from $1k of loan paydown is wiped out by about $6k of value loss. Plan a longer hold.
- Lee County population projected at +44% by 2050 — long-run rental-demand tailwind backs the buy-and-hold thesis.
- At projected returns (-3.0% appreciation + 3.0% rent growth), your $54k cash investment doubles in ~7 years — after that, you're playing with house money.
Negotiation context
- It's been on market 96 days — a 9% lower offer ($177k) is reasonable based on typical stale-listing flexibility.
Questions for the listing agent
- It's been on market 96 days. Have you received any prior offers? Is the seller open to a 9% concession, seller financing, or rate buy-down credit?
- Why hasn't it sold? Are there any deal-killer items the seller is aware of (foundation, flood, title, zoning, code violations)?
- Is there a deadline driving the sale (1031 exchange, divorce, estate, relocation)? That informs how much negotiation room exists.
- Schools are A-rated — typically a magnet for longer-tenancy family renters. What's the average tenant stay here, and is there a school-zone premium baked into asking?
- What's the average days-on-market for RENTAL listings here right now (not sales)? A rising rental-DOM trend means longer vacancies and softer asking-rent achievability than the comps imply.
- What's the recent tenant-quality profile in this submarket — average credit score on applications, eviction rate, late-payment / NSF rate, and stable-employment percentage? A property-management company in the area should have these aggregated.
- How much new for-sale + rental construction is in the pipeline within 1–3 miles? Heavy new supply typically softens prices + rents 12–24 months out; constrained supply supports both.
Investment metrics
- 1% rule
- 1.39% ✓
- Cap rate
- 11.21%
- Cash-on-cash
- 17.58%
- DSCR
- 1.78
- GRM
- 6.0
CMA / ARV
- ARV (on-the-fly)
- $402,577
- Comps found
- 1
Show comp detail 1 sale within ~0.75 mi
| Address | Dist | Beds/Ba | Sqft | Sold | Price | $/sf | Match |
|---|---|---|---|---|---|---|---|
| 17561 Bryan Ct | 0.41mi | 2/2.0 | 1,296 (-7%) | 4mo | $375,000 | $289 | 66 |
Match score weights: distance 35% · size 25% · config 20% · recency 20%. Top-matched comps best support the ARV.
Projected returns pro-forma
-3.0% appreciation · 3.0% rent growth · sell at horizon
- IRR
- 9.0%
- Equity multiple
- 1.35×
- Total profit
- $19,278
- Equity at exit
- $28,925
- IRR
- 18.2%
- Equity multiple
- 2.51×
- Total profit
- $82,202
- Equity at exit
- $16,773
Cash invested: $54,319 (down + closing). Projections, not guarantees.
Landlord ↔ Tenant lean methodology
- Overall (STATE)
- 87 Strongly Landlord-Friendly
- State Florida
- 87 Strongly Landlord-Friendly · R+3
- County
- — inherits STATE
- City
- — inherits STATE
ZIP-level market 33931
- Home prices YoY
- -18.8%
- Active inventory
- 876
- Price-to-rent
- 6.0×
Monthly cashflow live
- Estimated rent
- $2,704 high interval (Pro) →
- Mortgage (P&I)
- −$1,017
- Tax est. 1.5%
- −$242 /mo · $2,910/yr
- Insurance
- −$81
- HOA
- −$0
- Vacancy / Maint / Mgmt
- −$568
- Net cashflow
- $796
Break-even live
UW: 25.0% down · 7.5% · 30yr · 1.5% tax · 5.0% vac · 8.0% maint · 8.0% mgmt
Financing live
Cash to close
- Down payment
- $48,499
- Closing costs
- $5,820
- Reserves months
- —
- Total cash needed
- —
Loan-product check · same deal, 3 products live
Conventional
25% down · 7.5% · 30yr
- Down + closing
- —
- Monthly P&I
- —
- Monthly cashflow
- —
- DSCR
- —
- Eligible?
- —
Personal DTI + credit; lowest rate.
DSCR
20% down · 8.5% · 30yr
- Down + closing
- —
- Monthly P&I
- —
- Monthly cashflow
- —
- DSCR
- —
- Eligible?
- —
No personal income docs; deal must DSCR.
Hard money
10% down · 12.0% · 12mo
- Down + closing
- —
- Monthly P&I
- —
- Monthly cashflow
- —
- DSCR
- —
- Eligible?
- —
Short-term bridge; refi at stabilization.
Rent comps 40 comps
| Address | Beds | Baths | Sqft | Rent | $/sqft | DOM | Units | Dist |
|---|---|---|---|---|---|---|---|---|
| 17220 Whitewater Ct Fort Myers Beach, FL | 2.0 | 1.5 | 1103 | $1,800 | $1.63 | 23d | 1 | 0.30mi |
| 158 Nanaimo Trl Fort Myers Beach, FL | 2.0 | 2.0 | 1200 | $6,570 | $5.47 | 23d | 1 | 0.32mi |
| 11451 Char Ann Dr Fort Myers, FL | 2.0 | 1.0 | 1300 | $1,950 | $1.50 | 2d | 1 | 0.40mi |
| 11110 Caravel Cir #201 Fort Myers, FL | 2.0 | 2.0 | 1050 | $3,500 | $3.33 | 23d | 1 | 0.66mi |
| 11140 Caravel Cir #109 Fort Myers, FL | 2.0 | 2.0 | 1050 | $4,200 | $4.00 | 23d | 1 | 0.70mi |
| 16580 Ginger Ln #3242 Fort Myers, FL | 2.0 | 2.0 | 982 | $1,800 | $1.83 | 23d | 1 | 0.74mi |
| 11540 Caravel Cir #3012 Fort Myers, FL | 2.0 | 2.0 | 1050 | $1,250 | $1.19 | 21d | 1 | 0.75mi |
| 11389 Summerwinds Ct Fort Myers, FL | 2.0 | 1.0 | 927 | $1,599 | $1.72 | 21d | 1 | 0.82mi |
| 16500 Kelly Cove Dr #2880 Fort Myers, FL | 2.0 | 2.0 | 1283 | $4,800 | $3.74 | 23d | 1 | 0.84mi |
| 11460 Summerwinds Ct Fort Myers, FL | 2.0 | 1.0 | 912 | $1,699 | $1.86 | 21d | 1 | 0.85mi |
| 11262 Summerwinds Ct Fort Myers, FL | 2.0 | 1.0 | 1049 | $1,699 | $1.62 | 21d | 1 | 0.88mi |
| 16470 Kelly Cove Dr #2850 Fort Myers, FL | 2.0 | 2.0 | 1216 | $5,000 | $4.11 | 23d | 1 | 0.88mi |
| 16470 Kelly Cove Dr Fort Myers, FL | 2.0 | 2.0 | 1214 | $3,550 | $2.92 | 3d | 2 | 0.88mi |
| 12150 Kelly Sands Way Fort Myers, FL | 2.0 | 2.0 | 1087 | $3,325 | $3.06 | 3d | 3 | 0.92mi |
| 12150 Kelly Sands Way Fort Myers, FL | 2.0 | 2.0 | 1087 | $4,700 | $4.32 | 23d | 2 | 0.92mi |
| 12250 Kelly Greens Blvd #57 Fort Myers, FL | 2.0 | 2.0 | 1336 | $1,999 | $1.50 | 23d | 1 | 0.92mi |
| 11041 Gulf Reflections Dr #305 Fort Myers, FL | 2.0 | 2.0 | 1500 | $1,800 | $1.20 | 23d | 1 | 0.92mi |
| 11021 Gulf Reflections Dr Fort Myers, FL | 2.0–3.0 | 2.0 | 1674 | $2,600 | $1.55 | 23d | 2 | 0.93mi |
| 11021 Gulf Reflections Dr #303 Fort Myers, FL | 2.0 | 2.0 | 1500 | $4,200 | $2.80 | 3d | 1 | 0.93mi |
| 11861 Caraway Ln #116 Fort Myers, FL | 2.0 | 2.0 | 1056 | $1,995 | $1.89 | 19d | 1 | 0.93mi |
| 16685 Lake Circle Dr Fort Myers, FL | 2.0 | 2.0 | 1228 | $2,000 | $1.63 | 23d | 2 | 0.96mi |
| 18014 San Carlos Blvd #44 Fort Myers Beach, FL | 2.0 | 2.5 | 1101 | $1,995 | $1.81 | 11d | 1 | 0.98mi |
| 16625 Lake Circle Dr #523 Fort Myers, FL | 2.0 | 2.0 | 1154 | $2,100 | $1.82 | 23d | 1 | 0.98mi |
| 12171 Kelly Sands Way #1577 Fort Myers, FL | 2.0 | 2.0 | 1160 | $4,500 | $3.88 | 23d | 1 | 1.01mi |
| 16635 Lake Circle Dr Fort Myers, FL | 2.0 | 2.0 | 1277 | $2,150 | $1.68 | 16d | 2 | 1.03mi |
| 16645 Lake Circle Dr #732 Fort Myers, FL | 2.0 | 2.0 | 1154 | $4,000 | $3.47 | 23d | 1 | 1.03mi |
| 12621 Kelly Sands Way #305 Fort Myers, FL | 2.0 | 2.0 | 1106 | $5,000 | $4.52 | 23d | 1 | 1.17mi |
| 12540 Kelly Greens Blvd #331 Fort Myers, FL | 2.0 | 2.0 | 1440 | $2,100 | $1.46 | 23d | 1 | 1.19mi |
| 12396 Kelly Sands Way Fort Myers, FL | 2.0 | 2.0 | 1511 | $2,800 | $1.85 | 23d | 1 | 1.19mi |
| 12641 Kelly Sands Way #225 Fort Myers, FL | 2.0 | 2.0 | 1069 | $5,000 | $4.68 | 23d | 1 | 1.20mi |
| 16301 Kelly Woods Dr #205 Fort Myers, FL | 2.0 | 2.0 | 1336 | $5,000 | $3.74 | 23d | 1 | 1.26mi |
| 18068 San Carlos Blvd #514 Fort Myers Beach, FL | 2.0 | 2.5 | 1180 | $3,500 | $2.97 | 14d | 1 | 1.26mi |
| 16120 Dublin Cir Unit A Fort Myers, FL | 2.0 | 2.0 | 1517 | $1,550 | $1.02 | 23d | 1 | 1.33mi |
| 16252 Kelly Woods Dr Fort Myers, FL | 2.0 | 2.0 | 1515 | $6,000 | $3.96 | 23d | 1 | 1.35mi |
| 16361 Dublin Cir #203 Fort Myers, FL | 2.0 | 2.0 | 892 | $1,700 | $1.91 | 2d | 1 | 1.36mi |
| 16001 Amberwood Lake Ct #1 Fort Myers, FL | 2.0 | 2.5 | 1060 | $2,100 | $1.98 | 23d | 1 | 1.38mi |
| 11601 Navarro Way #2102 Fort Myers, FL | 2.0 | 2.0 | 1378 | $4,500 | $3.27 | 23d | 1 | 1.46mi |
| 15773 Beachcomber Ave Unit 1264830P Fort Myers, FL | 3.0 | 2.0 | 1496 | $3,133 | $2.09 | 14d | 1 | 1.46mi |
| 11701 Olivetti Ln Unit 1545836P Fort Myers, FL | 3.0 | 2.0 | 1388 | $4,214 | $3.04 | 14d | 1 | 1.47mi |
| 11701 Olivetti Ln Unit 210 Fort Myers, FL | 2.0 | 2.0 | 1305 | $4,500 | $3.45 | 23d | 1 | 1.48mi |
Listing history 8 events
-
2026-06-17days on market $193,995 Active 96 DOM
-
2026-06-16days on market $193,995 Active 95 DOM
-
2026-06-16days on market $193,995 Active 94 DOM
-
2026-06-13days on market $193,995 Active 92 DOM
-
2026-06-09days on market $193,995 Active 88 DOM
-
2026-06-07days on market $193,995 Active 86 DOM
-
2026-06-01days on market $193,995 Active 80 DOM
-
2026-06-01days on market $193,995 Active 79 DOM
ⓘ Source: listings_history table (triggers on properties + properties_extension) + one-shot
backfill from property_details.listing_events for pre-trigger history.
Nearby sold comps map
Loading sold comps map…
Walkable amenities ~0.75 mi
Loading nearby amenities…
Taxation est. · year 1
- Rental income
- $32,450
- − Mortgage interest
- −$10,867
- − Property taxes
- −$2,910
- − Insurance
- −$970
- − Repairs & maintenance
- −$2,596
- − Management
- −$2,596
- − Depreciation
- −$5,643
- Taxable income
- $6,868
- Est. tax owed @ 24.0%
- −$1,648
- After-tax cash flow
- $7,899/yr
For passive investors: Depreciation is non-cash, so a rental often shows a tax loss while cash-flowing — sheltering income. Rental losses are passive: they offset passive income freely, and up to $25,000/yr can offset ordinary (W-2) income if you actively participate and your MAGI is under $100k (phasing out to $0 by $150k); unused losses carry forward. On sale, claimed depreciation is recaptured at up to 25%, and gains may owe capital-gains tax (a 1031 exchange can defer both). Figures are a year-1 estimate at your 24.0% rate — not tax advice; consult a CPA.
Condition & rehab AI · 14 photos
This brand-new, 1,393-square-foot home in Fort Myers Beach offers modern luxury and coastal relaxation. The interior is pristine, and the exterior is well-maintained, making it an excellent investment.
Value-add opportunities
- Both Painting the exterior siding — Enhances curb appeal and can increase both resale and rental value.
- Both Landscaping the front yard — Improves curb appeal and can increase both resale and rental value.
Renovation cost estimate screening
Value-add ROI direction
- Both Painting the exterior siding — Enhances curb appeal and can increase both resale and rental value. ↑
- Both Landscaping the front yard — Improves curb appeal and can increase both resale and rental value. ↑
ⓘ Cost ranges are severity-bucket heuristics (US national rule-of-thumb). Get contractor quotes + a written scope before underwriting a rehab budget.
Schools (NCES district)
- District
- Lee
- NCES district ID
- 1201080
- Math proficiency
- 47% ▼ -11.00%
- Reading proficiency
- 50% ▼ -4.00%
- Median HH income
- $49,518
- Composite
- 41.49/100
- National rank
- #3458
- State rank
- #42 of 73 in FL
Livability — Fort Myers Beach
- Score
- 69/100
- State rank
- #489
- US rank
- #8995
Category grades
Schools grade is shown separately in the Schools card above.
Census & demographics
- County
- Lee County · 788,662 people
- Metro
- Cape Coral-Fort Myers, FL
- Population (ZIP)
- 8,350
- Household income
- $79,018
- Rent vs Own
- Severe rent burden
- 145.0
Population outlook (Lee County) Hauer SSP2
- Today (2025)
- 871,946 people
- By 2030
- 955,468 · +9.6%
- By 2040
- 1,113,587 · +27.7%
- By 2050
- 1,256,891 · +44.1%
- By 2075
- 1,560,270 · +78.9%
- By 2100
- 1,726,848 · +98.0%
Race, ethnicity, and origin ACS 2023
- Neighborhood character
- Predominantly White (94%)
- Race & ethnicity
- White 94% Hispanic / Latino 4% Two or more races 4%
- Common ancestry
- Romanian 5% Portuguese 3% Lithuanian 3%
- Foreign-born
- 5% · Canada
- Languages at home
- 94% English-only · Spanish 2% German/W. Germanic 1% French/Haitian/Cajun 1%
Political lean MEDSL · Lee
- 2024 margin
- Strong R (+28.4) · D 35.5% · R 63.9%
- 2008→2024 swing
- -18.0pp toward R · 2008: -10.4pp · 2024: -28.4pp
- All cycles
- 2024: R+28.4 2020: R+19.2 2016: R+20.4 2012: R+16.6 2008: R+10.4
Not yet ingested
- Civics
- —
Market trends
- HPI YoY
- ▼ -194.12%
- Current HPI
- 837.37
- Rent YoY
- —
- Metro
- Cape Coral-Fort Myers, FL
- State GDP YoY
- ▲ 3.28%
- F500 in state
- 36
Industry mix (Fortune 500 HQ in FL)
| Industry | F500 HQs | Revenue |
|---|---|---|
| Industrial Technology | 2 | $29B |
|
||
| Insurance | 2 | $17B |
|
||
| Retail | 1 | $60B |
|
||
| Technology Distribution | 1 | $58B |
|
||
| Homebuilding | 1 | $35B |
|
||
| Technology Manufacturing | 1 | $35B |
|
||
Cash-flow waterfall
monthlySold comps — $/sqft
last 12 mo · ≤1 miLoading sold comps…