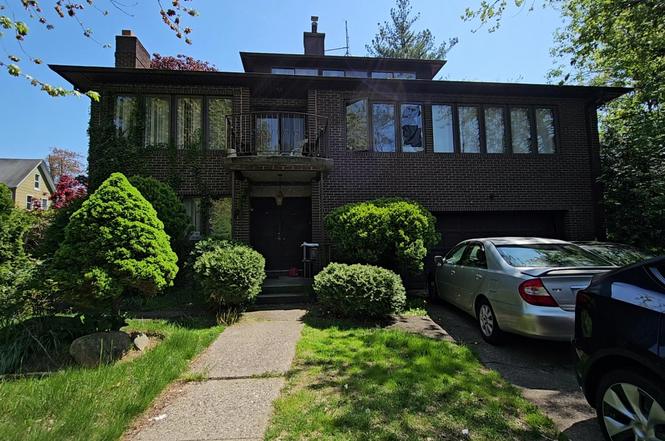
249-14 38th Ave · New York, NY
Flood risk 3/10 · Minor
- FEMA flood zone
- X (shaded)
- Chance of flooding over 30 yrs
- 0.1%
- Est. flood insurance / yr
- $507 – $1,088
Fire risk 1/10 · Minimal
- Est. fire insurance / yr
- $691 – $1,283
Heat risk 6/10 · Moderate
- Hot days now (above 97°F)
- 7 days/yr
- Hot days in 30 yrs
- 15 days/yr
Wind risk 6/10 · Moderate
- Chance of severe wind over 30 yrs
- 27.0%
Air-quality risk 4/10 · Minor
- Unhealthy air days now
- 6 days/yr
- Unhealthy air days in 30 yrs
- 7 days/yr
Risk factors via First Street. Map © Google.
Why this score? — see what drove the C+ grade
The composite is a weighted blend of 9 inputs, each scored 0–100. Each bar is that input's sub-score; the figure is the points it added to the 100-point composite (weight × sub-score).
- Cash flow +25.3/30.0
- DSCR +8.3/10.0
- ARV discount +7.5/15.0
- 1% rule +7.4/10.0
- Schools +5.0/10.0
- Livability +3.8/5.0
- Rent growth +2.5/5.0
- Condition / age +2.5/5.0
- Appreciation +0.0/10.0
$525,000
🖨 Deal sheet 📄 Offer letter ✓ Due diligence
Listing remarks
Beautiful single-family home in Little Neck. Offers 4 bedrooms and 2 full bathrooms with a living room, dining room, and kitchen, no basement.
Key facts
- 3,185 sq ft lot
- 2 garage spots
- Built 1985
Neighborhood map
What this means for you Summary
Snapshot
- This is a 4-bed/2.0-bath single-family listed at $525k.
Deal economics
- At list price, monthly cash flow is $1k ($14k/yr) — positive.
- The deal already cash-flows at list — no discount required.
- Meets the 1% rule at list price ($7k rent vs $525k).
- Cap rate 9.0% vs local median 2.6% in New York — top-decile yield for the area; either an underpriced asset or a hidden risk that comps aren't pricing in. Stress-test before assuming the spread holds.
Location & tenants
- Location reads 75/100 on livability (#268 in NY, #4,188 nationally) — a middle-class / working-renter tenant base. Strengths: amenities A+, commute A+, health & safety A; Watch: crime F, cost of living F.
- Market conditions: 47 active listings in the ZIP; 7 comparable units currently listed for rent nearby; rentals at typical pace (median 21d on market — plan ~3-4 weeks tenant-placement turnaround); high-income renter base; 5,302 units permitted in Queens County in 2024 (4,918 in 5+ unit buildings).
- At $6,518/mo this rent would consume 63% of the median local household income ($125k/yr) (locally 262% of renters already pay >50% of income on rent) — very limited rent-growth headroom before tenants either downsize or default.
Forward outlook
- Local home prices are declining (-3.0%/yr); year-one equity from $4k of loan paydown is wiped out by about $16k of value loss. Plan a longer hold.
- Queens County population projected at +16% by 2050 — long-run rental-demand tailwind backs the buy-and-hold thesis.
Negotiation context
- Only 1 days on market — expect competitive offers; lowballing is unlikely to land.
- 3 sale attempts since 9y ago with the ask held roughly flat each time — persistent listings suggest the price (not the market) is what's stuck; bring a comps-based counter.
Risks & watch-outs
- Climate carrying-cost: major wind risk, 27% chance of damaging wind over 30y; extreme-heat days projected 7→15/yr by 2055 (HVAC capex compounding) — expect insurance premiums to compound above CPI over the hold.
Questions for the listing agent
- Is there a deadline driving the sale (1031 exchange, divorce, estate, relocation)? That informs how much negotiation room exists.
- Schools are B-rated — typically a magnet for longer-tenancy family renters. What's the average tenant stay here, and is there a school-zone premium baked into asking?
- Crime grade is F in this area — have there been break-ins, vandalism, or insurance claims at this property in the last 3 years? What carrier currently insures it and at what premium?
- What's the average days-on-market for RENTAL listings here right now (not sales)? A rising rental-DOM trend means longer vacancies and softer asking-rent achievability than the comps imply.
- What's the recent tenant-quality profile in this submarket — average credit score on applications, eviction rate, late-payment / NSF rate, and stable-employment percentage? A property-management company in the area should have these aggregated.
- How much new for-sale + rental construction is in the pipeline within 1–3 miles? Heavy new supply typically softens prices + rents 12–24 months out; constrained supply supports both.
Investment metrics
- 1% rule
- 1.24% ✓
- Cap rate
- 9.01%
- Cash-on-cash
- 9.71%
- DSCR
- 1.43
- GRM
- 6.7
CMA / ARV
- ARV (on-the-fly)
- $1,478,080
- Comps found
- 12
Show comp detail 12 sales within ~0.75 mi
| Address | Dist | Beds/Ba | Sqft | Sold | Price | $/sf | Match |
|---|---|---|---|---|---|---|---|
| 350 Arleigh Rd | 0.16mi | 4/2.5 | 2,282 (-8%) | 11mo | $1,350,000 | $592 | 68 |
| 367 Grosvenor St | 0.35mi | 5/2.5 (+1) | 2,410 (-3%) | 6mo | $1,300,000 | $539 | 66 |
| 350 Park Ln | 0.14mi | 3/3.0 (-1) | 2,300 (-7%) | 10mo | $1,740,000 | $757 | 64 |
| 23 Nassau Rd | 0.43mi | 5/3.0 (+1) | 2,410 (-3%) | 4mo | $1,475,000 | $612 | 63 |
| 39 Nassau Rd | 0.37mi | 4/3.5 | 2,321 (-6%) | 8mo | $1,300,000 | $560 | 60 |
| 101 Forest Rd | 0.43mi | 5/3.5 (+1) | 2,424 (-2%) | 7mo | $1,500,000 | $619 | 59 |
| 24038 Poplar St | 0.46mi | 3/2.5 (-1) | 2,606 (+5%) | 5mo | $1,050,000 | $403 | 59 |
| 38-47 Douglaston Pkwy | 0.43mi | 3/3.0 (-1) | 2,350 (-5%) | 5mo | $1,275,000 | $543 | 58 |
| 73 Jayson Ave | 0.69mi | 5/3.0 (+1) | 2,499 (+1%) | 8mo | $1,490,000 | $596 | 51 |
| 39-35 233 St | 0.63mi | 3/3.5 (-1) | 2,336 (-6%) | 8mo | $1,240,000 | $531 | 44 |
| 39-27 233rd St | 0.62mi | 4/3.0 | 2,208 (-11%) | 8mo | $1,380,000 | $625 | 42 |
| 60 Jayson Ave | 0.72mi | 5/3.0 (+1) | 2,114 (-15%) | 7mo | $1,388,000 | $657 | 27 |
Match score weights: distance 35% · size 25% · config 20% · recency 20%. Top-matched comps best support the ARV.
Projected returns pro-forma
-3.0% appreciation · 3.0% rent growth · sell at horizon
- IRR
- -1.6%
- Equity multiple
- 0.94×
- Total profit
- $-9,005
- Equity at exit
- $78,279
- IRR
- 8.1%
- Equity multiple
- 1.62×
- Total profit
- $90,946
- Equity at exit
- $45,392
Cash invested: $147,000 (down + closing). Projections, not guarantees.
Landlord ↔ Tenant lean methodology
- Overall (CITY)
- 0 Strongly Tenant-Friendly
- State New York
- 15 Strongly Tenant-Friendly · D+10
- County
- — inherits STATE
- City New York
- 0 Strongly Tenant-Friendly · D+34
ZIP-level market 11363
- Home prices YoY
- -23.3%
- Active inventory
- 47
- Price-to-rent
- 6.7×
Monthly cashflow live
- Estimated rent
- $6,518 high interval (Pro) →
- Mortgage (P&I)
- −$2,753
- Tax from tax record
- −$988 /mo · $11,855/yr
- Insurance
- −$219
- HOA
- −$0
- Vacancy / Maint / Mgmt
- −$1,369
- Net cashflow
- $1,190
Break-even live
UW: 25.0% down · 7.5% · 30yr · 1.5% tax · 5.0% vac · 8.0% maint · 8.0% mgmt
Financing live
Cash to close
- Down payment
- $131,250
- Closing costs
- $15,750
- Reserves months
- —
- Total cash needed
- —
Loan-product check · same deal, 3 products live
Conventional
25% down · 7.5% · 30yr
- Down + closing
- —
- Monthly P&I
- —
- Monthly cashflow
- —
- DSCR
- —
- Eligible?
- —
Personal DTI + credit; lowest rate.
DSCR
20% down · 8.5% · 30yr
- Down + closing
- —
- Monthly P&I
- —
- Monthly cashflow
- —
- DSCR
- —
- Eligible?
- —
No personal income docs; deal must DSCR.
Hard money
10% down · 12.0% · 12mo
- Down + closing
- —
- Monthly P&I
- —
- Monthly cashflow
- —
- DSCR
- —
- Eligible?
- —
Short-term bridge; refi at stabilization.
Rent comps 7 comps
| Address | Beds | Baths | Sqft | Rent | $/sqft | DOM | Units | Dist |
|---|---|---|---|---|---|---|---|---|
| 2 Amherst Rd E Great Neck, NY | 4.0 | 3.5 | 2607 | $7,500 | $2.88 | 1d | 1 | 0.72mi |
| 31 South Dr Unit NA Great Neck, NY | 3.0 | 2.0 | 1900 | $5,800 | $3.05 | 20d | 1 | 0.82mi |
| 60 Highland Pl Great Neck, NY | 5.0 | 3.0 | 1949 | $6,000 | $3.08 | 1d | 1 | 0.87mi |
| 18 Pond Park Rd Great Neck, NY | 4.0 | 4.5 | 2894 | $10,800 | $3.73 | 17d | 1 | 1.00mi |
| 43-16 223rd St Unit 2nd Floor Flushing, NY | 3.0 | 2.0 | 3267 | $3,600 | $1.10 | 24d | 1 | 1.19mi |
| 123 Middle Neck Rd Unit 304-5 Great Neck, NY | 3.0 | 2.5 | 2915 | $8,500 | $2.92 | 43d | 1 | 1.26mi |
| 245-80 61st Ave Unit 2 Fl Flushing, NY | 3.0 | 1.0 | 1703 | $4,000 | $2.35 | 24d | 1 | 1.42mi |
Listing history 11 events
-
2025-09-26status Pending
-
2025-09-26price $525,000
-
2025-09-25status Active
-
2025-06-27price $749,000
-
2025-06-08price $525,000
-
2025-05-27price $1,625,000
-
2025-05-20$525,000 Active
-
2018-05-12historical
-
2017-09-30$595,000 New
-
1987-08-07soldstatus $480,000
-
1986-09-23soldstatus $321,000
ⓘ Source: listings_history table (triggers on properties + properties_extension) + one-shot
backfill from property_details.listing_events for pre-trigger history.
Tax reassessment forecast NY · Partial reset (capped growth)
- Current annual tax
- $11,855 · $988/mo
- Projected year-2 tax
- $11,855 · $988/mo
- Expected delta
- $0/yr ($0/mo · 0.0%)
ⓘ Screening estimate from a state-policy table — verify with the county assessor before closing.
Climate risk First Street
- Flood 3/10 Moderate FEMA zone X (shaded) · 10% chance over 30 yrs
- Wildfire 1/10 Low
- Heat 6/10 Major 7 d/yr ≥97°F today · 15 d/yr by 30 yrs out
- Wind 6/10 Major 27% chance of damaging wind over 30 yrs
- Air quality 4/10 Moderate 6 unhealthy d/yr today · 7 by 30 yrs out
Nearby sold comps map
Loading sold comps map…
Walkable amenities ~0.75 mi
Loading nearby amenities…
Taxation est. · year 1
- Rental income
- $78,219
- − Mortgage interest
- −$29,408
- − Property taxes
- −$11,855
- − Insurance
- −$2,625
- − Repairs & maintenance
- −$6,257
- − Management
- −$6,257
- − Depreciation
- −$15,273
- Taxable income
- $6,543
- Est. tax owed @ 24.0%
- −$1,570
- After-tax cash flow
- $12,705/yr
For passive investors: Depreciation is non-cash, so a rental often shows a tax loss while cash-flowing — sheltering income. Rental losses are passive: they offset passive income freely, and up to $25,000/yr can offset ordinary (W-2) income if you actively participate and your MAGI is under $100k (phasing out to $0 by $150k); unused losses carry forward. On sale, claimed depreciation is recaptured at up to 25%, and gains may owe capital-gains tax (a 1031 exchange can defer both). Figures are a year-1 estimate at your 24.0% rate — not tax advice; consult a CPA.
Schools (NCES district)
No district data.
Livability — New York
- Score
- 75/100
- State rank
- #268
- US rank
- #4188
Category grades
Schools grade is shown separately in the Schools card above.
Census & demographics
- Census place
- New York, NY
- County
- Queens County · 1,914,869 people
- City population
- 7,731,280
- Metro
- New York-Newark-Jersey City, NY-NJ-PA
- Population (ZIP)
- 7,223
- Household income
- $125,015
- Rent vs Own
- Severe rent burden
- 262.0
Population outlook (Queens County) Hauer SSP2
- Today (2025)
- 2,546,320 people
- By 2030
- 2,643,059 · +3.8%
- By 2040
- 2,815,563 · +10.6%
- By 2050
- 2,944,423 · +15.6%
- By 2075
- 3,123,338 · +22.7%
- By 2100
- 3,098,688 · +21.7%
Race, ethnicity, and origin ACS 2023
- Neighborhood character
- Diverse neighborhood (Simpson 0.61)
- Race & ethnicity
- White 54% Asian 29% Hispanic / Latino 12% Two or more races 12% Native American 1%
- Hispanic origin (detail)
- Puerto Rican 1% Cuban 1% Dominican 2%
- Common ancestry
- Romanian 4% Italian 3% Scotch-Irish 2%
- Foreign-born
- 29% · China, Canada, South Korea
- Languages at home
- 56% English-only · Chinese 15% Spanish 10% Other Indo-European 8%
Political lean MEDSL · Queens
- 2024 margin
- Strong D (+24.6) · D 62.3% · R 37.7%
- 2008→2024 swing
- -26.2pp toward R · 2008: 50.8pp · 2024: 24.6pp
- All cycles
- 2024: D+24.6 2020: D+45.2 2016: D+53.4 2012: D+58.5 2008: D+50.8
Not yet ingested
- Civics
- —
Market trends
- HPI YoY
- ▼ -71.14%
- Current HPI
- 234.1655
- Rent YoY
- —
- Metro
- New York-Newark-Jersey City, NY-NJ-PA
- State GDP YoY
- ▲ 2.60%
- F500 in state
- 92
Industry mix (Fortune 500 HQ in NY)
| Industry | F500 HQs | Revenue |
|---|---|---|
| Financial Services | 10 | $950B |
|
||
| Consumer Goods | 9 | $162B |
|
||
| Insurance | 4 | $225B |
|
||
| Telecommunications | 2 | $144B |
|
||
| Pharmaceuticals | 2 | $112B |
|
||
| Media / Entertainment | 2 | $69B |
|
||
Price history
+63.6% since first listed11 events — show timeline
- 2025-09-26 Pending — OneKey® MLS as Distributed by MLS Grid
- 2025-09-26 Price Changed $525,000 OneKey® MLS as Distributed by MLS Grid
- 2025-09-25 Relisted — OneKey® MLS as Distributed by MLS Grid
- 2025-06-27 Price Changed $749,000 OneKey® MLS as Distributed by MLS Grid
- 2025-06-08 Price Changed $525,000 OneKey® MLS as Distributed by MLS Grid
- 2025-05-27 Price Changed $1,625,000 OneKey® MLS as Distributed by MLS Grid
- 2025-05-20 Listed $525,000 OneKey® MLS as Distributed by MLS Grid
- 2018-05-12 Listing Removed — OneKey® MLS as Distributed by MLS Grid
- 2017-09-30 Listed $595,000 OneKey® MLS as Distributed by MLS Grid
- 1987-08-07 Sold (Public Records) $480,000 Public Records
- 1986-09-23 Sold (Public Records) $321,000 Public Records
Property tax history
+5.3%/yrLatest (2025): $11,855 · -2.4% YoY. Source: county tax records.
Cash-flow waterfall
monthlySold comps — $/sqft
last 12 mo · ≤1 miLoading sold comps…