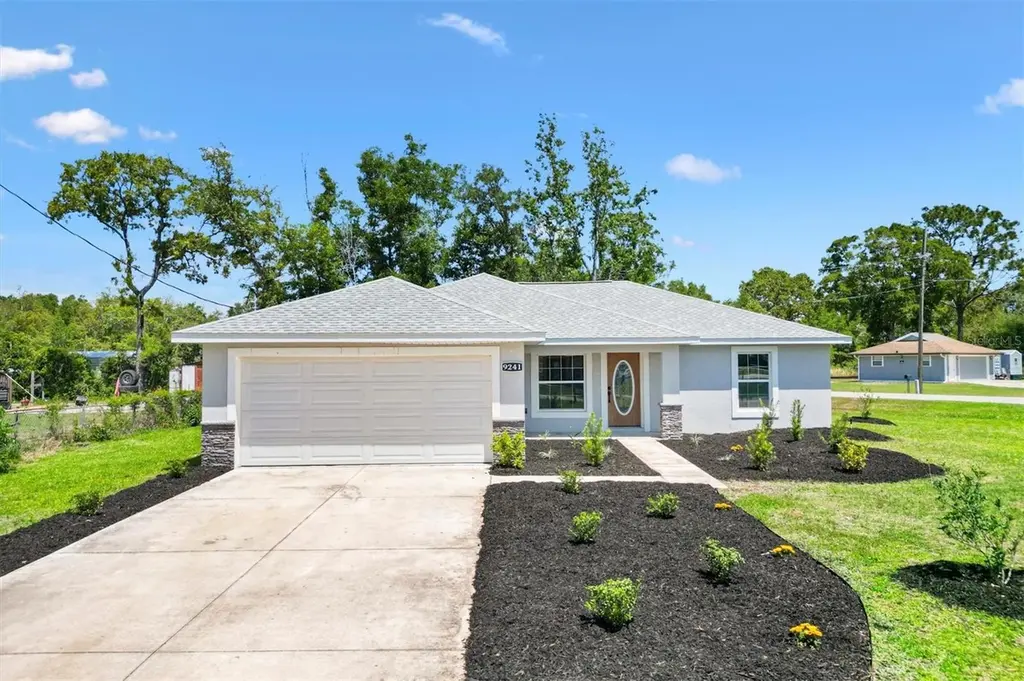
9241 SE 155th Pl · The Villages, FL
Flood risk 1/10 · Minimal
- FEMA flood zone
- X (unshaded)
- Chance of flooding over 30 yrs
- 0.0%
- Est. flood insurance / yr
- $507 – $1,088
Fire risk 2/10 · Minimal
- Est. fire insurance / yr
- $947 – $1,759
Heat risk 8/10 · Major
- Hot days now (above 109°F)
- 7 days/yr
- Hot days in 30 yrs
- 21 days/yr
Wind risk 9/10 · Severe
- Chance of severe wind over 30 yrs
- 99.0%
Air-quality risk 3/10 · Minor
- Unhealthy air days now
- 2 days/yr
- Unhealthy air days in 30 yrs
- 2 days/yr
Risk factors via First Street. Map © Google.
Why this score? — see what drove the D- grade
The composite is a weighted blend of 9 inputs, each scored 0–100. Each bar is that input's sub-score; the figure is the points it added to the 100-point composite (weight × sub-score).
- Cash flow +11.8/30.0
- ARV discount +8.9/15.0
- 1% rule +3.6/10.0
- Schools +3.6/10.0
- DSCR +3.5/10.0
- Livability +3.5/5.0
- Rent growth +2.5/5.0
- Condition / age +2.5/5.0
- Appreciation +0.0/10.0
$255,000
🖨 Deal sheet 📄 Offer letter ✓ Due diligence
Listing remarks
Under contract-accepting backup offers. MOVE-IN READY HOME AVAILABLE! Located in the family-friendly neighborhood of Orange Blossom Hills this 3BR/2BA home is within arm-lengths of The Villages, Ocala, shopping, dining, schools, and much more. Situated on a OVERSIZED . 25 acre CORNER lot this home offers you the freedom you have been wanting with NO HOA nor DEED RESTRICTIONS. Newly(2023) constructed of stucco and block you can rest assured you’ll have years of enjoyment without the headache of maintenance and cost. Featuring 1,514+/- sqft under air this 3BR/2BA home consists of an open floor plan that features a BONUS Florida room, tray/vaulted ceilings, tile/carpet flooring, a WHOLE
Key facts
- Oversized corner lot
- Newly constructed
- Irrigation system
Tags
Property features AI
Finance
- Other: Lot roughly 0.25 acre (about 81 x 133); Public records list living area as 1,511 and total building area as 2,031; Unfurnished; Zoned R1
Exterior
- Parking: Attached 2-car garage
- Utilities: Well water; Septic tank; Broadband/high-speed internet available; Cable available; Electricity connected
- Home design: Single family residence; One story; South-facing entry
- Construction: Block construction; Shingle roof; Block and slab foundation; Built on one level
- Exterior features: Corner lot; Other exterior features
Interior
- Kitchen: Dishwasher; Microwave; Range; Refrigerator
- Bedrooms: 3 bedrooms
- Flooring: Carpet; Ceramic tile
- Bathrooms: 2 full bathrooms
- Heating & cooling: Central heating; Central air conditioning
- Interior features: Ceiling fans; High ceilings; Open floor plan; Solid surface counters; Solid wood cabinets; Tray ceilings; Vaulted ceilings; Walk-in closets
- Laundry & utility: Inside laundry room
Neighborhood map
What this means for you Summary
Snapshot
- This is a 3-bed/2.0-bath single-family listed at $255k.
Deal economics
- At list price, monthly cash flow is $-69 ($-822/yr) — negative.
- To cash-flow at today's rent, offer at most $243k (4.7% below list).
- To meet the 1% rule (rent ≥ 1% of price), the offer needs to be $220k (13.6% below list).
- Recommended offer: $220k (13.6% below list) — sets the bar for 1% rule.
Location & tenants
- Location reads 70/100 on livability (#431 in FL) — a middle-class / working-renter tenant base. Strengths: schools A+, crime A+, housing A; Watch: amenities F, commute F, health & safety F.
- Marion (rural): math 42% / reading 43% proficiency, ranked #61 of 73 in FL (top 84%) — families likely to look elsewhere, expect single-tenant / working-renter base with shorter leases; 61% free/reduced lunch — lower-income household profile, screen leases tightly.
- Market conditions: 705 active listings in the ZIP; 11 comparable units currently listed for rent nearby; rentals at typical pace (median 21d on market — plan ~3-4 weeks tenant-placement turnaround); 7,071 units permitted in Marion County in 2024 (534 in 5+ unit buildings).
- This rent runs 40% of the median local income ($67k/yr) — at the standard rent-burdened threshold; future hikes will face affordability resistance.
Forward outlook
- Local home prices are declining (-3.0%/yr); year-one equity from $2k of loan paydown is wiped out by about $8k of value loss. Plan a longer hold.
- Marion County population projected at +13% by 2050 — modest demand growth; plan on rents tracking national, not racing it.
Negotiation context
- It's been on market 121 days — a 12% lower offer ($224k) is reasonable based on typical stale-listing flexibility.
- 4 sale attempts since 3y ago; this cycle's ask is 12682% above the opening price — seller raised mid-cycle; expect resistance to lowballs.
Risks & watch-outs
- Climate carrying-cost: severe wind risk, 99% chance of damaging wind over 30y; extreme-heat days projected 7→21/yr by 2055 (HVAC capex compounding) — expect insurance premiums to compound above CPI over the hold.
Questions for the listing agent
- What do current leases actually rent for vs. the listed asking? Can we see a recent rent roll and the last 12 months of T-12 income?
- It's been on market 121 days. Have you received any prior offers? Is the seller open to a 14% concession, seller financing, or rate buy-down credit?
- Why hasn't it sold? Are there any deal-killer items the seller is aware of (foundation, flood, title, zoning, code violations)?
- Is there a deadline driving the sale (1031 exchange, divorce, estate, relocation)? That informs how much negotiation room exists.
- Schools are A-rated — typically a magnet for longer-tenancy family renters. What's the average tenant stay here, and is there a school-zone premium baked into asking?
- The area grade is low — what's the realistic commute time and amenity access for the typical tenant pool here? Any planned neighborhood developments (good or bad) we should know about?
- What's the average days-on-market for RENTAL listings here right now (not sales)? A rising rental-DOM trend means longer vacancies and softer asking-rent achievability than the comps imply.
- What's the recent tenant-quality profile in this submarket — average credit score on applications, eviction rate, late-payment / NSF rate, and stable-employment percentage? A property-management company in the area should have these aggregated.
- How much new for-sale + rental construction is in the pipeline within 1–3 miles? Heavy new supply typically softens prices + rents 12–24 months out; constrained supply supports both.
Investment metrics
- 1% rule
- 0.86% ✗
- Cap rate
- 5.97%
- Cash-on-cash
- -1.15%
- DSCR
- 0.95
- GRM
- 9.6
CMA / ARV
- ARV (on-the-fly)
- $262,914
- Comps found
- 9
Show comp detail 9 sales within ~0.75 mi
| Address | Dist | Beds/Ba | Sqft | Sold | Price | $/sf | Match |
|---|---|---|---|---|---|---|---|
| 9270 SE 157th Pl | 0.25mi | 3/3.0 | 1,630 (+8%) | 1mo | $282,999 | $174 | 70 |
| 9085 SE 156th St | 0.18mi | 3/3.0 | 1,609 (+6%) | 20mo | $236,000 | $147 | 60 |
| 9319 SE 157th St | 0.21mi | 3/2.0 | 1,710 (+13%) | 13mo | $295,000 | $173 | 58 |
| 8995 SE 156th St | 0.26mi | 3/2.5 | 1,615 (+7%) | 20mo | $260,000 | $161 | 57 |
| 15643 SE 90th Ct | 0.24mi | 3/2.5 | 1,648 (+9%) | 23mo | $375,000 | $228 | 52 |
| 9365 SE 152nd Ln | 0.28mi | 3/2.0 | 1,377 (-9%) | 24mo | $288,000 | $209 | 52 |
| 15828 SE 98th Ter | 0.71mi | 3/2.0 | 1,349 (-11%) | 12mo | $287,000 | $213 | 39 |
| 8660 SE 159th Pl | 0.72mi | 4/2.5 (+1) | 1,716 (+14%) | 8mo | $205,000 | $119 | 30 |
| 8880 SE 161st St | 0.69mi | 3/2.0 | 1,729 (+14%) | 24mo | $335,000 | $194 | 24 |
Match score weights: distance 35% · size 25% · config 20% · recency 20%. Top-matched comps best support the ARV.
Projected returns pro-forma
-3.0% appreciation · 3.0% rent growth · sell at horizon
- IRR
- -18.2%
- Equity multiple
- 0.36×
- Total profit
- $-45,624
- Equity at exit
- $38,021
- IRR
- -10.4%
- Equity multiple
- 0.37×
- Total profit
- $-45,098
- Equity at exit
- $22,048
Cash invested: $71,400 (down + closing). Projections, not guarantees.
Landlord ↔ Tenant lean methodology
- Overall (STATE)
- 87 Strongly Landlord-Friendly
- State Florida
- 87 Strongly Landlord-Friendly · R+3
- County
- — inherits STATE
- City
- — inherits STATE
ZIP-level market 34491
- Home prices YoY
- -35.0%
- Active inventory
- 705
- Price-to-rent
- 9.6×
Monthly cashflow live
- Estimated rent
- $2,202 high interval (Pro) →
- Mortgage (P&I)
- −$1,337
- Tax from tax record
- −$365 /mo · $4,376/yr
- Insurance
- −$106
- HOA
- −$0
- Vacancy / Maint / Mgmt
- −$462
- Net cashflow
- $-69
Break-even live
UW: 25.0% down · 7.5% · 30yr · 1.5% tax · 5.0% vac · 8.0% maint · 8.0% mgmt
Financing live
Cash to close
- Down payment
- $63,750
- Closing costs
- $7,650
- Reserves months
- —
- Total cash needed
- —
Loan-product check · same deal, 3 products live
Conventional
25% down · 7.5% · 30yr
- Down + closing
- —
- Monthly P&I
- —
- Monthly cashflow
- —
- DSCR
- —
- Eligible?
- —
Personal DTI + credit; lowest rate.
DSCR
20% down · 8.5% · 30yr
- Down + closing
- —
- Monthly P&I
- —
- Monthly cashflow
- —
- DSCR
- —
- Eligible?
- —
No personal income docs; deal must DSCR.
Hard money
10% down · 12.0% · 12mo
- Down + closing
- —
- Monthly P&I
- —
- Monthly cashflow
- —
- DSCR
- —
- Eligible?
- —
Short-term bridge; refi at stabilization.
Rent comps 11 comps
| Address | Beds | Baths | Sqft | Rent | $/sqft | DOM | Units | Dist |
|---|---|---|---|---|---|---|---|---|
| 9393 SE 158th Pl Summerfield, FL | 4.0 | 3.0 | 1990 | $2,500 | $1.26 | 21d | 1 | 0.34mi |
| 8721 SE 157th St Summerfield, FL | 3.0 | 2.0 | 1236 | $1,650 | $1.33 | 21d | 1 | 0.54mi |
| 9871 SE 161st Lane Rd Unit 0 Summerfield, FL | 4.0 | 2.0 | 1827 | $2,200 | $1.20 | 21d | 1 | 0.76mi |
| 9195 SE 163rd St Summerfield, FL | 3.0 | 2.0 | 1410 | $1,800 | $1.28 | 21d | 1 | 0.76mi |
| 16475 SE 89th Ter Summerfield, FL | 4.0 | 3.0 | 1942 | $2,700 | $1.39 | 13d | 1 | 0.93mi |
| 8364 SE 158th Pl Summerfield, FL | 3.0 | 2.0 | 1374 | $2,000 | $1.46 | 13d | 1 | 0.93mi |
| 8352 SE 158th Pl Summerfield, FL | 3.0 | 2.0 | 1232 | $2,000 | $1.62 | 13d | 1 | 0.94mi |
| 10326 SE 162nd Place Rd Summerfield, FL | 3.0 | 2.0 | 1419 | $2,300 | $1.62 | 13d | 1 | 1.29mi |
| 9523 SE 168th Maplesong Ln The Villages, FL | 3.0 | 2.0 | 1265 | $1,975 | $1.56 | 21d | 1 | 1.36mi |
| 8198 SE 164th Pl Summerfield, FL | 3.0 | 1.5 | 1965 | $2,650 | $1.35 | 21d | 1 | 1.40mi |
| 16962 SE 94th Sunnybrook Cir The Villages, FL | 2.0 | 2.0 | 1160 | $2,000 | $1.72 | 21d | 1 | 1.40mi |
Listing history 15 events
-
2026-05-20status Active
-
2026-05-11historical $1,900
-
2026-05-11status Pending
-
2026-04-21price $255,000
-
2026-04-14price $1,900
-
2026-04-13price $264,500
-
2026-03-19price $264,900
-
2026-03-08price $1,950
-
2026-02-20price $269,900
-
2026-02-06$1,995
-
2026-01-19$274,900 Active
-
2025-05-02soldstatus $287,571
-
2023-03-25price $292,000
-
2023-02-20$295,000 Active
-
2005-11-01soldstatus $37,000
ⓘ Source: listings_history table (triggers on properties + properties_extension) + one-shot
backfill from property_details.listing_events for pre-trigger history.
Tax reassessment forecast FL · Resets to sale price
- Current annual tax
- $4,376 · $365/mo
- Projected year-2 tax
- $4,376 · $365/mo
- Expected delta
- $0/yr ($0/mo · 0.0%)
ⓘ Screening estimate from a state-policy table — verify with the county assessor before closing.
Climate risk First Street
- Flood 1/10 Low FEMA zone X (unshaded) · 0% chance over 30 yrs
- Wildfire 2/10 Low
- Heat 8/10 Severe 7 d/yr ≥109°F today · 21 d/yr by 30 yrs out
- Wind 9/10 Extreme 99% chance of damaging wind over 30 yrs
- Air quality 3/10 Moderate 2 unhealthy d/yr today · 2 by 30 yrs out
Nearby sold comps map
Loading sold comps map…
Walkable amenities ~0.75 mi
Loading nearby amenities…
Taxation est. · year 1
- Rental income
- $26,426
- − Mortgage interest
- −$14,284
- − Property taxes
- −$4,376
- − Insurance
- −$1,275
- − Repairs & maintenance
- −$2,114
- − Management
- −$2,114
- − Depreciation
- −$7,418
- Taxable loss
- −$5,156
- Est. tax savings @ 24.0%
- +$1,237
- After-tax cash flow
- $415/yr
For passive investors: Depreciation is non-cash, so a rental often shows a tax loss while cash-flowing — sheltering income. Rental losses are passive: they offset passive income freely, and up to $25,000/yr can offset ordinary (W-2) income if you actively participate and your MAGI is under $100k (phasing out to $0 by $150k); unused losses carry forward. On sale, claimed depreciation is recaptured at up to 25%, and gains may owe capital-gains tax (a 1031 exchange can defer both). Figures are a year-1 estimate at your 24.0% rate — not tax advice; consult a CPA.
Schools (NCES district)
- District
- Marion
- NCES district ID
- 1201260
- Math proficiency
- 42% ▼ -7.00%
- Reading proficiency
- 43% ▼ -4.00%
- Median HH income
- $40,015
- Composite
- 35.61/100
- National rank
- #4890
- State rank
- #61 of 73 in FL
Livability — The Villages
- Score
- 70/100
- State rank
- #431
- US rank
- #7363
Category grades
Schools grade is shown separately in the Schools card above.
Census & demographics
- County
- Marion County · 315,796 people
- City population
- 83,973
- Metro
- Ocala, FL
- Population (ZIP)
- 33,318
- Household income
- $66,679
- Rent vs Own
- Severe rent burden
- 256.0
Population outlook (Marion County) Hauer SSP2
- Today (2025)
- 365,905 people
- By 2030
- 376,768 · +3.0%
- By 2040
- 396,555 · +8.4%
- By 2050
- 412,723 · +12.8%
- By 2075
- 446,090 · +21.9%
- By 2100
- 436,193 · +19.2%
Race, ethnicity, and origin ACS 2023
- Neighborhood character
- Predominantly White (77%)
- Race & ethnicity
- White 77% Hispanic / Latino 14% Two or more races 9% Black 4% Asian 2%
- Hispanic origin (detail)
- Mexican 3% Puerto Rican 6% Cuban 1%
- Common ancestry
- Lithuanian 3% Slovak 2% Romanian 2%
- Foreign-born
- 8% · Canada, Vietnam, Jamaica
- Languages at home
- 85% English-only · Spanish 11% Vietnamese 1% French/Haitian/Cajun 1%
Political lean MEDSL · Marion
- 2024 margin
- Solid R (+31.6) · D 33.8% · R 65.5%
- 2008→2024 swing
- -20.0pp toward R · 2008: -11.6pp · 2024: -31.6pp
- All cycles
- 2024: R+31.6 2020: R+25.9 2016: R+26.2 2012: R+16.2 2008: R+11.6
Not yet ingested
- Civics
- —
Market trends
- HPI YoY
- ▼ -107.67%
- Current HPI
- 200.0792
- Rent YoY
- —
- Metro
- Ocala, FL
- State GDP YoY
- ▲ 3.28%
- F500 in state
- 36
Industry mix (Fortune 500 HQ in FL)
| Industry | F500 HQs | Revenue |
|---|---|---|
| Industrial Technology | 2 | $29B |
|
||
| Insurance | 2 | $17B |
|
||
| Retail | 1 | $60B |
|
||
| Technology Distribution | 1 | $58B |
|
||
| Homebuilding | 1 | $35B |
|
||
| Technology Manufacturing | 1 | $35B |
|
||
Price history
-94.9% since first listed15 events — show timeline
- 2026-05-20 Relisted — Stellar MLS as Distributed by MLS Grid
- 2026-05-11 Rental Removed $1,900 STELLARMLS
- 2026-05-11 Pending — Stellar MLS as Distributed by MLS Grid
- 2026-04-21 Price Changed $255,000 Stellar MLS as Distributed by MLS Grid
- 2026-04-14 Price Changed $1,900 STELLARMLS
- 2026-04-13 Price Changed $264,500 Stellar MLS as Distributed by MLS Grid
- 2026-03-19 Price Changed $264,900 Stellar MLS as Distributed by MLS Grid
- 2026-03-08 Price Changed $1,950 STELLARMLS
- 2026-02-20 Price Changed $269,900 Stellar MLS as Distributed by MLS Grid
- 2026-02-06 Listed for Rent $1,995 STELLARMLS
- 2026-01-19 Listed $274,900 Stellar MLS as Distributed by MLS Grid
- 2025-05-02 Sold (Public Records) $287,571 Public Records
- 2023-03-25 Price Changed $292,000 Stellar MLS as Distributed by MLS Grid
- 2023-02-20 Listed $295,000 Stellar MLS as Distributed by MLS Grid
- 2005-11-01 Sold (Public Records) $37,000 Public Records
Property tax history
+38.6%/yrLatest (2025): $4,376 · +4.8% YoY. Source: county tax records.
Cash-flow waterfall
monthlySold comps — $/sqft
last 12 mo · ≤1 miLoading sold comps…