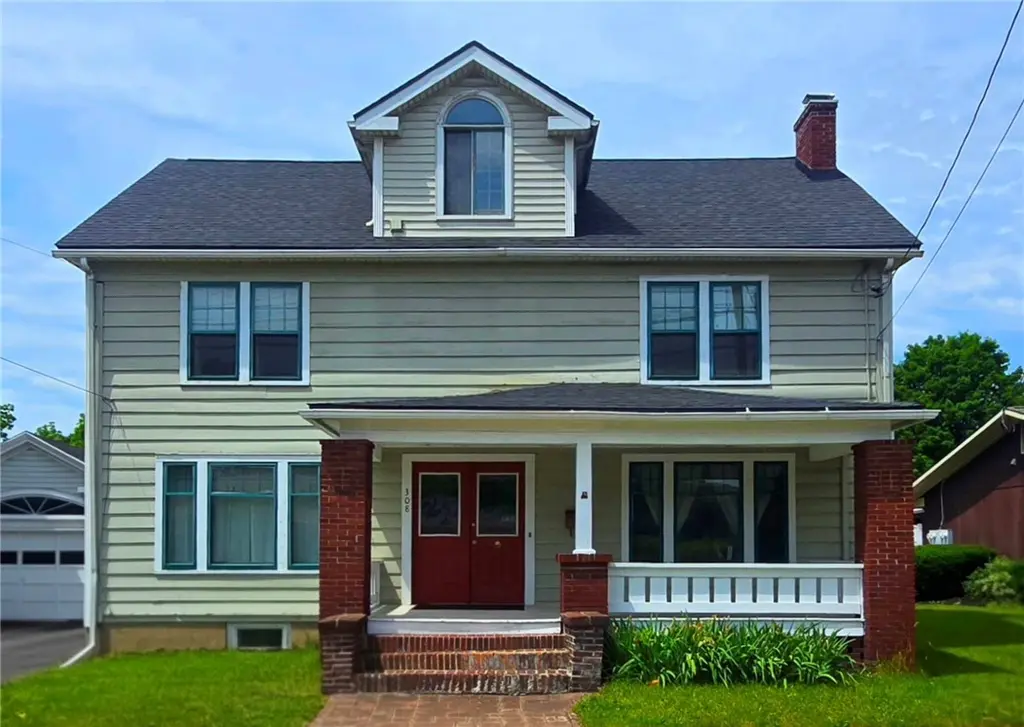
308 S Main St · Horseheads, NY
Flood risk 1/10 · Minimal
- FEMA flood zone
- X
- Chance of flooding over 30 yrs
- 0.0%
- Est. flood insurance / yr
- $473 – $860
Fire risk 3/10 · Minor
- Est. fire insurance / yr
- $691 – $1,283
Heat risk 3/10 · Minor
- Hot days now (above 96°F)
- 7 days/yr
- Hot days in 30 yrs
- 16 days/yr
Wind risk 1/10 · Minimal
- Chance of severe wind over 30 yrs
- 1.0%
Air-quality risk 2/10 · Minimal
- Unhealthy air days now
- 0 days/yr
- Unhealthy air days in 30 yrs
- 1 days/yr
Risk factors via First Street. Map © Google.
Why this score? — see what drove the C+ grade
The composite is a weighted blend of 9 inputs, each scored 0–100. Each bar is that input's sub-score; the figure is the points it added to the 100-point composite (weight × sub-score).
- Cash flow +30.0/30.0
- DSCR +10.0/10.0
- 1% rule +9.1/10.0
- Schools +4.5/10.0
- Livability +3.5/5.0
- Rent growth +2.5/5.0
- Condition / age +2.5/5.0
- ARV discount +2.3/15.0
- Appreciation +0.0/10.0
$320,000
🖨 Deal sheet 📄 Offer letter ✓ Due diligence
Listing remarks MLS
HUD home. Selling 'as-is'. Buyer to verify all information including zoning and C of O ordinance. Streamline K eligible FHA financing. Case #372-368575
Key facts
- New boiler
- Quartz countertops
- Brand new roof
Tags
Property features AI
Exterior
- Parking: No garage
- Utilities: Cable available; High-speed internet available; Public water (connected); Sewer connected
- Home design: Two-story residence; Resale property
- Construction: Brick and vinyl siding; Poured foundation; Existing (previously built)
- Exterior features: Blacktop driveway; Covered patio/porch; Patio; Porch; Shed(s); Exterior storage
Interior
- Kitchen: Country kitchen; Quartz counters; Gas oven; Gas range; Microwave; Dishwasher; Refrigerator
- Bedrooms: Convertible bedroom (counts among total rooms)
- Flooring: Laminate; Luxury vinyl; Varies
- Bathrooms: 4 full bathrooms; 1 main-level bathroom
- Heating & cooling: Gas heating; Baseboard heating; Hot water heating
- Interior features: Attic; Separate/formal dining room; Separate/formal living room; Home office; Country kitchen; Quartz counters; Storage; Convertible bedroom; Primary bedroom with bath; Walk-out basement access; One fireplace
- Laundry & utility: Main-level laundry; Washer; Dryer; Gas water heater
Neighborhood map
What this means for you Summary
Snapshot
- This is a 4-bed/3.0-bath single-family listed at $320k.
Deal economics
- At list price, monthly cash flow is $1k ($17k/yr) — positive.
- The deal already cash-flows at list — no discount required.
- Meets the 1% rule at list price ($4k rent vs $320k).
- Cap rate 11.5% vs local median 5.1% in Horseheads — top-decile yield for the area; either an underpriced asset or a hidden risk that comps aren't pricing in. Stress-test before assuming the spread holds.
Location & tenants
- Location reads 69/100 on livability (#494 in NY) — a middle-class / working-renter tenant base. Strengths: housing A+, cost of living A, schools B; Watch: crime D+, health & safety D, amenities F.
- Horseheads Central School District (suburban): math 44% / reading 58% proficiency, ranked #347 of 590 in NY (top 59%) — acceptable for families but not a draw, mixed tenant base, ~2y average lease.
- Market conditions: 92 active listings in the ZIP; 1 comparable units currently listed for rent nearby; 91 units permitted in Chemung County in 2024 (63 in 5+ unit buildings).
Forward outlook
- Local home prices are declining (-3.0%/yr); year-one equity from $2k of loan paydown is wiped out by about $10k of value loss. Plan a longer hold.
- Chemung County population projected at -17% by 2050 — secular population decline; favor cash flow + early exit over multi-decade hold.
- At projected returns (-3.0% appreciation + 3.0% rent growth), your $90k cash investment doubles in ~7 years — after that, you're playing with house money.
Negotiation context
- Only 7 days on market — expect competitive offers; lowballing is unlikely to land.
- 4 sale attempts since 19y ago with the ask held roughly flat each time — persistent listings suggest the price (not the market) is what's stuck; bring a comps-based counter.
- Current owner paid $122k; list at $320k implies a 162% gain — meaningful room to come down on a strong offer.
Risks & watch-outs
- Watch-outs: built in 1920 — expect roof / HVAC / electrical / plumbing capex.
Questions for the listing agent
- Built in 1920 — when were the roof, HVAC, electrical panel, plumbing, and water heater last replaced?
- Is there a deadline driving the sale (1031 exchange, divorce, estate, relocation)? That informs how much negotiation room exists.
- Schools are B-rated — typically a magnet for longer-tenancy family renters. What's the average tenant stay here, and is there a school-zone premium baked into asking?
- Crime grade is D in this area — have there been break-ins, vandalism, or insurance claims at this property in the last 3 years? What carrier currently insures it and at what premium?
- What's the average days-on-market for RENTAL listings here right now (not sales)? A rising rental-DOM trend means longer vacancies and softer asking-rent achievability than the comps imply.
- What's the recent tenant-quality profile in this submarket — average credit score on applications, eviction rate, late-payment / NSF rate, and stable-employment percentage? A property-management company in the area should have these aggregated.
- How much new for-sale + rental construction is in the pipeline within 1–3 miles? Heavy new supply typically softens prices + rents 12–24 months out; constrained supply supports both.
Investment metrics
- 1% rule
- 1.41% ✓
- Cap rate
- 11.50%
- Cash-on-cash
- 18.58%
- DSCR
- 1.83
- GRM
- 5.9
CMA / ARV
- ARV (on-the-fly)
- $287,105
- Comps found
- 2
Show comp detail 2 sales within ~0.75 mi
| Address | Dist | Beds/Ba | Sqft | Sold | Price | $/sf | Match |
|---|---|---|---|---|---|---|---|
| 1019 S Main St | 0.68mi | 4/3.5 | 3,462 (+10%) | 15mo | $315,000 | $91 | 38 |
| 403 Bush Ave | 0.71mi | 3/2.0 (-1) | 3,410 (+8%) | 16mo | $300,000 | $88 | 31 |
Match score weights: distance 35% · size 25% · config 20% · recency 20%. Top-matched comps best support the ARV.
Projected returns pro-forma
-3.0% appreciation · 3.0% rent growth · sell at horizon
- IRR
- 10.3%
- Equity multiple
- 1.41×
- Total profit
- $36,542
- Equity at exit
- $47,713
- IRR
- 19.4%
- Equity multiple
- 2.63×
- Total profit
- $145,758
- Equity at exit
- $27,668
Cash invested: $89,600 (down + closing). Projections, not guarantees.
Landlord ↔ Tenant lean methodology
- Overall (STATE)
- 15 Strongly Tenant-Friendly
- State New York
- 15 Strongly Tenant-Friendly · D+10
- County
- — inherits STATE
- City
- — inherits STATE
ZIP-level market 14845
- Home prices YoY
- -24.9%
- Active inventory
- 92
- Price-to-rent
- 5.9×
Monthly cashflow live
- Estimated rent
- $4,500 medium interval (Pro) →
- Mortgage (P&I)
- −$1,678
- Tax from tax record
- −$356 /mo · $4,276/yr
- Insurance
- −$133
- HOA
- −$0
- Vacancy / Maint / Mgmt
- −$945
- Net cashflow
- $1,387
Break-even live
UW: 25.0% down · 7.5% · 30yr · 1.5% tax · 5.0% vac · 8.0% maint · 8.0% mgmt
Financing live
Cash to close
- Down payment
- $80,000
- Closing costs
- $9,600
- Reserves months
- —
- Total cash needed
- —
Loan-product check · same deal, 3 products live
Conventional
25% down · 7.5% · 30yr
- Down + closing
- —
- Monthly P&I
- —
- Monthly cashflow
- —
- DSCR
- —
- Eligible?
- —
Personal DTI + credit; lowest rate.
DSCR
20% down · 8.5% · 30yr
- Down + closing
- —
- Monthly P&I
- —
- Monthly cashflow
- —
- DSCR
- —
- Eligible?
- —
No personal income docs; deal must DSCR.
Hard money
10% down · 12.0% · 12mo
- Down + closing
- —
- Monthly P&I
- —
- Monthly cashflow
- —
- DSCR
- —
- Eligible?
- —
Short-term bridge; refi at stabilization.
Rent comps 1 comps
| Address | Beds | Baths | Sqft | Rent | $/sqft | DOM | Units | Dist |
|---|---|---|---|---|---|---|---|---|
| 911 S Main St Horseheads, NY | 4.0 | 3.0 | 2945 | $4,500 | $1.53 | 44d | 1 | 0.55mi |
Listing history 7 events
-
2026-06-19days on market $320,000 Active 7 DOM
-
2026-06-18days on market $320,000 Active 6 DOM
-
2026-06-17days on market $320,000 Active 5 DOM
-
2026-06-16days on market $320,000 Active 4 DOM
-
2026-06-15days on market $320,000 Active 3 DOM
-
2026-06-12remarks 699-char remark
-
2026-06-12$320,000 Active 1 DOM
ⓘ Source: listings_history table (triggers on properties + properties_extension) + one-shot
backfill from property_details.listing_events for pre-trigger history.
Tax reassessment forecast NY · Partial reset (capped growth)
- Current annual tax
- $4,276 · $356/mo
- Projected year-2 tax
- $4,842 · $403/mo
- Expected delta
- +$566/yr (+$47/mo · 13.2%)
ⓘ Screening estimate from a state-policy table — verify with the county assessor before closing.
Climate risk First Street
- Flood 1/10 Low FEMA zone X · 0% chance over 30 yrs
- Wildfire 3/10 Moderate
- Heat 3/10 Moderate 7 d/yr ≥96°F today · 16 d/yr by 30 yrs out
- Wind 1/10 Low 100% chance of damaging wind over 30 yrs
- Air quality 2/10 Low 0 unhealthy d/yr today · 1 by 30 yrs out
Nearby sold comps map
Loading sold comps map…
Walkable amenities ~0.75 mi
Loading nearby amenities…
Taxation est. · year 1
- Rental income
- $54,000
- − Mortgage interest
- −$17,925
- − Property taxes
- −$4,276
- − Insurance
- −$1,600
- − Repairs & maintenance
- −$4,320
- − Management
- −$4,320
- − Depreciation
- −$9,309
- Taxable income
- $12,250
- Est. tax owed @ 24.0%
- −$2,940
- After-tax cash flow
- $13,707/yr
For passive investors: Depreciation is non-cash, so a rental often shows a tax loss while cash-flowing — sheltering income. Rental losses are passive: they offset passive income freely, and up to $25,000/yr can offset ordinary (W-2) income if you actively participate and your MAGI is under $100k (phasing out to $0 by $150k); unused losses carry forward. On sale, claimed depreciation is recaptured at up to 25%, and gains may owe capital-gains tax (a 1031 exchange can defer both). Figures are a year-1 estimate at your 24.0% rate — not tax advice; consult a CPA.
Schools (NCES district)
- District
- Horseheads Central School District
- NCES district ID
- 3614850
- Math proficiency
- 44% ▼ -19.00%
- Reading proficiency
- 58% ▲ 3.00%
- Median HH income
- $60,594
- Composite
- 44.58/100
- National rank
- #2781
- State rank
- #347 of 590 in NY
Livability — Horseheads
- Score
- 69/100
- State rank
- #494
- US rank
- #8689
Category grades
Schools grade is shown separately in the Schools card above.
Census & demographics
- Census place
- Horseheads, NY
- Population (ZIP)
- 20,552
Population outlook (Chemung County) Hauer SSP2
- Today (2025)
- 82,931 people
- By 2030
- 80,356 · -3.1%
- By 2040
- 74,745 · -9.9%
- By 2050
- 69,012 · -16.8%
- By 2075
- 55,689 · -32.8%
- By 2100
- 41,428 · -50.0%
Race, ethnicity, and origin ACS 2023
- Neighborhood character
- Predominantly White (90%)
- Race & ethnicity
- White 90% Two or more races 5% Asian 2% Hispanic / Latino 2% Black 2%
- Common ancestry
- Romanian 6% Slovak 2% Iranian 2%
- Foreign-born
- 6% · Canada, China, South Korea
- Languages at home
- 94% English-only · Spanish 2% Other Asian/Pacific 1% Other Indo-European 1%
Political lean MEDSL · Chemung
- 2024 margin
- R (+16.8) · D 41.6% · R 58.4%
- 2008→2024 swing
- -15.6pp toward R · 2008: -1.2pp · 2024: -16.8pp
- All cycles
- 2024: R+16.8 2020: R+13.4 2016: R+20.0 2012: R+2.9 2008: R+1.2
Not yet ingested
- Civics
- —
Market trends
- HPI YoY
- ▼ -82.23%
- Current HPI
- 247.777
- Rent YoY
- —
- Metro
- —
- State GDP YoY
- ▲ 2.60%
- F500 in state
- 92
Industry mix (Fortune 500 HQ in NY)
| Industry | F500 HQs | Revenue |
|---|---|---|
| Financial Services | 10 | $950B |
|
||
| Consumer Goods | 9 | $162B |
|
||
| Insurance | 4 | $225B |
|
||
| Telecommunications | 2 | $144B |
|
||
| Pharmaceuticals | 2 | $112B |
|
||
| Media / Entertainment | 2 | $69B |
|
||
Price history
+78.8% since first listed7 events — show timeline
- 2026-06-12 Listed $320,000 UNYREIS
- 2010-07-30 Sold (MLS) $122,000 UNYREIS
- 2010-01-22 Listed $122,000 UNYREIS
- 2009-08-18 Listing Removed — UNYREIS
- 2009-02-19 Listed $195,500 UNYREIS
- 2007-09-26 Sold (MLS) $186,200 UNYREIS
- 2007-02-20 Listed $179,000 UNYREIS
Property tax history
-2.0%/yrLatest (2025): $4,276 · +3.2% YoY. Source: county tax records.
Cash-flow waterfall
monthlySold comps — $/sqft
last 12 mo · ≤1 miLoading sold comps…