5361 Washburn Dr · Trotwood, OH
Flood risk 1/10 · Minimal
- FEMA flood zone
- X (unshaded)
- Chance of flooding over 30 yrs
- 0.0%
- Est. flood insurance / yr
- $507 – $1,088
Fire risk 1/10 · Minimal
- Est. fire insurance / yr
- $713 – $1,323
Heat risk 3/10 · Minor
- Hot days now (above 101°F)
- 7 days/yr
- Hot days in 30 yrs
- 19 days/yr
Wind risk 2/10 · Minimal
- Chance of severe wind over 30 yrs
- 0.0%
Air-quality risk 3/10 · Minor
- Unhealthy air days now
- 3 days/yr
- Unhealthy air days in 30 yrs
- 4 days/yr
Risk factors via First Street. Map © Google.
Why this score? — see what drove the D+ grade
The composite is a weighted blend of 9 inputs, each scored 0–100. Each bar is that input's sub-score; the figure is the points it added to the 100-point composite (weight × sub-score).
- ARV discount +15.0/15.0
- Cash flow +14.4/30.0
- 1% rule +5.5/10.0
- DSCR +4.4/10.0
- Livability +3.0/5.0
- Rent growth +2.5/5.0
- Condition / age +2.5/5.0
- Schools +1.2/10.0
- Appreciation +0.0/10.0
$149,900
🖨 Deal sheet (PDF) 📄 Offer letter ✓ Due diligence
Listing remarks MLS
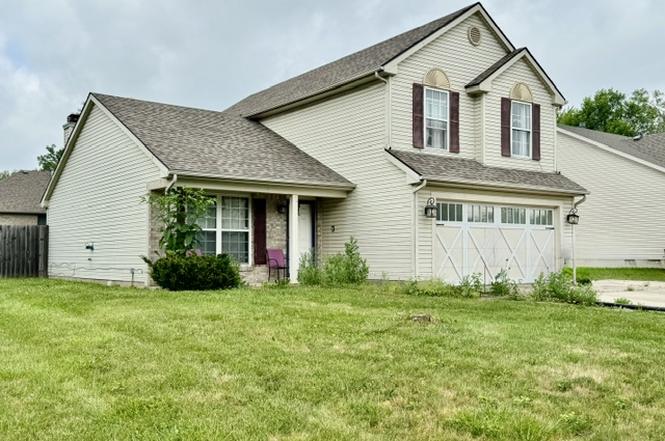
Check out this beautiful home in Westbrooke Village! 1628 sq ft of move-in ready perfection! This three bedroom, two and a half bath home offers a spacious open-concept floor plan, vaulted ceilings, fireplace, large master, large closets, custom two-car attached garage, and fenced-in backyard space, perfect for entertaining! Home is located in quiet neighborhood, close to many shopping and dining options. Neighborhood offers fantastic amenities, including a park and playground equipment, tennis courts, pool, and a community clubhouse. Its a must see!
Key facts
- Covered front porch
- Cathedral ceilings
- Double gates
Tags
Property features AI
Finance
- Financial info: Offered for sale
Exterior
- Parking: Attached two-car garage
- Utilities: Natural gas available; Public water; Sewer available (storm sewer); Cable available
- Home design: Two-story home; Frame construction with vinyl siding; Builder model: Rushmoor II; Slab foundation
- Construction: Frame construction; Vinyl siding
- Exterior features: Privacy fenced backyard; Fence; Porch; Patio
Interior
- Kitchen: Dishwasher; Range; Refrigerator; Kitchen island; Pantry; Kitchen open to family room
- Bedrooms: Second level bedrooms (multiple); Primary/other bedroom on second level (dimensions listed in room details)
- Flooring: Laminate countertops noted (flooring type not specified)
- Bathrooms: Two full bathrooms; One half bathroom; One main-level bathroom
- Heating & cooling: Central air conditioning; Forced air heating; Natural gas heating
- Interior features: Ceiling fans; Cathedral ceilings; Kitchen island; Kitchen open to family room; Laminate countertops; Pantry; Walk-in closets; Vinyl windows; One gas log/wood-burning fireplace with gas starter/log lighter
- Laundry & utility: Main-level laundry room; Gas water heater
Neighborhood map
What this means for you Summary
Snapshot
- This is a 3-bed/2.5-bath single-family listed at $150k.
Deal economics
- At list price, monthly cash flow is $30 ($354/yr) — positive.
- The deal already cash-flows at list — no discount required.
- Meets the 1% rule at list price ($2k rent vs $150k).
Location & tenants
- Location reads 59/100 on livability (#1,014 in OH) — a working-class tenant base; expect higher turnover. Strengths: cost of living A+, housing A; Watch: employment D, crime F, amenities F.
- Trotwood-Madison City (suburban): math 9% / reading 21% proficiency, ranked #645 of 656 in OH (top 98%) — low school quality limits family demand, transient renter base, plan for 1-2y turnover; 78% free/reduced lunch — lower-income household profile, screen leases tightly.
- Zoned schools: Trotwood-Madison Early Learning Center (416 students, 0% FRL); Trotwood-Madison Middle School (math 8% / reading 18%, grade F, #640 of 654 statewide, top 98%, 608 students, 0% FRL); Trotwood-Madison High School (math 2% / reading 27%, grade F, #717 of 781 statewide, top 92%, 770 students, 0% FRL) — zoned schools average 0% FRL vs 78% district-wide (78 pts lower); this property's tenant base skews higher-income than the district average.
- Market conditions: 49 active listings in the ZIP; 6 comparable units currently listed for rent nearby; rentals at typical pace (median 17d on market — plan ~3-4 weeks tenant-placement turnaround); 907 units permitted in Montgomery County in 2024 (416 in 5+ unit buildings).
- This rent runs 37% of the median local income ($52k/yr) — at the standard rent-burdened threshold; future hikes will face affordability resistance.
Forward outlook
- Local home prices are declining (-3.0%/yr); year-one equity from $1k of loan paydown is wiped out by about $4k of value loss. Plan a longer hold.
- Montgomery County population projected at -10% by 2050 — secular population decline; favor cash flow + early exit over multi-decade hold.
Negotiation context
- Only 6 days on market — expect competitive offers; lowballing is unlikely to land.
- 3 sale attempts since 15y ago with the ask held roughly flat each time — persistent listings suggest the price (not the market) is what's stuck; bring a comps-based counter.
- Current owner paid $95k; list at $150k implies a 58% gain — meaningful room to come down on a strong offer.
Risks & watch-outs
- Watch-outs: property tax is 3.0% of price.
Questions for the listing agent
- Property tax is high relative to price — has the assessment been appealed recently, and will the sale trigger a re-assessment?
- Is there a deadline driving the sale (1031 exchange, divorce, estate, relocation)? That informs how much negotiation room exists.
- Schools are F-rated, which usually means shorter tenancies and higher turnover. Who's the typical renter profile here, and what's been the actual vacancy rate?
- Crime grade is F in this area — have there been break-ins, vandalism, or insurance claims at this property in the last 3 years? What carrier currently insures it and at what premium?
- The area grade is low — what's the realistic commute time and amenity access for the typical tenant pool here? Any planned neighborhood developments (good or bad) we should know about?
- What's the average days-on-market for RENTAL listings here right now (not sales)? A rising rental-DOM trend means longer vacancies and softer asking-rent achievability than the comps imply.
- What's the recent tenant-quality profile in this submarket — average credit score on applications, eviction rate, late-payment / NSF rate, and stable-employment percentage? A property-management company in the area should have these aggregated.
- How much new for-sale + rental construction is in the pipeline within 1–3 miles? Heavy new supply typically softens prices + rents 12–24 months out; constrained supply supports both.
Investment metrics
- 1% rule
- 1.05% ✓
- Cap rate
- 6.53%
- Cash-on-cash
- 0.84%
- DSCR
- 1.04
- GRM
- 7.9
CMA / ARV
- ARV (on-the-fly)
- $193,732
- Comps found
- 10
Show comp detail 10 sales within ~0.75 mi
| Address | Dist | Beds/Ba | Sqft | Sold | Price | $/sf | Match |
|---|---|---|---|---|---|---|---|
| 6431 Westanna Dr | 0.11mi | 3/2.5 | 1,724 (+6%) | 23mo | $222,000 | $129 | 66 |
| 6331 Westford Rd | 0.37mi | 4/2.5 (+1) | 1,790 (+10%) | 8mo | $256,500 | $143 | 55 |
| 5649 Mount Olive Ct | 0.41mi | 2/2.0 (-1) | 1,597 (-2%) | 20mo | $190,000 | $119 | 54 |
| 822 Dalewood Pl | 0.69mi | 3/2.0 | 1,705 (+5%) | 6mo | $189,000 | $111 | 53 |
| 5670 Olive Tree Dr | 0.50mi | 3/2.5 | 1,817 (+12%) | 11mo | $193,000 | $106 | 48 |
| 6218 Weybridge Dr | 0.39mi | 3/2.0 | 1,817 (+12%) | 15mo | $220,000 | $121 | 48 |
| 5637 Wakeshire Ct | 0.38mi | 3/2.5 | 1,817 (+12%) | 22mo | $205,000 | $113 | 45 |
| 831 Glenstone Ct | 0.72mi | 3/2.0 | 1,752 (+8%) | 12mo | $190,000 | $108 | 42 |
| 5657 Westcreek Dr | 0.41mi | 4/1.5 (+1) | 1,790 (+10%) | 20mo | $250,000 | $140 | 39 |
| 3625 Shiloh Springs Rd | 0.25mi | 4/1.5 (+1) | 1,856 (+14%) | 24mo | $182,000 | $98 | 36 |
Match score weights: distance 35% · size 25% · config 20% · recency 20%. Top-matched comps best support the ARV.
Projected returns pro-forma
-3.0% appreciation · 3.0% rent growth · sell at horizon
- IRR
- -14.8%
- Equity multiple
- 0.47×
- Total profit
- $-22,274
- Equity at exit
- $22,351
- IRR
- -6.0%
- Equity multiple
- 0.61×
- Total profit
- $-16,420
- Equity at exit
- $12,961
Cash invested: $41,972 (down + closing). Projections, not guarantees.
Landlord ↔ Tenant lean methodology
- Overall (STATE)
- 73 Landlord-Friendly
- State Ohio
- 73 Landlord-Friendly · R+6
- County
- — inherits STATE
- City
- — inherits STATE
ZIP-level market 45426
- Home prices YoY
- -12.0%
- Active inventory
- 49
- Price-to-rent
- 7.9×
Monthly cashflow live
- Estimated rent
- $1,581 high interval (Pro) →
- Mortgage (P&I)
- −$786
- Tax from tax record
- −$371 /mo · $4,454/yr
- Insurance
- −$62
- HOA
- −$0
- Vacancy / Maint / Mgmt
- −$332
- Net cashflow
- $30
Break-even live
Sensitivity live
| Price | -10% $114 | -5% $72 | +0% $30 | +5% $-13 | +10% $-55 |
|---|---|---|---|---|---|
| Rent | -10% $-95 | -5% $-33 | +0% $30 | +5% $92 | +10% $154 |
| Rate | -1.0pp $105 | -0.5pp $68 | base $30 | +0.5pp $-9 | +1.0pp $-49 |
UW: 25.0% down · 7.5% · 30yr · 1.5% tax · 5.0% vac · 8.0% maint · 8.0% mgmt
Financing live
Cash to close
- Down payment
- $37,475
- Closing costs
- $4,497
- Reserves months
- —
- Total cash needed
- —
Loan-product check · same deal, 3 products live
Conventional
25% down · 7.5% · 30yr
- Down + closing
- —
- Monthly P&I
- —
- Monthly cashflow
- —
- DSCR
- —
- Eligible?
- —
Personal DTI + credit; lowest rate.
DSCR
20% down · 8.5% · 30yr
- Down + closing
- —
- Monthly P&I
- —
- Monthly cashflow
- —
- DSCR
- —
- Eligible?
- —
No personal income docs; deal must DSCR.
Hard money
10% down · 12.0% · 12mo
- Down + closing
- —
- Monthly P&I
- —
- Monthly cashflow
- —
- DSCR
- —
- Eligible?
- —
Short-term bridge; refi at stabilization.
Rent comps 6 comps
| Address | Beds | Baths | Sqft | Rent | $/sqft | DOM | Units | Dist |
|---|---|---|---|---|---|---|---|---|
| 5 Belle Meadows Dr Dayton, OH | 1.0–3.0 | 1.0–2.5 | 950 | $1,329 | $1.40 | 4d | 1 | 0.38mi |
| 5900 Macduff Dr Dayton, OH | 1.0–4.0 | 1.0–2.0 | 1104 | $1,467 | $1.33 | 4d | 17 | 0.63mi |
| 4724 Stonehedge St Dayton, OH | 3.0 | 2.0 | 1404 | $1,445 | $1.03 | 45d | 1 | 0.78mi |
| 4564 Linchmere Dr Dayton, OH | 3.0 | 3.0 | 1096 | $1,595 | $1.46 | 16d | 1 | 1.27mi |
| 5774 Courtney Ln Clayton, OH | 4.0 | 2.5 | 2202 | $2,300 | $1.04 | 4d | 1 | 1.33mi |
| 3 W Sunrise Ave Dayton, OH | 3.0 | 1.5 | 1200 | $1,250 | $1.04 | 45d | 1 | 1.49mi |
Listing history 7 events
-
2026-06-18status $149,900 Pending 6 DOM
-
2026-06-17days on market $149,900 Active 6 DOM
-
2026-06-16days on market $149,900 Active 5 DOM
-
2026-06-15days on market $149,900 Active 4 DOM
-
2026-06-14days on market $149,900 Active 2 DOM
-
2026-06-13remarks 669-char remark
-
2026-06-13$149,900 Active 1 DOM
ⓘ Source: listings_history table (triggers on properties + properties_extension) + one-shot
backfill from property_details.listing_events for pre-trigger history.
Tax reassessment forecast OH · Partial reset (capped growth)
- Current annual tax
- $4,454 · $371/mo
- Projected year-2 tax
- $4,454 · $371/mo
- Expected delta
- $0/yr ($0/mo · 0.0%)
ⓘ Screening estimate from a state-policy table — verify with the county assessor before closing.
Climate risk First Street
- Flood 1/10 Low FEMA zone X (unshaded) · 0% chance over 30 yrs
- Wildfire 1/10 Low
- Heat 3/10 Moderate 7 d/yr ≥101°F today · 19 d/yr by 30 yrs out
- Wind 2/10 Low 0% chance of damaging wind over 30 yrs
- Air quality 3/10 Moderate 3 unhealthy d/yr today · 4 by 30 yrs out
Nearby sold comps map
Loading sold comps map…
Walkable amenities ~0.75 mi
Loading nearby amenities…
Taxation est. · year 1
- Rental income
- $18,975
- − Mortgage interest
- −$8,397
- − Property taxes
- −$4,454
- − Insurance
- −$750
- − Repairs & maintenance
- −$1,518
- − Management
- −$1,518
- − Depreciation
- −$4,361
- Taxable loss
- −$2,021
- Est. tax savings @ 24.0%
- +$485
- After-tax cash flow
- $839/yr
For passive investors: Depreciation is non-cash, so a rental often shows a tax loss while cash-flowing — sheltering income. Rental losses are passive: they offset passive income freely, and up to $25,000/yr can offset ordinary (W-2) income if you actively participate and your MAGI is under $100k (phasing out to $0 by $150k); unused losses carry forward. On sale, claimed depreciation is recaptured at up to 25%, and gains may owe capital-gains tax (a 1031 exchange can defer both). Figures are a year-1 estimate at your 24.0% rate — not tax advice; consult a CPA.
Schools (NCES district)
- District
- Trotwood-Madison City
- NCES district ID
- 3904869
- Math proficiency
- 9% ▼ -15.00%
- Reading proficiency
- 21% ▼ -11.00%
- Median HH income
- $33,529
- Composite
- 12.15/100
- National rank
- #9651
- State rank
- #645 of 656 in OH
Livability — Trotwood
- Score
- 59/100
- State rank
- #1014
- US rank
- #20073
Category grades
Schools grade is shown separately in the Schools card above.
Census & demographics
- Census place
- Trotwood, OH
- County
- Montgomery County · 459,541 people
- City population
- 19,754
- Metro
- Dayton-Kettering, OH
- Population (ZIP)
- 14,114
- Household income
- $51,908
- Rent vs Own
- Severe rent burden
- 852.0
Population outlook (Montgomery County) Hauer SSP2
- Today (2025)
- 523,241 people
- By 2030
- 514,948 · -1.6%
- By 2040
- 493,378 · -5.7%
- By 2050
- 469,639 · -10.2%
- By 2075
- 418,360 · -20.0%
- By 2100
- 353,315 · -32.5%
Race, ethnicity, and origin ACS 2023
- Neighborhood character
- Predominantly Black (69%)
- Race & ethnicity
- Black 69% White 22% Two or more races 7% Asian 2% Hispanic / Latino 1%
- Common ancestry
- Lithuanian 1% Serbian 1%
- Foreign-born
- 3% · Canada
- Languages at home
- 95% English-only · Other Asian/Pacific 1% Spanish 1% French/Haitian/Cajun 1%
Political lean MEDSL · Montgomery
- 2024 margin
- Toss-up / Even · D 49.8% · R 49.3%
- 2008→2024 swing
- -5.8pp toward R · 2008: 6.2pp · 2024: 0.5pp
- All cycles
- 2024: D+0.5 2020: D+2.2 2016: R+1.2 2012: D+3.1 2008: D+6.2
Not yet ingested
- Civics
- —
Market trends
- HPI YoY
- ▼ -44.94%
- Current HPI
- 329.0106
- Rent YoY
- —
- Metro
- Dayton-Kettering, OH
- State GDP YoY
- ▲ 1.98%
- F500 in state
- 48
Industry mix (Fortune 500 HQ in OH)
| Industry | F500 HQs | Revenue |
|---|---|---|
| Insurance | 3 | $145B |
|
||
| Industrial Machinery | 3 | $49B |
|
||
| Financial Services | 3 | $24B |
|
||
| Consumer Goods | 2 | $93B |
|
||
| Aerospace / Defense | 2 | $47B |
|
||
| Utilities | 2 | $33B |
|
||
Price history
+15.4% since first listed12 events — show timeline
- 2026-06-11 Listed $149,900 Dayton MLS
- 2016-06-25 Sold (MLS) $95,000 Dayton MLS
- 2016-06-24 Sold (Public Records) $95,000 Public Records
- 2016-06-20 Sold (MLS) $95,000 Dayton MLS
- 2016-05-04 Contingent — Dayton MLS
- 2016-03-25 Listed $99,900 Dayton MLS
- 2011-06-07 Sold (Public Records) $99,000 Public Records
- 2011-06-03 Sold (MLS) $99,000 Dayton MLS
- 2011-06-03 Sold (MLS) $99,000 Dayton MLS
- 2011-03-21 Listing Removed — Dayton MLS
- 2011-01-12 Listed $99,000 Dayton MLS
- 2004-07-06 Sold (Public Records) $129,900 Public Records
Property tax history
+3.8%/yrLatest (2025): $4,454 · +5.7% YoY. Source: county tax records.
Cash-flow waterfall
monthlySold comps — $/sqft
last 12 mo · ≤1 miLoading sold comps…