 Fourplex
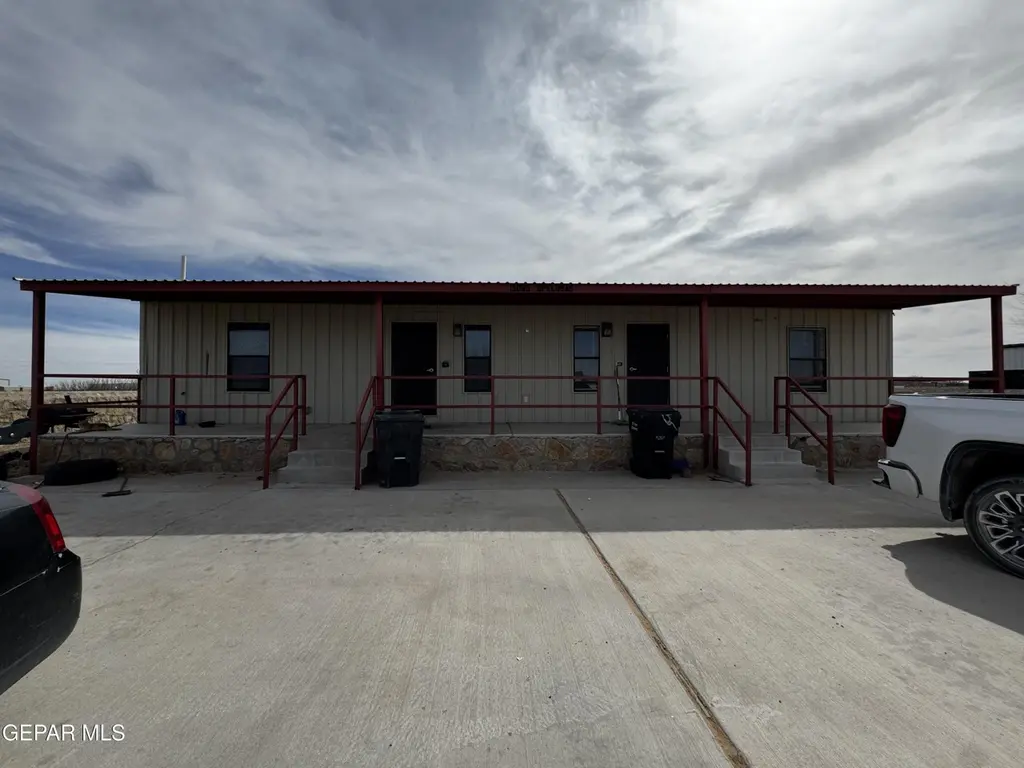
15065 Opelousas Ave · Horizon City, TX
Flood risk No data
- FEMA flood zone
- —
- Chance of flooding over 30 yrs
- —
- Est. flood insurance / yr
- —
Fire risk No data
- Est. fire insurance / yr
- —
Heat risk No data
- Hot days now (above threshold)
- —
- Hot days in 30 yrs
- —
Wind risk No data
- Chance of severe wind over 30 yrs
- —
Air-quality risk No data
- Unhealthy air days now
- —
- Unhealthy air days in 30 yrs
- —
Risk factors via First Street. Map © Google.
Why this score? — see what drove the B- grade
The composite is a weighted blend of 9 inputs, each scored 0–100. Each bar is that input's sub-score; the figure is the points it added to the 100-point composite (weight × sub-score).
- Cash flow +30.0/30.0
- 1% rule +10.0/10.0
- DSCR +10.0/10.0
- ARV discount +7.5/15.0
- Condition / age +4.0/5.0
- Livability +3.3/5.0
- Rent growth +3.2/5.0
- Schools +1.5/10.0
- Appreciation +0.0/10.0
$270,000
🖨 Deal sheet (PDF) 📄 Offer letter ✓ Due diligence
Multi-family units
County records classify this as Multi-Family (2-4 Unit). Listing-text estimate: 4 units. confirmed
Listing remarks MLS
New Year, New You! Investment Opportunity Take the first step into property ownership and rental income with this income-producing multi-unit property. The property features four units, with three currently rented, providing immediate cash flow. One unit is available for owner occupancy or future rental potential. Please do not disturb tenants.
Key facts
- Income-producing
- Immediate cash flow
- Multi-unit property
Tags
Neighborhood map
What this means for you Summary
Snapshot
- This is a 4 × 1-bed/1-bath units multifamily listed at $270k. Condition is rated good.
Deal economics
- At list price, monthly cash flow is $2k ($20k/yr) — positive. Per door: $426/mo.
- The deal already cash-flows at list — no discount required.
- Meets the 1% rule at list price ($5k rent vs $270k).
- Recommended offer: $238k (12.0% below list) — sets the bar for market timing.
Location & tenants
- Location reads 66/100 on livability (#619 in TX) — a middle-class / working-renter tenant base. Strengths: crime A+, cost of living A+, housing A+; Watch: employment D, amenities F, commute F.
- Clint ISD (suburban): math 14% / reading 22% proficiency, ranked #792 of 826 in TX (top 96%) — low school quality limits family demand, transient renter base, plan for 1-2y turnover.
- Zoned schools: Desert Hills El (math 23% / reading 24%, grade F, #3,247 of 4,322 statewide, top 76%, 907 students, 78% FRL); Horizon Middle (math 16% / reading 20%, grade F, #1,491 of 1,662 statewide, top 91%, 670 students, 84% FRL); Horizon H S (math 14% / reading 26%, grade F, #1,397 of 1,632 statewide, top 87%, 1,677 students, 85% FRL) — zoned schools average 82% FRL vs 59% district-wide (23 pts higher); higher-poverty schools than district average — tighter screening recommended.
- Market conditions: Rents rising (+2.9%/yr); 2101 active listings in the ZIP; 2 comparable units currently listed for rent nearby; solid renter incomes; 2,196 units permitted in El Paso County in 2024 (143 in 5+ unit buildings).
- At $4,520/mo this rent would consume 71% of the median local household income ($77k/yr) (locally 838% of renters already pay >50% of income on rent) — very limited rent-growth headroom before tenants either downsize or default.
Forward outlook
- Local home prices are declining (-3.0%/yr); year-one equity from $2k of loan paydown is wiped out by about $8k of value loss. Plan a longer hold.
- El Paso County population projected at +10% by 2050 — modest demand growth; plan on rents tracking national, not racing it.
- At projected returns (-3.0% appreciation + 2.9% rent growth), your $76k cash investment doubles in ~5 years — after that, you're playing with house money.
Negotiation context
- It's been on market 155 days — a 12% lower offer ($238k) is reasonable based on typical stale-listing flexibility.
Questions for the listing agent
- It's been on market 155 days. Have you received any prior offers? Is the seller open to a 12% concession, seller financing, or rate buy-down credit?
- Can we see the unit-by-unit rent roll, current vacancy, and any below-market leases? What's the average tenancy length?
- What capital expenditures (roof, boiler, parking lot, exteriors) have been made in the last 5 years, and what's planned in the next 2?
- Why hasn't it sold? Are there any deal-killer items the seller is aware of (foundation, flood, title, zoning, code violations)?
- Is there a deadline driving the sale (1031 exchange, divorce, estate, relocation)? That informs how much negotiation room exists.
- Schools are D-rated, which usually means shorter tenancies and higher turnover. Who's the typical renter profile here, and what's been the actual vacancy rate?
- What's the average days-on-market for RENTAL listings here right now (not sales)? A rising rental-DOM trend means longer vacancies and softer asking-rent achievability than the comps imply.
- What's the recent tenant-quality profile in this submarket — average credit score on applications, eviction rate, late-payment / NSF rate, and stable-employment percentage? A property-management company in the area should have these aggregated.
- How much new apartment / multifamily construction is in the pipeline within 1–3 miles? Heavy new supply (>2% of stock underway) typically softens rents 12–24 months out; light construction supports rent growth.
Investment metrics
- 1% rule
- 1.67% ✓
- Cap rate
- 13.87%
- Cash-on-cash
- 27.06%
- DSCR
- 2.20
- GRM
- 5.0
CMA / ARV
No comps found within radius.
Projected returns pro-forma
-3.0% appreciation · 2.93% rent growth · sell at horizon
- IRR
- 20.9%
- Equity multiple
- 1.85×
- Total profit
- $64,584
- Equity at exit
- $40,258
- IRR
- 29.1%
- Equity multiple
- 3.58×
- Total profit
- $195,033
- Equity at exit
- $23,345
Cash invested: $75,600 (down + closing). Projections, not guarantees.
Landlord ↔ Tenant lean methodology
- Overall (STATE)
- 87 Strongly Landlord-Friendly
- State Texas
- 87 Strongly Landlord-Friendly · R+5
- County
- — inherits STATE
- City
- — inherits STATE
ZIP-level market 79928
- Home prices YoY
- -16.9%
- Rents YoY
- 2.9%
- Active inventory
- 2101
- Price-to-rent
- 19.9×
Monthly cashflow live
- Estimated rent
- $4,520 medium interval (Pro) →
- Mortgage (P&I)
- −$1,416
- Tax est. 1.5%
- −$338 /mo · $4,050/yr
- Insurance
- −$112
- HOA
- −$0
- Lot rent
- −$0
- Vacancy / Maint / Mgmt
- −$949
- Net cashflow
- $1,705
Break-even live
Sensitivity live
| Price | -10% $1,891 | -5% $1,798 | +0% $1,705 | +5% $1,612 | +10% $1,518 |
|---|---|---|---|---|---|
| Rent | -10% $1,348 | -5% $1,526 | +0% $1,705 | +5% $1,883 | +10% $2,062 |
| Rate | -1.0pp $1,841 | -0.5pp $1,774 | base $1,705 | +0.5pp $1,635 | +1.0pp $1,564 |
4-unit breakdown (identical units grouped — click to expand)
| Units | Beds | Baths | Est. rent |
|---|---|---|---|
| 4× units | 1 | 1 | $4,520 |
| #1 | 1 | 1 | $1,130 |
| #2 | 1 | 1 | $1,130 |
| #3 | 1 | 1 | $1,130 |
| #4 | 1 | 1 | $1,130 |
| Total (4 units) | $4,520 | ||
UW: 25.0% down · 7.5% · 30yr · 1.5% tax · 5.0% vac · 8.0% maint · 8.0% mgmt
Financing live
Cash to close
- Down payment
- $67,500
- Closing costs
- $8,100
- Reserves months
- —
- Total cash needed
- —
Loan-product check · same deal, 3 products live
Conventional
25% down · 7.5% · 30yr
- Down + closing
- —
- Monthly P&I
- —
- Monthly cashflow
- —
- DSCR
- —
- Eligible?
- —
Personal DTI + credit; lowest rate.
DSCR
20% down · 8.5% · 30yr
- Down + closing
- —
- Monthly P&I
- —
- Monthly cashflow
- —
- DSCR
- —
- Eligible?
- —
No personal income docs; deal must DSCR.
Hard money
10% down · 12.0% · 12mo
- Down + closing
- —
- Monthly P&I
- —
- Monthly cashflow
- —
- DSCR
- —
- Eligible?
- —
Short-term bridge; refi at stabilization.
Rent comps 2 comps
| Address | Beds | Baths | Sqft | Rent | $/sqft | DOM | Units | Dist |
|---|---|---|---|---|---|---|---|---|
| 14831 Allemands Ave Unit C El Paso, TX | 2.0 | 1.0 | 714 | $800 | $1.12 | 5d | 1 | 0.63mi |
| 14741 Calhoun Dr El Paso, TX | 3.0 | 2.0 | 1114 | $1,400 | $1.26 | 46d | 1 | 0.87mi |
Listing history 16 events
-
2026-06-22days on market $270,000 Active 155 DOM
-
2026-06-22days on market $270,000 Active 154 DOM
-
2026-06-18days on market $270,000 Active 151 DOM
-
2026-06-17days on market $270,000 Active 150 DOM
-
2026-06-16days on market $270,000 Active 149 DOM
-
2026-06-15days on market $270,000 Active 148 DOM
-
2026-06-13days on market $270,000 Active 146 DOM
-
2026-06-10days on market $270,000 Active 143 DOM
-
2026-06-09days on market $270,000 Active 142 DOM
-
2026-06-08days on market $270,000 Active 141 DOM
-
2026-06-07days on market $270,000 Active 140 DOM
-
2026-06-03days on market $270,000 Active 136 DOM
-
2026-06-03days on market $270,000 Active 135 DOM
-
2026-06-01days on market $270,000 Active 134 DOM
-
2026-05-31days on market $270,000 Active 133 DOM
-
2026-01-18$270,000 Active 349-char remark
Show marketing remark (349 chars)
New Year, New You! Investment Opportunity Take the first step into property ownership and rental income with this income-producing multi-unit property. The property features four units, with three currently rented, providing immediate cash flow. One unit is available for owner occupancy or future rental potential. Please do not disturb tenants.
ⓘ Source: listings_history table (triggers on properties + properties_extension) + one-shot
backfill from property_details.listing_events for pre-trigger history.
Nearby sold comps map
Loading sold comps map…
Walkable amenities ~0.75 mi
Loading nearby amenities…
Taxation est. · year 1
- Rental income
- $54,240
- − Mortgage interest
- −$15,124
- − Property taxes
- −$4,050
- − Insurance
- −$1,350
- − Repairs & maintenance
- −$4,339
- − Management
- −$4,339
- − Depreciation
- −$7,855
- Taxable income
- $17,183
- Est. tax owed @ 24.0%
- −$4,124
- After-tax cash flow
- $16,335/yr
For passive investors: Depreciation is non-cash, so a rental often shows a tax loss while cash-flowing — sheltering income. Rental losses are passive: they offset passive income freely, and up to $25,000/yr can offset ordinary (W-2) income if you actively participate and your MAGI is under $100k (phasing out to $0 by $150k); unused losses carry forward. On sale, claimed depreciation is recaptured at up to 25%, and gains may owe capital-gains tax (a 1031 exchange can defer both). Figures are a year-1 estimate at your 24.0% rate — not tax advice; consult a CPA.
Condition & rehab AI · 9 photos
This multi-unit property is in good condition with minimal repairs needed. It offers immediate rental income and has the potential for further value increases through cosmetic updates and landscaping.
Value-add opportunities
- Both Landscaping and curb appeal improvements — Enhanced curb appeal can attract more tenants and buyers.
- Both Addition of modern amenities in common areas — Modern amenities can attract more tenants and buyers.
- Both Painting and updating interior walls — Fresh paint and updated walls can make the property more appealing and increase its value.
- Both Upgrading HVAC and mechanical systems — Modern and efficient systems can improve comfort and reduce energy costs, attracting more tenants and buyers.
- Both Adding a small garden or landscaping around the property — A small garden can enhance the property's curb appeal and attract more tenants and buyers.
Renovation cost estimate screening
Value-add ROI direction
- Both Landscaping and curb appeal improvements — Enhanced curb appeal can attract more tenants and buyers. ↑
- Both Addition of modern amenities in common areas — Modern amenities can attract more tenants and buyers. ↑
- Both Painting and updating interior walls — Fresh paint and updated walls can make the property more appealing and increase its value. ↑
- Both Upgrading HVAC and mechanical systems — Modern and efficient systems can improve comfort and reduce energy costs, attracting more tenants and buyers. ↑
- Both Adding a small garden or landscaping around the property — A small garden can enhance the property's curb appeal and attract more tenants and buyers. ↑
ⓘ Cost ranges are severity-bucket heuristics (US national rule-of-thumb). Get contractor quotes + a written scope before underwriting a rehab budget.
Schools (NCES district)
- District
- Clint ISD
- NCES district ID
- 4814430
- Math proficiency
- 14% ▼ -32.00%
- Reading proficiency
- 22% ▼ -15.00%
- Median HH income
- $37,490
- Composite
- 15.03/100
- National rank
- #9356
- State rank
- #792 of 826 in TX
Livability — Horizon City
- Score
- 66/100
- State rank
- #619
- US rank
- #11815
Category grades
Schools grade is shown separately in the Schools card above.
Census & demographics
- County
- El Paso County · 761,266 people
- City population
- 86,599
- Metro
- El Paso, TX
- Population (ZIP)
- 86,599
- Household income
- $76,643
- Rent vs Own
- Severe rent burden
- 838.0
Population outlook (El Paso County) Hauer SSP2
- Today (2025)
- 897,899 people
- By 2030
- 922,694 · +2.8%
- By 2040
- 960,492 · +7.0%
- By 2050
- 982,919 · +9.5%
- By 2075
- 997,266 · +11.1%
- By 2100
- 900,630 · +0.3%
Race, ethnicity, and origin ACS 2023
- Neighborhood character
- Predominantly Hispanic (89%)
- Race & ethnicity
- Hispanic / Latino 89% Two or more races 39% White 7% Black 2% Native American 2%
- Hispanic origin (detail)
- Mexican 84%
- Foreign-born
- 23% · Canada
- Languages at home
- 25% English-only · Spanish 74% Other Asian/Pacific 1%
Political lean MEDSL · El Paso
- 2024 margin
- D (+15.1) · D 57.0% · R 41.8% · Other 1.2%
- 2008→2024 swing
- -17.4pp toward R · 2008: 32.5pp · 2024: 15.1pp
- All cycles
- 2024: D+15.1 2020: D+35.1 2016: D+43.2 2012: D+32.6 2008: D+32.5
Not yet ingested
- Civics
- —
Market trends
- HPI YoY
- ▼ -40.72%
- Current HPI
- 200.6454
- Rent YoY
- ▲ 2.93%
- Metro
- El Paso, TX
- State GDP YoY
- ▲ 3.95%
- F500 in state
- 110
Industry mix (Fortune 500 HQ in TX)
| Industry | F500 HQs | Revenue |
|---|---|---|
| Energy | 16 | $1,198B |
|
||
| Technology | 5 | $198B |
|
||
| Engineering / Construction | 4 | $72B |
|
||
| Energy Services | 3 | $60B |
|
||
| Utilities | 3 | $41B |
|
||
| Healthcare | 2 | $330B |
|
||
Price history
1 event — show timeline
- 2026-01-18 Listed $270,000 GEPARMLS
Cash-flow waterfall
monthlySold comps — $/sqft
last 12 mo · ≤1 miLoading sold comps…