 Multi-family
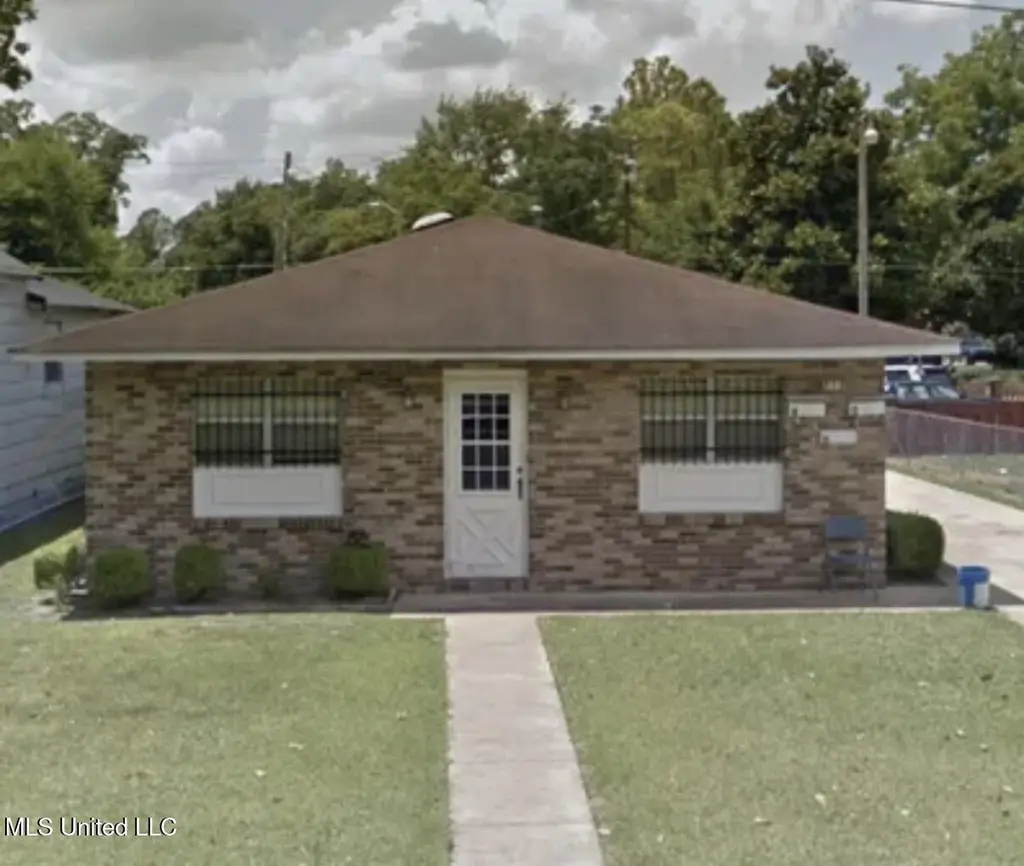
715 Central St · Belzoni, MS
Flood risk 1/10 · Minimal
- FEMA flood zone
- X
- Chance of flooding over 30 yrs
- 0.0%
- Est. flood insurance / yr
- $507 – $1,088
Fire risk 3/10 · Minor
- Est. fire insurance / yr
- $1,241 – $2,305
Heat risk 7/10 · Major
- Hot days now (above 111°F)
- 7 days/yr
- Hot days in 30 yrs
- 20 days/yr
Wind risk 6/10 · Moderate
- Chance of severe wind over 30 yrs
- 56.0%
Air-quality risk 1/10 · Minimal
- Unhealthy air days now
- 0 days/yr
- Unhealthy air days in 30 yrs
- 0 days/yr
Risk factors via First Street. Map © Google.
Why this score? — see what drove the B- grade
The composite is a weighted blend of 9 inputs, each scored 0–100. Each bar is that input's sub-score; the figure is the points it added to the 100-point composite (weight × sub-score).
- Cash flow +30.0/30.0
- 1% rule +10.0/10.0
- DSCR +10.0/10.0
- ARV discount +5.2/15.0
- Livability +3.0/5.0
- Appreciation +2.8/10.0
- Rent growth +2.5/5.0
- Condition / age +2.5/5.0
- Schools +0.4/10.0
$129,000
🖨 Deal sheet (PDF) 📄 Offer letter ✓ Due diligence
Multi-family units
County records classify this as Multi-Family (2-4 Unit). Listing-text estimate: 1 unit. estimate disagrees with records
Listing remarks MLS
Attention Investors! Income-producing Tri-Plex with strong upside potential. Fully rented with (2) 2BR/1BA units and (1) 1BR/1BA unit. 30-year architectural shingle roof (2022). Tenants pay all utilities. Current monthly income: $1,600. Property being sold ''AS-IS''. Pre-approval required prior to showing.
Key facts
- Income-producing
- Fully rented
- 1 acre lot
Tags
Neighborhood map
What this means for you Summary
Snapshot
- This is a 5-bed/3.0-bath multifamily listed at $129k.
Deal economics
- At list price, monthly cash flow is $1k ($18k/yr) — positive.
- The deal already cash-flows at list — no discount required.
- Meets the 1% rule at list price ($3k rent vs $129k).
- Recommended offer: $114k (12.0% below list) — sets the bar for market timing.
Location & tenants
- Location reads 59/100 on livability (#244 in MS) — a working-class tenant base; expect higher turnover. Strengths: crime A+, cost of living A+, housing A+; Watch: schools F, amenities F, commute F.
- Humphreys County School District (town): math 3% / reading 9% proficiency, ranked #128 of 130 in MS (top 98%) — low school quality limits family demand, transient renter base, plan for 1-2y turnover; 96% free/reduced lunch — lower-income household profile, screen leases tightly.
- Market conditions: 11 active listings in the ZIP.
Forward outlook
- Local home prices are declining (-3.0%/yr); year-one equity from $892 of loan paydown is wiped out by about $4k of value loss. Plan a longer hold.
- Humphreys County population projected at -34% by 2050 — secular population decline; favor cash flow + early exit over multi-decade hold.
- At projected returns (-3.0% appreciation + 3.0% rent growth), your $36k cash investment doubles in ~3 years — after that, you're playing with house money.
Negotiation context
- It's been on market 134 days — a 12% lower offer ($114k) is reasonable based on typical stale-listing flexibility.
- 3 sale attempts since 3y ago with the ask held roughly flat each time — persistent listings suggest the price (not the market) is what's stuck; bring a comps-based counter.
Risks & watch-outs
- Climate carrying-cost: major wind risk, 56% chance of damaging wind over 30y; extreme-heat days projected 7→20/yr by 2055 (HVAC capex compounding) — expect insurance premiums to compound above CPI over the hold.
Questions for the listing agent
- It's been on market 134 days. Have you received any prior offers? Is the seller open to a 12% concession, seller financing, or rate buy-down credit?
- Why hasn't it sold? Are there any deal-killer items the seller is aware of (foundation, flood, title, zoning, code violations)?
- Is there a deadline driving the sale (1031 exchange, divorce, estate, relocation)? That informs how much negotiation room exists.
- Schools are F-rated, which usually means shorter tenancies and higher turnover. Who's the typical renter profile here, and what's been the actual vacancy rate?
- What's the average days-on-market for RENTAL listings here right now (not sales)? A rising rental-DOM trend means longer vacancies and softer asking-rent achievability than the comps imply.
- What's the recent tenant-quality profile in this submarket — average credit score on applications, eviction rate, late-payment / NSF rate, and stable-employment percentage? A property-management company in the area should have these aggregated.
- How much new apartment / multifamily construction is in the pipeline within 1–3 miles? Heavy new supply (>2% of stock underway) typically softens rents 12–24 months out; light construction supports rent growth.
Investment metrics
- 1% rule
- 2.38% ✓
- Cap rate
- 19.98%
- Cash-on-cash
- 48.90%
- DSCR
- 3.18
- GRM
- 3.5
CMA / ARV
- ARV (median comp)
- $122,693
- List price
- $129,000
- Delta
- 5.14%
- Verdict
- FAIR
- Comps
- 1 within 2.0 mi
Show comp detail 1 sale within ~0.75 mi
| Address | Dist | Beds/Ba | Sqft | Sold | Price | $/sf | Match |
|---|---|---|---|---|---|---|---|
| 307 Church St | 0.47mi | 5/3.0 | 2,352 (+5%) | 13mo | $129,000 | $55 | 59 |
Match score weights: distance 35% · size 25% · config 20% · recency 20%. Top-matched comps best support the ARV.
Projected returns pro-forma
-3.0% appreciation · 3.0% rent growth · sell at horizon
- IRR
- 46.5%
- Equity multiple
- 3.02×
- Total profit
- $72,921
- Equity at exit
- $19,234
- IRR
- 52.3%
- Equity multiple
- 6.11×
- Total profit
- $184,544
- Equity at exit
- $11,154
Cash invested: $36,120 (down + closing). Projections, not guarantees.
Landlord ↔ Tenant lean methodology
- Overall (STATE)
- 90 Strongly Landlord-Friendly
- State Mississippi
- 90 Strongly Landlord-Friendly · R+11
- County
- — inherits STATE
- City
- — inherits STATE
ZIP-level market 39038
- Home prices YoY
- -3.6%
- Active inventory
- 11
- Price-to-rent
- 10.5×
Monthly cashflow live
- Estimated rent
- $3,067 medium interval (Pro) →
- Mortgage (P&I)
- −$676
- Tax from tax record
- −$221 /mo · $2,650/yr
- Insurance
- −$54
- HOA
- −$0
- Vacancy / Maint / Mgmt
- −$644
- Net cashflow
- $1,472
Break-even live
Sensitivity live
| Price | -10% $1,545 | -5% $1,508 | +0% $1,472 | +5% $1,435 | +10% $1,399 |
|---|---|---|---|---|---|
| Rent | -10% $1,230 | -5% $1,351 | +0% $1,472 | +5% $1,593 | +10% $1,714 |
| Rate | -1.0pp $1,537 | -0.5pp $1,505 | base $1,472 | +0.5pp $1,438 | +1.0pp $1,404 |
3-unit breakdown (identical units grouped — click to expand)
| Units | Beds | Baths | Est. rent |
|---|---|---|---|
| 2× units | 2 | 1 | $2,046 |
| #1 | 2 | 1 | $1,023 |
| #2 | 2 | 1 | $1,023 |
| 1× unit | 1 | 1 | $1,020 |
| Total (3 units) | $3,067 | ||
UW: 25.0% down · 7.5% · 30yr · 1.5% tax · 5.0% vac · 8.0% maint · 8.0% mgmt
Financing live
Cash to close
- Down payment
- $32,250
- Closing costs
- $3,870
- Reserves months
- —
- Total cash needed
- —
Loan-product check · same deal, 3 products live
Conventional
25% down · 7.5% · 30yr
- Down + closing
- —
- Monthly P&I
- —
- Monthly cashflow
- —
- DSCR
- —
- Eligible?
- —
Personal DTI + credit; lowest rate.
DSCR
20% down · 8.5% · 30yr
- Down + closing
- —
- Monthly P&I
- —
- Monthly cashflow
- —
- DSCR
- —
- Eligible?
- —
No personal income docs; deal must DSCR.
Hard money
10% down · 12.0% · 12mo
- Down + closing
- —
- Monthly P&I
- —
- Monthly cashflow
- —
- DSCR
- —
- Eligible?
- —
Short-term bridge; refi at stabilization.
Listing history 11 events
-
2026-06-07statusdays on market $129,000 Pending 134 DOM
-
2026-06-04days on market $129,000 Active 132 DOM
-
2026-06-02days on market $129,000 Active 131 DOM
-
2026-06-01days on market $129,000 Active 130 DOM
-
2026-05-31days on market $129,000 Active 129 DOM
-
2026-01-22$129,000 Active 307-char remark
Show marketing remark (307 chars)
Attention Investors! Income-producing Tri-Plex with strong upside potential. Fully rented with (2) 2BR/1BA units and (1) 1BR/1BA unit. 30-year architectural shingle roof (2022). Tenants pay all utilities. Current monthly income: $1,600. Property being sold ''AS-IS''. Pre-approval required prior to showing.
-
2025-12-29historical
-
2025-07-12price $125,000
-
2025-07-11status Active
-
2025-03-31historical
-
2023-07-13$129,000 Active
ⓘ Source: listings_history table (triggers on properties + properties_extension) + one-shot
backfill from property_details.listing_events for pre-trigger history.
Tax reassessment forecast MS · Resets to sale price
- Current annual tax
- $2,650 · $221/mo
- Projected year-2 tax
- $2,650 · $221/mo
- Expected delta
- $0/yr ($0/mo · 0.0%)
ⓘ Screening estimate from a state-policy table — verify with the county assessor before closing.
Climate risk First Street
- Flood 1/10 Low FEMA zone X · 0% chance over 30 yrs
- Wildfire 3/10 Moderate
- Heat 7/10 Severe 7 d/yr ≥111°F today · 20 d/yr by 30 yrs out
- Wind 6/10 Major 56% chance of damaging wind over 30 yrs
- Air quality 1/10 Low 0 unhealthy d/yr today · 0 by 30 yrs out
Nearby sold comps map
Loading sold comps map…
Walkable amenities ~0.75 mi
Loading nearby amenities…
Taxation est. · year 1
- Rental income
- $36,804
- − Mortgage interest
- −$7,226
- − Property taxes
- −$2,650
- − Insurance
- −$645
- − Repairs & maintenance
- −$2,944
- − Management
- −$2,944
- − Depreciation
- −$3,753
- Taxable income
- $16,641
- Est. tax owed @ 24.0%
- −$3,994
- After-tax cash flow
- $13,668/yr
For passive investors: Depreciation is non-cash, so a rental often shows a tax loss while cash-flowing — sheltering income. Rental losses are passive: they offset passive income freely, and up to $25,000/yr can offset ordinary (W-2) income if you actively participate and your MAGI is under $100k (phasing out to $0 by $150k); unused losses carry forward. On sale, claimed depreciation is recaptured at up to 25%, and gains may owe capital-gains tax (a 1031 exchange can defer both). Figures are a year-1 estimate at your 24.0% rate — not tax advice; consult a CPA.
Schools (NCES district)
- District
- Humphreys County School District
- NCES district ID
- 2802040
- Math proficiency
- 3% ▼ -13.00%
- Reading proficiency
- 9% ▼ -5.00%
- Median HH income
- $25,369
- Composite
- 3.93/100
- National rank
- #10062
- State rank
- #128 of 130 in MS
Livability — Belzoni
- Score
- 59/100
- State rank
- #244
- US rank
- #20158
Category grades
Schools grade is shown separately in the Schools card above.
Census & demographics
- Census place
- Belzoni, MS
- Population (ZIP)
- 5,363
Population outlook (Humphreys County) Hauer SSP2
- Today (2025)
- 7,469 people
- By 2030
- 6,878 · -7.9%
- By 2040
- 5,784 · -22.6%
- By 2050
- 4,906 · -34.3%
- By 2075
- 3,775 · -49.5%
- By 2100
- 3,672 · -50.8%
Race, ethnicity, and origin ACS 2023
- Neighborhood character
- Predominantly Black (82%)
- Race & ethnicity
- Black 82% White 16%
- Common ancestry
- Lithuanian 1%
- Foreign-born
- 0%
- Languages at home
- 98% English-only · Spanish 1%
Political lean MEDSL · Humphreys
- 2024 margin
- Solid D (+41.9) · D 70.4% · R 28.6% · Other 1.0%
- 2008→2024 swing
- -0.5pp no change · 2008: 42.4pp · 2024: 41.9pp
- All cycles
- 2024: D+41.9 2020: D+45.3 2016: D+48.0 2012: D+52.0 2008: D+42.4
Not yet ingested
- Civics
- —
Market trends
- HPI YoY
- ▼ -4.37%
- Current HPI
- 116.4065
- Rent YoY
- —
- Metro
- —
- State GDP YoY
- —
- F500 in state
- 0
Price history
+0.0% since first listed6 events — show timeline
- 2026-01-22 Listed $129,000 MLSU
- 2025-12-29 Listing Removed — MLSU
- 2025-07-12 Price Changed $125,000 MLSU
- 2025-07-11 Relisted — MLSU
- 2025-03-31 Listing Removed — MLSU
- 2023-07-13 Listed $129,000 MLSU
Property tax history
+2.2%/yrLatest (2025): $2,650 · +24.2% YoY. Source: county tax records.
Cash-flow waterfall
monthlySold comps — $/sqft
last 12 mo · ≤1 miLoading sold comps…