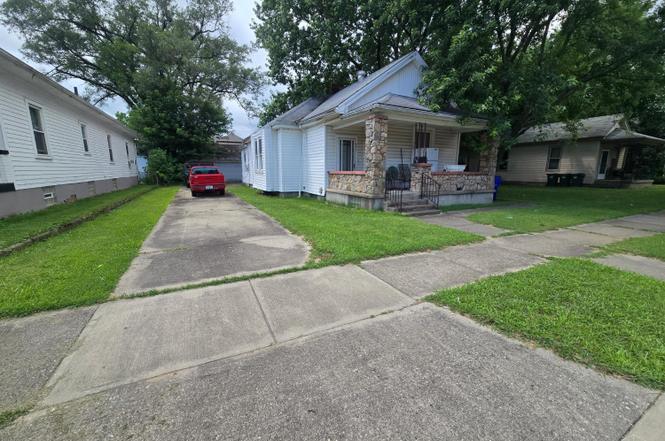
995 Kahn Ave · Hamilton, OH
Flood risk 7/10 · Major
- FEMA flood zone
- X (unshaded)
- Chance of flooding over 30 yrs
- 0.95%
- Est. flood insurance / yr
- $507 – $1,088
Fire risk 1/10 · Minimal
- Est. fire insurance / yr
- $713 – $1,323
Heat risk 4/10 · Minor
- Hot days now (above 104°F)
- 7 days/yr
- Hot days in 30 yrs
- 19 days/yr
Wind risk 2/10 · Minimal
- Chance of severe wind over 30 yrs
- 1.0%
Air-quality risk 3/10 · Minor
- Unhealthy air days now
- 2 days/yr
- Unhealthy air days in 30 yrs
- 3 days/yr
Risk factors via First Street. Map © Google.
Why this score? — see what drove the B grade
The composite is a weighted blend of 9 inputs, each scored 0–100. Each bar is that input's sub-score; the figure is the points it added to the 100-point composite (weight × sub-score).
- Cash flow +30.0/30.0
- 1% rule +10.0/10.0
- DSCR +10.0/10.0
- ARV discount +7.5/15.0
- Livability +3.7/5.0
- Schools +3.6/10.0
- Rent growth +3.2/5.0
- Condition / age +2.5/5.0
- Appreciation +0.0/10.0
$65,000
🖨 Deal sheet 📄 Offer letter ✓ Due diligence
Listing remarks
Amazing Opportunity! This comfortable-sized home offers endless possibilities for the imaginative buyer ready to make it their own. Just minutes from vibrant downtown Hamiltonwhere you can enjoy unique shopping, eclectic dining, lively entertainment, riverfront parks, and year-round festivals along the Great Miami River. Fast access to 129 for easy eastbound commutes makes it even better! Please note: The property is being sold as-is, where-is with no repairs to be made by the Seller. This home will only qualify for FHA/VA financing if paired with a construction/renovation loan. Offers will be reviewed by June 22, 2026, and the Seller reserves the right to accept the highest and best offer
Key facts
- 5,676 sq ft lot
- 2 garage spots
- Built 1900
Property features AI
Finance
- Other: Lease not considered
- HOA & community: No HOA
Exterior
- Parking: Detached oversized garage with two garage spaces; Driveway
- Utilities: Public water; Public sewer; Natural gas
- Home design: Traditional single-family home; One-and-a-half story layout; Residential zoning; Lot approximately 0.13 acre (less than 0.5 acre)
- Construction: Vinyl siding; Shingle roof; Poured foundation
- Exterior features: Vinyl windows
Interior
- Kitchen: Dining room adjacent to kitchen (main level)
- Bedrooms: Three bedrooms, all on the main level
- Bathrooms: One full bathroom on the main level
- Interior features: Six total rooms; Full unfinished basement
Neighborhood map
What this means for you Summary
Snapshot
- This is a 4-bed/1.0-bath single-family listed at $65k.
Deal economics
- At list price, monthly cash flow is $1k ($13k/yr) — positive.
- The deal already cash-flows at list — no discount required.
- Meets the 1% rule at list price ($2k rent vs $65k).
- Cap rate 27.3% vs local median 4.6% in Hamilton — top-decile yield for the area; either an underpriced asset or a hidden risk that comps aren't pricing in. Stress-test before assuming the spread holds.
Location & tenants
- Location reads 73/100 on livability (#332 in OH) — a middle-class / working-renter tenant base. Strengths: cost of living A+, housing A+, schools B; Watch: crime C-, amenities C-, employment D.
- Hamilton City (suburban): math 42% / reading 45% proficiency, ranked #517 of 656 in OH (top 79%) — families likely to look elsewhere, expect single-tenant / working-renter base with shorter leases; 63% free/reduced lunch — lower-income household profile, screen leases tightly.
- Market conditions: Rents rising (+3.0%/yr); 196 active listings in the ZIP; 8 comparable units currently listed for rent nearby; rentals lingering (median 44d on market — plan ~5-8 weeks vacancy on turnover, expect pricing pressure); 50% of comp listings sitting > 30 days — soft ceiling on asking rent; solid renter incomes; 1,163 units permitted in Butler County in 2024 (356 in 5+ unit buildings).
Forward outlook
- Local home prices are declining (-3.0%/yr); year-one equity from $449 of loan paydown is wiped out by about $2k of value loss. Plan a longer hold.
- At projected returns (-3.0% appreciation + 3.0% rent growth), your $18k cash investment doubles in ~2 years — after that, you're playing with house money.
Negotiation context
- Only 3 days on market — expect competitive offers; lowballing is unlikely to land.
Risks & watch-outs
- Watch-outs: flood insurance adds $66/mo; built in 1900 — expect roof / HVAC / electrical / plumbing capex.
- Climate carrying-cost: major flood risk — expect insurance premiums to compound above CPI over the hold.
Questions for the listing agent
- Built in 1900 — when were the roof, HVAC, electrical panel, plumbing, and water heater last replaced?
- What's the actual annual flood-insurance premium (NFIP or private), and is the property in a SFHA with mandatory coverage?
- Is there a deadline driving the sale (1031 exchange, divorce, estate, relocation)? That informs how much negotiation room exists.
- Schools are B-rated — typically a magnet for longer-tenancy family renters. What's the average tenant stay here, and is there a school-zone premium baked into asking?
- What's the average days-on-market for RENTAL listings here right now (not sales)? A rising rental-DOM trend means longer vacancies and softer asking-rent achievability than the comps imply.
- What's the recent tenant-quality profile in this submarket — average credit score on applications, eviction rate, late-payment / NSF rate, and stable-employment percentage? A property-management company in the area should have these aggregated.
- How much new for-sale + rental construction is in the pipeline within 1–3 miles? Heavy new supply typically softens prices + rents 12–24 months out; constrained supply supports both.
Investment metrics
- 1% rule
- 3.12% ✓
- Cap rate
- 27.32%
- Cash-on-cash
- 75.11%
- DSCR
- 4.34
- GRM
- 2.7
CMA / ARV
- ARV (on-the-fly)
- $161,588
- Comps found
- 12
Show comp detail 12 sales within ~0.75 mi
| Address | Dist | Beds/Ba | Sqft | Sold | Price | $/sf | Match |
|---|---|---|---|---|---|---|---|
| 927 Harmon Ave | 0.14mi | 3/1.0 (-1) | 1,402 (+1%) | 7mo | $70,000 | $50 | 81 |
| 1147 Shuler Ave | 0.18mi | 4/1.0 | 1,472 (+6%) | 5mo | $96,000 | $65 | 78 |
| 1135 Kahn Ave | 0.15mi | 3/2.0 (-1) | 1,247 (-10%) | 2mo | $195,500 | $157 | 65 |
| 130 Lulu | 0.34mi | 3/1.0 (-1) | 1,290 (-7%) | 2mo | $175,000 | $136 | 65 |
| 5 Michael Ave | 0.22mi | 3/2.0 (-1) | 1,488 (+7%) | 12mo | $210,000 | $141 | 59 |
| 1213 Vanderveer Ave | 0.62mi | 4/1.5 | 1,400 (+0%) | 12mo | $160,000 | $114 | 58 |
| 1495 Kahn Ave | 0.47mi | 5/1.5 (+1) | 1,455 (+4%) | 9mo | $150,000 | $103 | 57 |
| 1691 Ray Combs Ave | 0.48mi | 3/2.0 (-1) | 1,424 (+2%) | 12mo | $160,000 | $112 | 55 |
| 602 S Thirteenth St | 0.40mi | 3/1.5 (-1) | 1,270 (-9%) | 6mo | $68,000 | $54 | 54 |
| 1113 Grand Blvd | 0.62mi | 4/1.5 | 1,298 (-7%) | 8mo | $150,000 | $116 | 50 |
| 135 Linda Ln | 0.32mi | 3/2.0 (-1) | 1,570 (+13%) | 7mo | $288,600 | $184 | 49 |
| 349 Hastings Ave | 0.32mi | 3/2.0 (-1) | 1,600 (+15%) | 7mo | $205,000 | $128 | 46 |
Match score weights: distance 35% · size 25% · config 20% · recency 20%. Top-matched comps best support the ARV.
Projected returns pro-forma
-3.0% appreciation · 2.95% rent growth · sell at horizon
- IRR
- 70.3%
- Equity multiple
- 4.17×
- Total profit
- $57,766
- Equity at exit
- $9,692
- IRR
- 74.3%
- Equity multiple
- 8.59×
- Total profit
- $138,181
- Equity at exit
- $5,620
Cash invested: $18,200 (down + closing). Projections, not guarantees.
Landlord ↔ Tenant lean methodology
- Overall (STATE)
- 73 Landlord-Friendly
- State Ohio
- 73 Landlord-Friendly · R+6
- County
- — inherits STATE
- City
- — inherits STATE
ZIP-level market 45011
- Rents YoY
- 3.0%
- Active inventory
- 196
- Price-to-rent
- 2.7×
Monthly cashflow live
- Estimated rent
- $2,027 high interval (Pro) →
- Mortgage (P&I)
- −$341
- Tax from tax record
- −$94 /mo · $1,128/yr
- Insurance
- −$27
- Flood insurance flood zone
- −$66 /mo · $798/yr
- HOA
- −$0
- Vacancy / Maint / Mgmt
- −$426
- Net cashflow
- $1,073
Break-even live
UW: 25.0% down · 7.5% · 30yr · 1.5% tax · 5.0% vac · 8.0% maint · 8.0% mgmt
Financing live
Cash to close
- Down payment
- $16,250
- Closing costs
- $1,950
- Reserves months
- —
- Total cash needed
- —
Loan-product check · same deal, 3 products live
Conventional
25% down · 7.5% · 30yr
- Down + closing
- —
- Monthly P&I
- —
- Monthly cashflow
- —
- DSCR
- —
- Eligible?
- —
Personal DTI + credit; lowest rate.
DSCR
20% down · 8.5% · 30yr
- Down + closing
- —
- Monthly P&I
- —
- Monthly cashflow
- —
- DSCR
- —
- Eligible?
- —
No personal income docs; deal must DSCR.
Hard money
10% down · 12.0% · 12mo
- Down + closing
- —
- Monthly P&I
- —
- Monthly cashflow
- —
- DSCR
- —
- Eligible?
- —
Short-term bridge; refi at stabilization.
Rent comps 8 comps
| Address | Beds | Baths | Sqft | Rent | $/sqft | DOM | Units | Dist |
|---|---|---|---|---|---|---|---|---|
| 967 Shuler Ave Hamilton, OH | 3.0 | 2.0 | 1466 | $1,795 | $1.22 | 44d | 1 | 0.09mi |
| 969 Harmon Ave Hamilton, OH | 3.0 | 1.0 | 1350 | $1,695 | $1.26 | 44d | 1 | 0.15mi |
| 1794 See Ave Hamilton, OH | 3.0 | 1.0 | 1272 | $1,800 | $1.42 | 10d | 1 | 0.62mi |
| 829 Maple Ave Unit 3 Hamilton, OH | 3.0 | 1.0 | 1097 | $945 | $0.86 | 44d | 1 | 0.79mi |
| 1008 Fairview Ave Hamilton, OH | 3.0 | 1.0 | 1080 | $1,600 | $1.48 | 2d | 1 | 1.15mi |
| 306 N 6th St Hamilton, OH | 3.0 | 1.5 | 1776 | $1,975 | $1.11 | 44d | 1 | 1.15mi |
| 906 Vine St Hamilton, OH | 3.0 | 2.0 | 1152 | $1,250 | $1.09 | 19d | 1 | 1.24mi |
| 1719 Shirley Ave Hamilton, OH | 3.0 | 1.0 | 1135 | $1,525 | $1.34 | 2d | 1 | 1.47mi |
Listing history 4 events
-
2026-06-18days on market $65,000 Active 3 DOM
-
2026-06-17days on market $65,000 Active 2 DOM
-
2026-06-16remarks 699-char remark
-
2026-06-16$65,000 Active 1 DOM
ⓘ Source: listings_history table (triggers on properties + properties_extension) + one-shot
backfill from property_details.listing_events for pre-trigger history.
Tax reassessment forecast OH · Partial reset (capped growth)
- Current annual tax
- $1,128 · $94/mo
- Projected year-2 tax
- $1,128 · $94/mo
- Expected delta
- $0/yr ($0/mo · 0.0%)
ⓘ Screening estimate from a state-policy table — verify with the county assessor before closing.
Climate risk First Street
- Flood 7/10 Severe FEMA zone X (unshaded) · 95% chance over 30 yrs
- Wildfire 1/10 Low
- Heat 4/10 Moderate 7 d/yr ≥104°F today · 19 d/yr by 30 yrs out
- Wind 2/10 Low 100% chance of damaging wind over 30 yrs
- Air quality 3/10 Moderate 2 unhealthy d/yr today · 3 by 30 yrs out
Nearby sold comps map
Loading sold comps map…
Walkable amenities ~0.75 mi
Loading nearby amenities…
Taxation est. · year 1
- Rental income
- $24,321
- − Mortgage interest
- −$3,641
- − Property taxes
- −$1,128
- − Insurance
- −$1,122
- − Repairs & maintenance
- −$1,946
- − Management
- −$1,946
- − Depreciation
- −$1,891
- Taxable income
- $12,647
- Est. tax owed @ 24.0%
- −$3,035
- After-tax cash flow
- $9,837/yr
For passive investors: Depreciation is non-cash, so a rental often shows a tax loss while cash-flowing — sheltering income. Rental losses are passive: they offset passive income freely, and up to $25,000/yr can offset ordinary (W-2) income if you actively participate and your MAGI is under $100k (phasing out to $0 by $150k); unused losses carry forward. On sale, claimed depreciation is recaptured at up to 25%, and gains may owe capital-gains tax (a 1031 exchange can defer both). Figures are a year-1 estimate at your 24.0% rate — not tax advice; consult a CPA.
Schools (NCES district)
- District
- Hamilton City
- NCES district ID
- 3904410
- Math proficiency
- 42% ▼ -13.00%
- Reading proficiency
- 45% ▼ -10.00%
- Median HH income
- $40,488
- Composite
- 36.48/100
- National rank
- #4656
- State rank
- #517 of 656 in OH
Livability — Hamilton
- Score
- 73/100
- State rank
- #332
- US rank
- #5467
Category grades
Schools grade is shown separately in the Schools card above.
Census & demographics
- Census place
- Hamilton, OH
- County
- Butler County · 381,674 people
- City population
- 140,900
- Metro
- Cincinnati, OH-KY-IN
- Population (ZIP)
- 75,864
- Household income
- $91,873
- Rent vs Own
- Severe rent burden
- 1795.0
Population outlook (Butler County) Hauer SSP2
- Today (2025)
- 387,706 people
- By 2030
- 392,028 · +1.1%
- By 2040
- 395,307 · +2.0%
- By 2050
- 391,116 · +0.9%
- By 2075
- 378,642 · -2.3%
- By 2100
- 343,248 · -11.5%
Race, ethnicity, and origin ACS 2023
- Neighborhood character
- Predominantly White (68%)
- Race & ethnicity
- White 68% Hispanic / Latino 12% Black 11% Two or more races 9% Asian 4%
- Hispanic origin (detail)
- Mexican 7%
- Common ancestry
- Romanian 2% Italian 2% Slovak 2%
- Foreign-born
- 11% · Canada, Vietnam, China
- Languages at home
- 86% English-only · Spanish 8% Other Indo-European 2% Vietnamese 1%
Political lean MEDSL · Butler
- 2024 margin
- Strong R (+26.3) · D 36.4% · R 62.7%
- 2008→2024 swing
- -3.6pp toward R · 2008: -22.6pp · 2024: -26.3pp
- All cycles
- 2024: R+26.3 2020: R+24.0 2016: R+28.3 2012: R+26.2 2008: R+22.6
Not yet ingested
- Civics
- —
Market trends
- HPI YoY
- ▼ -188.67%
- Current HPI
- 259.7868
- Rent YoY
- ▲ 2.95%
- Metro
- Cincinnati, OH-KY-IN
- State GDP YoY
- ▲ 1.98%
- F500 in state
- 48
Industry mix (Fortune 500 HQ in OH)
| Industry | F500 HQs | Revenue |
|---|---|---|
| Insurance | 3 | $145B |
|
||
| Industrial Machinery | 3 | $49B |
|
||
| Financial Services | 3 | $24B |
|
||
| Consumer Goods | 2 | $93B |
|
||
| Aerospace / Defense | 2 | $47B |
|
||
| Utilities | 2 | $33B |
|
||
Price history
1 event — show timeline
- 2026-06-14 Listed $65,000 Cincy MLS
Property tax history
+2.0%/yrLatest (2025): $1,128 · +0.5% YoY. Source: county tax records.
Cash-flow waterfall
monthlySold comps — $/sqft
last 12 mo · ≤1 miLoading sold comps…