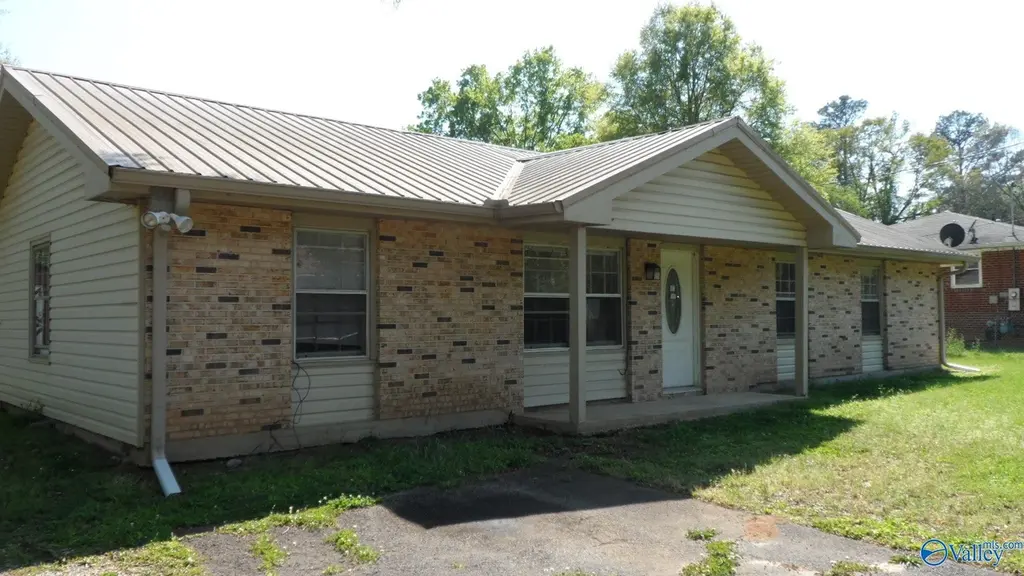
2013 Roberson St SW · Jacksonville, AL
Flood risk 1/10 · Minimal
- FEMA flood zone
- X (unshaded)
- Chance of flooding over 30 yrs
- 0.0%
- Est. flood insurance / yr
- $507 – $1,088
Fire risk 4/10 · Minor
- Est. fire insurance / yr
- $916 – $1,700
Heat risk 6/10 · Moderate
- Hot days now (above 106°F)
- 7 days/yr
- Hot days in 30 yrs
- 21 days/yr
Wind risk 5/10 · Moderate
- Chance of severe wind over 30 yrs
- 25.0%
Air-quality risk 3/10 · Minor
- Unhealthy air days now
- 2 days/yr
- Unhealthy air days in 30 yrs
- 3 days/yr
Risk factors via First Street. Map © Google.
Why this score? — see what drove the B grade
The composite is a weighted blend of 9 inputs, each scored 0–100. Each bar is that input's sub-score; the figure is the points it added to the 100-point composite (weight × sub-score).
- Cash flow +27.6/30.0
- ARV discount +15.0/15.0
- DSCR +9.7/10.0
- 1% rule +6.3/10.0
- Rent growth +3.9/5.0
- Livability +3.5/5.0
- Schools +3.4/10.0
- Condition / age +2.5/5.0
- Appreciation +0.0/10.0
$120,000
🖨 Deal sheet (PDF) 📄 Offer letter ✓ Due diligence
Listing remarks MLS
Lovely one level 3 bedroom, 2 full bath brick home centrally located in Jacksonville near shopping, JSU, and restaurants. Neutral paint colors and floors throughout. Large fenced-in yard with a covered patio. HVAC replaced in 2018 and water heater in 2019.
Key facts
- Brick rancher
- Level yard
- Living room
Tags
Property features AI
Finance
- HOA & community: No homeowners association; Subdivision: Metes And Bounds
Exterior
- Parking: Paved/asphalt driveway
- Utilities: Public water
- Home design: Single-family residence; One level; Residential property; Not new construction
- Construction: Slab foundation
- Exterior features: Covered porch
Interior
- Bathrooms: 2 full bathrooms
- Heating & cooling: Central heating; Central cooling
- Interior features: Covered porch
Neighborhood map
What this means for you Summary
Snapshot
- This is a 3-bed/1.0-bath single-family listed at $120k.
Deal economics
- At list price, monthly cash flow is $359 ($4k/yr) — positive.
- The deal already cash-flows at list — no discount required.
- Meets the 1% rule at list price ($1k rent vs $120k).
- Recommended offer: $116k (3.0% below list) — sets the bar for market timing.
- Cap rate 9.9% vs local median 3.6% in Jacksonville — top-decile yield for the area; either an underpriced asset or a hidden risk that comps aren't pricing in. Stress-test before assuming the spread holds.
Location & tenants
- Location reads 70/100 on livability (#41 in AL) — a middle-class / working-renter tenant base. Strengths: cost of living A+, health & safety A+, housing A-; Watch: crime F, amenities F, commute F.
- Jacksonville City (urban): math 23% / reading 60% proficiency, ranked #24 of 129 in AL (top 19%) — families likely to look elsewhere, expect single-tenant / working-renter base with shorter leases.
- Zoned schools: Kitty Stone Elementary School (math 29% / reading 64%, grade D-, #159 of 627 statewide, top 26%, 970 students, 65% FRL); Jacksonville High School (math 16% / reading 54%, grade F, #46 of 305 statewide, top 15%, 782 students, 59% FRL) — zoned schools average 62% FRL vs 44% district-wide (18 pts higher); higher-poverty schools than district average — tighter screening recommended.
- Market conditions: Rents rising fast (+5.6%/yr); 91 active listings in the ZIP; 4 comparable units currently listed for rent nearby; rentals lingering (median 45d on market — plan ~5-8 weeks vacancy on turnover, expect pricing pressure); 100% of comp listings sitting > 30 days — soft ceiling on asking rent; 135 units permitted in Calhoun County in 2024 (0 in 5+ unit buildings).
Forward outlook
- Local home prices are declining (-3.0%/yr); year-one equity from $830 of loan paydown is wiped out by about $4k of value loss. Plan a longer hold.
- Calhoun County population projected at -21% by 2050 — secular population decline; favor cash flow + early exit over multi-decade hold.
- At projected returns (-3.0% appreciation + 5.6% rent growth), your $34k cash investment doubles in ~8 years — after that, you're playing with house money.
Negotiation context
- It's been on market 52 days — a 3% lower offer ($116k) is reasonable based on typical stale-listing flexibility.
- 3 sale attempts since 13y ago; this cycle's ask has dropped $39k (25%) from the opening price — seller is motivated, your offer sets the floor, not the list.
Risks & watch-outs
- Climate carrying-cost: moderate wind risk, 25% chance of damaging wind over 30y; extreme-heat days projected 7→21/yr by 2055 (HVAC capex compounding) — expect insurance premiums to compound above CPI over the hold.
Questions for the listing agent
- It's been on market 52 days. Have you received any prior offers? Is the seller open to a 3% concession, seller financing, or rate buy-down credit?
- Built in 1976 — when were the roof, HVAC, electrical panel, plumbing, and water heater last replaced?
- Is there a deadline driving the sale (1031 exchange, divorce, estate, relocation)? That informs how much negotiation room exists.
- Schools are B-rated — typically a magnet for longer-tenancy family renters. What's the average tenant stay here, and is there a school-zone premium baked into asking?
- Crime grade is F in this area — have there been break-ins, vandalism, or insurance claims at this property in the last 3 years? What carrier currently insures it and at what premium?
- What's the average days-on-market for RENTAL listings here right now (not sales)? A rising rental-DOM trend means longer vacancies and softer asking-rent achievability than the comps imply.
- What's the recent tenant-quality profile in this submarket — average credit score on applications, eviction rate, late-payment / NSF rate, and stable-employment percentage? A property-management company in the area should have these aggregated.
- How much new for-sale + rental construction is in the pipeline within 1–3 miles? Heavy new supply typically softens prices + rents 12–24 months out; constrained supply supports both.
Investment metrics
- 1% rule
- 1.13% ✓
- Cap rate
- 9.88%
- Cash-on-cash
- 12.82%
- DSCR
- 1.57
- GRM
- 7.4
CMA / ARV
- ARV (median comp)
- $145,620
- List price
- $120,000
- Delta
- -17.59%
- Verdict
- UNDERPRICED
- Comps
- 20 within 1.0 mi
Show comp detail 12 sales within ~0.75 mi
| Address | Dist | Beds/Ba | Sqft | Sold | Price | $/sf | Match |
|---|---|---|---|---|---|---|---|
| 917 Mitchell Dr SW | 0.14mi | 3/1.0 | 1,230 (-5%) | 2mo | $75,000 | $61 | 83 |
| 1001 SW Kay Dr | 0.25mi | 2/1.0 (-1) | 1,296 (0%) | 4mo | $61,000 | $47 | 80 |
| 925 Henry Ct SW | 0.42mi | 3/2.0 | 1,286 (-1%) | 7mo | $170,000 | $132 | 69 |
| 628 Alexandria Rd | 0.36mi | 3/2.0 | 1,275 (-2%) | 10mo | $245,000 | $192 | 68 |
| 260 Greenleaf St SW | 0.14mi | 3/2.0 | 1,154 (-11%) | 10mo | $133,000 | $115 | 63 |
| 79 C St SW | 0.35mi | 3/2.0 | 1,403 (+8%) | 6mo | $135,000 | $96 | 61 |
| 200 Church Hill Pl SE | 0.49mi | 2/2.0 (-1) | 1,327 (+2%) | 4mo | $195,000 | $147 | 61 |
| 908 Ivan Dr SW | 0.30mi | 3/2.0 | 1,442 (+11%) | 5mo | $108,000 | $75 | 59 |
| 1204 Quail Run Dr SW | 0.70mi | 3/2.0 | 1,298 (+0%) | 6mo | $179,700 | $138 | 58 |
| 920 Henry Ct SW | 0.36mi | 3/2.5 | 1,396 (+8%) | 8mo | $182,500 | $131 | 57 |
| 217 Belmont Cir SE | 0.52mi | 2/2.0 (-1) | 1,192 (-8%) | 4mo | $195,000 | $164 | 50 |
| 201 Church Hill Pl SE | 0.50mi | 2/2.0 (-1) | 1,374 (+6%) | 10mo | $199,900 | $145 | 49 |
Match score weights: distance 35% · size 25% · config 20% · recency 20%. Top-matched comps best support the ARV.
Projected returns pro-forma
-3.0% appreciation · 5.6% rent growth · sell at horizon
- IRR
- 5.2%
- Equity multiple
- 1.21×
- Total profit
- $7,008
- Equity at exit
- $17,892
- IRR
- 16.7%
- Equity multiple
- 2.52×
- Total profit
- $51,113
- Equity at exit
- $10,375
Cash invested: $33,600 (down + closing). Projections, not guarantees.
Landlord ↔ Tenant lean methodology
- Overall (STATE)
- 90 Strongly Landlord-Friendly
- State Alabama
- 90 Strongly Landlord-Friendly · R+15
- County
- — inherits STATE
- City
- — inherits STATE
ZIP-level market 36265
- Home prices YoY
- -26.1%
- Rents YoY
- 5.6%
- Active inventory
- 91
- Price-to-rent
- 7.4×
Monthly cashflow live
- Estimated rent
- $1,359 medium interval (Pro) →
- Mortgage (P&I)
- −$629
- Tax from tax record
- −$35 /mo · $421/yr
- Insurance
- −$50
- HOA
- −$0
- Vacancy / Maint / Mgmt
- −$285
- Net cashflow
- $359
Break-even live
Sensitivity live
| Price | -10% $427 | -5% $393 | +0% $359 | +5% $325 | +10% $291 |
|---|---|---|---|---|---|
| Rent | -10% $252 | -5% $305 | +0% $359 | +5% $413 | +10% $466 |
| Rate | -1.0pp $419 | -0.5pp $389 | base $359 | +0.5pp $328 | +1.0pp $296 |
UW: 25.0% down · 7.5% · 30yr · 1.5% tax · 5.0% vac · 8.0% maint · 8.0% mgmt
Financing live
Cash to close
- Down payment
- $30,000
- Closing costs
- $3,600
- Reserves months
- —
- Total cash needed
- —
Loan-product check · same deal, 3 products live
Conventional
25% down · 7.5% · 30yr
- Down + closing
- —
- Monthly P&I
- —
- Monthly cashflow
- —
- DSCR
- —
- Eligible?
- —
Personal DTI + credit; lowest rate.
DSCR
20% down · 8.5% · 30yr
- Down + closing
- —
- Monthly P&I
- —
- Monthly cashflow
- —
- DSCR
- —
- Eligible?
- —
No personal income docs; deal must DSCR.
Hard money
10% down · 12.0% · 12mo
- Down + closing
- —
- Monthly P&I
- —
- Monthly cashflow
- —
- DSCR
- —
- Eligible?
- —
Short-term bridge; refi at stabilization.
Rent comps 4 comps
| Address | Beds | Baths | Sqft | Rent | $/sqft | DOM | Units | Dist |
|---|---|---|---|---|---|---|---|---|
| 211 Bundrum Dr NW Unit 1 Jacksonville, AL | 3.0 | 3.0 | 1300 | $1,900 | $1.46 | 45d | 1 | 1.07mi |
| 7030 Alexandria-Jacksonville Hwy Unit 18 Jacksonville, AL | 2.0 | 2.0 | 900 | $925 | $1.03 | 45d | 1 | 1.11mi |
| 1585 Church Ave SE Jacksonville, AL | 1.0–3.0 | 1.0 | 865 | $850 | $0.98 | 45d | 1 | 1.19mi |
| 204 Alabama St NW Unit 204 Jacksonville, AL | 2.0 | 2.0 | 900 | $1,350 | $1.50 | 45d | 1 | 1.47mi |
Listing history 19 events
-
2026-06-14statusdays on market $120,000 Pending 52 DOM
-
2026-06-13days on market $120,000 Active 51 DOM
-
2026-06-10days on market $120,000 Active 49 DOM
-
2026-06-09pricedays on market $120,000 Active 48 DOM
-
2026-06-08days on market $159,000 Active 47 DOM
-
2026-06-07days on market $159,000 Active 46 DOM
-
2026-06-05days on market $159,000 Active 43 DOM
-
2026-06-02days on market $159,000 Active 41 DOM
-
2026-06-01days on market $159,000 Active 40 DOM
-
2026-05-31days on market $159,000 Active 39 DOM
-
2026-05-30days on market $159,000 Active 38 DOM
-
2026-04-23$159,000 Active 219-char remark
-
2023-06-20soldstatus $130,000
-
2023-06-09soldstatus $130,000 Sold 256-char remark
Show marketing remark (256 chars)
Lovely one level 3 bedroom, 2 full bath brick home centrally located in Jacksonville near shopping, JSU, and restaurants. Neutral paint colors and floors throughout. Large fenced-in yard with a covered patio. HVAC replaced in 2018 and water heater in 2019.
-
2023-05-09historical Contingent 256-char remark
Show marketing remark (256 chars)
Lovely one level 3 bedroom, 2 full bath brick home centrally located in Jacksonville near shopping, JSU, and restaurants. Neutral paint colors and floors throughout. Large fenced-in yard with a covered patio. HVAC replaced in 2018 and water heater in 2019.
-
2023-04-28price $139,900 256-char remark
Show marketing remark (256 chars)
Lovely one level 3 bedroom, 2 full bath brick home centrally located in Jacksonville near shopping, JSU, and restaurants. Neutral paint colors and floors throughout. Large fenced-in yard with a covered patio. HVAC replaced in 2018 and water heater in 2019.
-
2023-04-14$149,900 Active 256-char remark
Show marketing remark (256 chars)
Lovely one level 3 bedroom, 2 full bath brick home centrally located in Jacksonville near shopping, JSU, and restaurants. Neutral paint colors and floors throughout. Large fenced-in yard with a covered patio. HVAC replaced in 2018 and water heater in 2019.
-
2013-10-30soldstatus $50,000
Show marketing remark (246 chars)
3 bedroom 2 bath home located in Jacksonville. 1 side brick and vinyl siding, fenced in yard with extra lot, new gutters and vinyl siding, metal roof, 2 storage building. Stove and refrigerator 5 years old per owner, laundry room, eat in kitchen.
-
2013-09-06$55,000
Show marketing remark (246 chars)
3 bedroom 2 bath home located in Jacksonville. 1 side brick and vinyl siding, fenced in yard with extra lot, new gutters and vinyl siding, metal roof, 2 storage building. Stove and refrigerator 5 years old per owner, laundry room, eat in kitchen.
ⓘ Source: listings_history table (triggers on properties + properties_extension) + one-shot
backfill from property_details.listing_events for pre-trigger history.
Tax reassessment forecast AL · Resets to sale price
- Current annual tax
- $421 · $35/mo
- Projected year-2 tax
- $492 · $41/mo
- Expected delta
- +$71/yr (+$6/mo · 16.8%)
ⓘ Screening estimate from a state-policy table — verify with the county assessor before closing.
Climate risk First Street
- Flood 1/10 Low FEMA zone X (unshaded) · 0% chance over 30 yrs
- Wildfire 4/10 Moderate
- Heat 6/10 Major 7 d/yr ≥106°F today · 21 d/yr by 30 yrs out
- Wind 5/10 Major 25% chance of damaging wind over 30 yrs
- Air quality 3/10 Moderate 2 unhealthy d/yr today · 3 by 30 yrs out
Nearby sold comps map
Loading sold comps map…
Walkable amenities ~0.75 mi
Loading nearby amenities…
Taxation est. · year 1
- Rental income
- $16,303
- − Mortgage interest
- −$6,722
- − Property taxes
- −$421
- − Insurance
- −$600
- − Repairs & maintenance
- −$1,304
- − Management
- −$1,304
- − Depreciation
- −$3,491
- Taxable income
- $2,460
- Est. tax owed @ 24.0%
- −$590
- After-tax cash flow
- $3,716/yr
For passive investors: Depreciation is non-cash, so a rental often shows a tax loss while cash-flowing — sheltering income. Rental losses are passive: they offset passive income freely, and up to $25,000/yr can offset ordinary (W-2) income if you actively participate and your MAGI is under $100k (phasing out to $0 by $150k); unused losses carry forward. On sale, claimed depreciation is recaptured at up to 25%, and gains may owe capital-gains tax (a 1031 exchange can defer both). Figures are a year-1 estimate at your 24.0% rate — not tax advice; consult a CPA.
Schools (NCES district)
- District
- Jacksonville City
- NCES district ID
- 0101860
- Math proficiency
- 23% ▼ -37.00%
- Reading proficiency
- 60% ▲ 1.00%
- Median HH income
- $37,233
- Composite
- 34.37/100
- National rank
- #5215
- State rank
- #24 of 129 in AL
Livability — Jacksonville
- Score
- 70/100
- State rank
- #41
- US rank
- #7385
Category grades
Schools grade is shown separately in the Schools card above.
Census & demographics
- Census place
- Jacksonville, AL
- County
- Calhoun County · 71,763 people
- City population
- 22,452
- Metro
- Anniston-Oxford, AL
- Population (ZIP)
- 22,452
- Household income
- $55,294
- Rent vs Own
- Severe rent burden
- 476.0
Population outlook (Calhoun County) Hauer SSP2
- Today (2025)
- 109,765 people
- By 2030
- 105,708 · -3.7%
- By 2040
- 96,192 · -12.4%
- By 2050
- 86,413 · -21.3%
- By 2075
- 63,467 · -42.2%
- By 2100
- 44,704 · -59.3%
Race, ethnicity, and origin ACS 2023
- Neighborhood character
- Predominantly White (75%)
- Race & ethnicity
- White 75% Black 15% Two or more races 4% Hispanic / Latino 4%
- Common ancestry
- Slovak 3% Serbian 2% Italian 2%
- Foreign-born
- 1% · Canada
- Languages at home
- 98% English-only · Spanish 1%
Political lean MEDSL · Calhoun
- 2024 margin
- Solid R (+44.8) · D 27.2% · R 71.9%
- 2008→2024 swing
- -12.2pp toward R · 2008: -32.5pp · 2024: -44.8pp
- All cycles
- 2024: R+44.8 2020: R+39.0 2016: R+41.4 2012: R+31.9 2008: R+32.5
Not yet ingested
- Civics
- —
Market trends
- HPI YoY
- ▼ -59.38%
- Current HPI
- 167.7493
- Rent YoY
- ▲ 5.60%
- Metro
- Anniston-Oxford, AL
- State GDP YoY
- ▲ 2.94%
- F500 in state
- 4
Industry mix (Fortune 500 HQ in AL)
| Industry | F500 HQs | Revenue |
|---|---|---|
| Financial Services | 1 | $8B |
|
||
| Healthcare | 1 | $5B |
|
||
Price history
+118.2% since first listed10 events — show timeline
- 2026-06-13 Pending — VMLS
- 2026-06-09 Price Changed $120,000 VMLS
- 2026-04-23 Listed $159,000 VMLS
- 2023-06-20 Sold (Public Records) $130,000 Public Records
- 2023-06-09 Sold (MLS) $130,000 Greater Alabama MLS
- 2023-05-09 Contingent — Greater Alabama MLS
- 2023-04-28 Price Changed $139,900 Greater Alabama MLS
- 2023-04-14 Listed $149,900 Greater Alabama MLS
- 2013-10-30 Sold (MLS) $50,000 Greater Alabama MLS
- 2013-09-06 Listed $55,000 Greater Alabama MLS
Property tax history
-4.5%/yrLatest (2025): $421 · +0.0% YoY. Source: county tax records.
Cash-flow waterfall
monthlySold comps — $/sqft
last 12 mo · ≤1 miLoading sold comps…