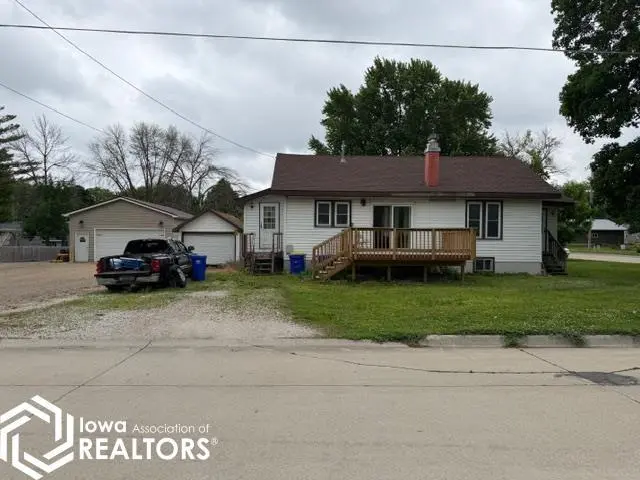
488 3rd Ave SW · Britt, IA
Flood risk 1/10 · Minimal
- FEMA flood zone
- X (unshaded)
- Chance of flooding over 30 yrs
- 0.0%
- Est. flood insurance / yr
- $473 – $860
Fire risk 1/10 · Minimal
- Est. fire insurance / yr
- $902 – $1,676
Heat risk 2/10 · Minimal
- Hot days now (above 99°F)
- 7 days/yr
- Hot days in 30 yrs
- 16 days/yr
Wind risk 2/10 · Minimal
- Chance of severe wind over 30 yrs
- —
Air-quality risk 1/10 · Minimal
- Unhealthy air days now
- 0 days/yr
- Unhealthy air days in 30 yrs
- 0 days/yr
Risk factors via First Street. Map © Google.
Why this score? — see what drove the A- grade
The composite is a weighted blend of 9 inputs, each scored 0–100. Each bar is that input's sub-score; the figure is the points it added to the 100-point composite (weight × sub-score).
- Cash flow +30.0/30.0
- 1% rule +10.0/10.0
- DSCR +10.0/10.0
- Appreciation +10.0/10.0
- ARV discount +7.5/15.0
- Schools +6.3/10.0
- Livability +4.0/5.0
- Rent growth +2.5/5.0
- Condition / age +2.5/5.0
$30,000
🖨 Deal sheet (PDF) 📄 Offer letter ✓ Due diligence
Listing remarks
Seller is Selling Property in "AS IS" Condition. Deck new 2025, south side of roof just a couple of years old and newer central air.
Key facts
- Deck new 2025
- Newer central air
- 5,227 sq ft lot
Tags
Property features AI
Exterior
- Parking: Detached gravel garage with 1 garage space
- Utilities: Public water; Public sewer
- Home design: Single-family residence; Residential property
- Construction: Vinyl siding
- Exterior features: Lot approximately 0.12 acres (66 x 76)
Interior
- Bathrooms: 1 full bathroom
- Heating & cooling: Central air conditioning; Forced air heating; Basement present
- Interior features: Fireplace (1)
Neighborhood map
What this means for you Summary
Snapshot
- This is a 2-bed/1.0-bath single-family listed at $30k.
Deal economics
- At list price, monthly cash flow is $524 ($6k/yr) — positive.
- The deal already cash-flows at list — no discount required.
- Meets the 1% rule at list price ($978 rent vs $30k).
Location & tenants
- Location reads 79/100 on livability (#121 in IA, #2,262 nationally) — a middle-class / working-renter tenant base. Strengths: crime A+, cost of living A+, housing A+; Watch: amenities F, commute F.
- West Hancock Community School District (rural): math 76% / reading 74% proficiency, ranked #77 of 289 in IA (top 27%) — strong family-tenant draw, lease renewals of 3-5y typical.
- Market conditions: 22 active listings in the ZIP; 11 units permitted in Hancock County in 2024 (0 in 5+ unit buildings).
Forward outlook
- In year one you build about $3k of equity ($207 loan paydown + $3k appreciation (10.0% local appreciation)).
- Hancock County population projected at -14% by 2050 — secular population decline; favor cash flow + early exit over multi-decade hold.
- At projected returns (10.0% appreciation + 3.0% rent growth), your $8k cash investment doubles in ~1 year — after that, you're playing with house money.
- By year 9, paydown + projected appreciation supports a ~$33k cash-out refi (75% LTV) — recoverable capital for the next deal without selling this one.
Negotiation context
- Only 5 days on market — expect competitive offers; lowballing is unlikely to land.
Risks & watch-outs
- Watch-outs: property tax is 3.2% of price; built in 1920 — expect roof / HVAC / electrical / plumbing capex.
Questions for the listing agent
- Built in 1920 — when were the roof, HVAC, electrical panel, plumbing, and water heater last replaced?
- Property tax is high relative to price — has the assessment been appealed recently, and will the sale trigger a re-assessment?
- Is there a deadline driving the sale (1031 exchange, divorce, estate, relocation)? That informs how much negotiation room exists.
- Schools are B-rated — typically a magnet for longer-tenancy family renters. What's the average tenant stay here, and is there a school-zone premium baked into asking?
- What's the average days-on-market for RENTAL listings here right now (not sales)? A rising rental-DOM trend means longer vacancies and softer asking-rent achievability than the comps imply.
- What's the recent tenant-quality profile in this submarket — average credit score on applications, eviction rate, late-payment / NSF rate, and stable-employment percentage? A property-management company in the area should have these aggregated.
- How much new for-sale + rental construction is in the pipeline within 1–3 miles? Heavy new supply typically softens prices + rents 12–24 months out; constrained supply supports both.
Investment metrics
- 1% rule
- 3.26% ✓
- Cap rate
- 27.25%
- Cash-on-cash
- 74.84%
- DSCR
- 4.33
- GRM
- 2.6
CMA / ARV
- ARV (on-the-fly)
- $97,344
- Comps found
- 12
Show comp detail 12 sales within ~0.75 mi
| Address | Dist | Beds/Ba | Sqft | Sold | Price | $/sf | Match |
|---|---|---|---|---|---|---|---|
| 326 1st St NW | 0.38mi | 2/1.0 | 975 (-4%) | 0mo | $60,000 | $62 | 76 |
| 830 5th Ave SW | 0.24mi | 3/1.0 (+1) | 1,092 (+8%) | 5mo | $160,000 | $147 | 67 |
| 660 2nd St SW | 0.29mi | 3/1.0 (+1) | 1,008 (-1%) | 17mo | $97,000 | $96 | 67 |
| 364 4th St SW | 0.07mi | 3/1.0 (+1) | 880 (-13%) | 6mo | $50,000 | $57 | 65 |
| 619 Main Ave S | 0.23mi | 2/1.0 | 1,116 (+10%) | 9mo | $75,000 | $67 | 65 |
| 114 5th St SE | 0.27mi | 2/1.0 | 1,088 (+7%) | 17mo | $95,000 | $87 | 61 |
| 416 6th St SW | 0.08mi | 2/2.0 | 1,120 (+10%) | 17mo | $133,000 | $119 | 60 |
| 566 2nd Ave SW | 0.08mi | 3/1.5 (+1) | 1,127 (+11%) | 13mo | $115,000 | $102 | 60 |
| 160 6th St SW | 0.12mi | 2/2.0 | 1,155 (+14%) | 11mo | $163,500 | $142 | 58 |
| 255 Center St W | 0.29mi | 3/2.0 (+1) | 1,144 (+13%) | 1mo | $51,000 | $45 | 55 |
| 585 6th Ave SE | 0.59mi | 2/1.0 | 911 (-10%) | 16mo | $129,000 | $142 | 43 |
| 545 1st St SE | 0.58mi | 3/1.5 (+1) | 880 (-13%) | 20mo | $42,000 | $48 | 28 |
Match score weights: distance 35% · size 25% · config 20% · recency 20%. Top-matched comps best support the ARV.
Projected returns pro-forma
10.0% appreciation · 3.0% rent growth · sell at horizon
- IRR
- 85.3%
- Equity multiple
- 6.92×
- Total profit
- $49,744
- Equity at exit
- $27,026
- IRR
- 79.8%
- Equity multiple
- 15.33×
- Total profit
- $120,331
- Equity at exit
- $58,283
Cash invested: $8,400 (down + closing). Projections, not guarantees.
Landlord ↔ Tenant lean methodology
- Overall (STATE)
- 83 Strongly Landlord-Friendly
- State Iowa
- 83 Strongly Landlord-Friendly · R+6
- County
- — inherits STATE
- City
- — inherits STATE
ZIP-level market 50423
- Home prices YoY
- 8.2%
- Active inventory
- 22
- Price-to-rent
- 2.6×
Monthly cashflow live
- Estimated rent
- $978 medium interval (Pro) →
- Mortgage (P&I)
- −$157
- Tax from tax record
- −$79 /mo · $946/yr
- Insurance
- −$12
- HOA
- −$0
- Vacancy / Maint / Mgmt
- −$205
- Net cashflow
- $524
Break-even live
Sensitivity live
| Price | -10% $541 | -5% $532 | +0% $524 | +5% $515 | +10% $507 |
|---|---|---|---|---|---|
| Rent | -10% $447 | -5% $485 | +0% $524 | +5% $562 | +10% $601 |
| Rate | -1.0pp $539 | -0.5pp $531 | base $524 | +0.5pp $516 | +1.0pp $508 |
UW: 25.0% down · 7.5% · 30yr · 1.5% tax · 5.0% vac · 8.0% maint · 8.0% mgmt
Financing live
Cash to close
- Down payment
- $7,500
- Closing costs
- $900
- Reserves months
- —
- Total cash needed
- —
Loan-product check · same deal, 3 products live
Conventional
25% down · 7.5% · 30yr
- Down + closing
- —
- Monthly P&I
- —
- Monthly cashflow
- —
- DSCR
- —
- Eligible?
- —
Personal DTI + credit; lowest rate.
DSCR
20% down · 8.5% · 30yr
- Down + closing
- —
- Monthly P&I
- —
- Monthly cashflow
- —
- DSCR
- —
- Eligible?
- —
No personal income docs; deal must DSCR.
Hard money
10% down · 12.0% · 12mo
- Down + closing
- —
- Monthly P&I
- —
- Monthly cashflow
- —
- DSCR
- —
- Eligible?
- —
Short-term bridge; refi at stabilization.
Listing history 6 events
-
2026-06-12statusdays on market $30,000 Pending 5 DOM
-
2026-06-09days on market $30,000 Active Under Contract 4 DOM
-
2026-06-08days on market $30,000 Active Under Contract 3 DOM
-
2026-06-07days on market $30,000 Active Under Contract 2 DOM
-
2026-06-07remarks 132-char remark
-
2026-06-07$30,000 Active Under Contract 1 DOM
ⓘ Source: listings_history table (triggers on properties + properties_extension) + one-shot
backfill from property_details.listing_events for pre-trigger history.
Tax reassessment forecast IA · Partial reset (capped growth)
- Current annual tax
- $946 · $79/mo
- Projected year-2 tax
- $946 · $79/mo
- Expected delta
- $0/yr ($0/mo · 0.0%)
ⓘ Screening estimate from a state-policy table — verify with the county assessor before closing.
Climate risk First Street
- Flood 1/10 Low FEMA zone X (unshaded) · 0% chance over 30 yrs
- Wildfire 1/10 Low
- Heat 2/10 Low 7 d/yr ≥99°F today · 16 d/yr by 30 yrs out
- Wind 2/10 Low
- Air quality 1/10 Low 0 unhealthy d/yr today · 0 by 30 yrs out
Nearby sold comps map
Loading sold comps map…
Walkable amenities ~0.75 mi
Loading nearby amenities…
Taxation est. · year 1
- Rental income
- $11,735
- − Mortgage interest
- −$1,680
- − Property taxes
- −$946
- − Insurance
- −$150
- − Repairs & maintenance
- −$939
- − Management
- −$939
- − Depreciation
- −$873
- Taxable income
- $6,208
- Est. tax owed @ 24.0%
- −$1,490
- After-tax cash flow
- $4,797/yr
For passive investors: Depreciation is non-cash, so a rental often shows a tax loss while cash-flowing — sheltering income. Rental losses are passive: they offset passive income freely, and up to $25,000/yr can offset ordinary (W-2) income if you actively participate and your MAGI is under $100k (phasing out to $0 by $150k); unused losses carry forward. On sale, claimed depreciation is recaptured at up to 25%, and gains may owe capital-gains tax (a 1031 exchange can defer both). Figures are a year-1 estimate at your 24.0% rate — not tax advice; consult a CPA.
Schools (NCES district)
- District
- West Hancock Community School District
- NCES district ID
- 1905430
- Math proficiency
- 76% ▼ -5.00%
- Reading proficiency
- 74% ▼ -1.00%
- Median HH income
- $46,779
- Composite
- 63.22/100
- National rank
- #634
- State rank
- #77 of 289 in IA
Livability — Britt
- Score
- 79/100
- State rank
- #121
- US rank
- #2262
Category grades
Schools grade is shown separately in the Schools card above.
Census & demographics
- Census place
- Britt, IA
- Population (ZIP)
- 2,401
Population outlook (Hancock County) Hauer SSP2
- Today (2025)
- 10,462 people
- By 2030
- 10,154 · -2.9%
- By 2040
- 9,552 · -8.7%
- By 2050
- 9,034 · -13.6%
- By 2075
- 8,233 · -21.3%
- By 2100
- 7,050 · -32.6%
Race, ethnicity, and origin ACS 2023
- Neighborhood character
- Predominantly White (86%)
- Race & ethnicity
- White 86% Hispanic / Latino 9% Two or more races 2% Asian 2%
- Hispanic origin (detail)
- Mexican 9%
- Common ancestry
- Portuguese 11% Iranian 6% Lithuanian 1%
- Foreign-born
- 4% · Canada
- Languages at home
- 95% English-only · Spanish 3% Vietnamese 1% Russian/Polish/Slavic 1%
Political lean MEDSL · Hancock
- 2024 margin
- Solid R (+47.4) · D 25.7% · R 73.1% · Other 1.2%
- 2008→2024 swing
- -43.8pp toward R · 2008: -3.6pp · 2024: -47.4pp
- All cycles
- 2024: R+47.4 2020: R+43.9 2016: R+41.1 2012: R+13.6 2008: R+3.6
Not yet ingested
- Civics
- —
Market trends
- HPI YoY
- ▲ 18.61%
- Current HPI
- 245.6369
- Rent YoY
- —
- Metro
- —
- State GDP YoY
- ▲ 2.48%
- F500 in state
- 4
Industry mix (Fortune 500 HQ in IA)
| Industry | F500 HQs | Revenue |
|---|---|---|
| Financial Services | 1 | $16B |
|
||
| Retail / Convenience | 1 | $15B |
|
||
Price history
-14.3% since first listed5 events — show timeline
- 2026-06-06 Contingent — IAR
- 2026-06-04 Listed $30,000 IAR
- 2011-06-01 Sold (Public Records) $38,000 Public Records
- 2008-12-19 Sold (Public Records) $38,000 Public Records
- 2007-02-23 Sold (Public Records) $35,000 Public Records
Property tax history
+2.6%/yrLatest (2025): $946 · +9.5% YoY. Source: county tax records.
Cash-flow waterfall
monthlySold comps — $/sqft
last 12 mo · ≤1 miLoading sold comps…