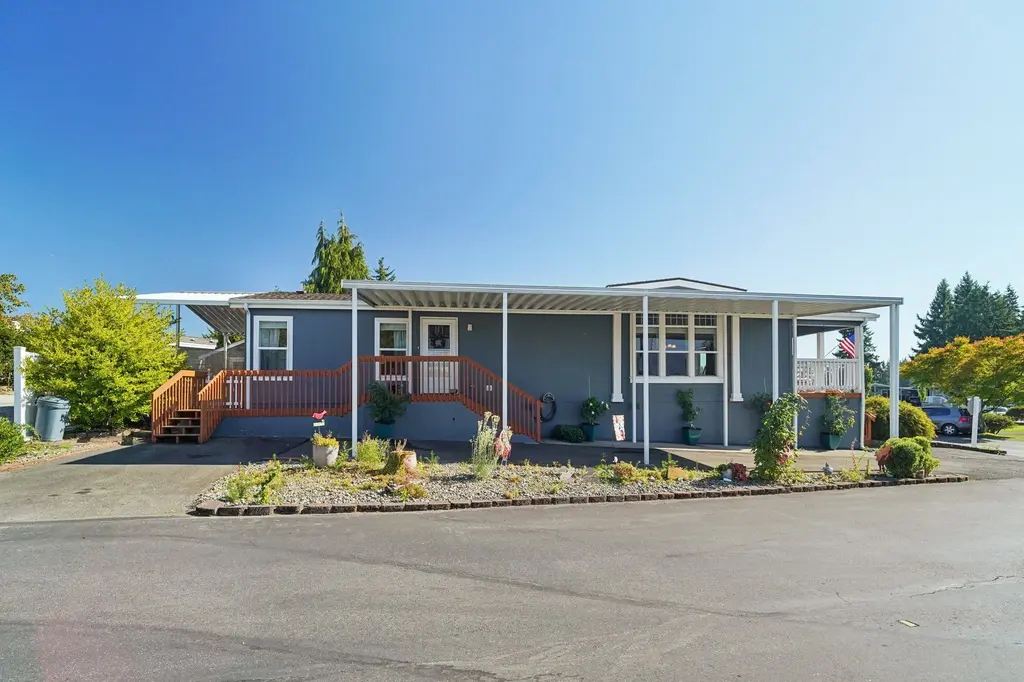
2101 S 324th St #166 · Federal Way, WA
Flood risk 1/10 · Minimal
- FEMA flood zone
- X (unshaded)
- Chance of flooding over 30 yrs
- 0.0%
- Est. flood insurance / yr
- $473 – $860
Fire risk 1/10 · Minimal
- Est. fire insurance / yr
- $604 – $1,122
Heat risk 3/10 · Minor
- Hot days now (above 87°F)
- 7 days/yr
- Hot days in 30 yrs
- 15 days/yr
Wind risk 1/10 · Minimal
- Chance of severe wind over 30 yrs
- —
Air-quality risk 7/10 · Major
- Unhealthy air days now
- 10 days/yr
- Unhealthy air days in 30 yrs
- 11 days/yr
Risk factors via First Street. Map © Google.
Why this score? — see what drove the C grade
The composite is a weighted blend of 9 inputs, each scored 0–100. Each bar is that input's sub-score; the figure is the points it added to the 100-point composite (weight × sub-score).
- Cash flow +18.3/30.0
- ARV discount +15.0/15.0
- DSCR +5.7/10.0
- 1% rule +4.9/10.0
- Schools +3.9/10.0
- Livability +3.6/5.0
- Rent growth +3.1/5.0
- Condition / age +2.5/5.0
- Appreciation +0.0/10.0
$224,950
🖨 Deal sheet (PDF) 📄 Offer letter ✓ Due diligence
Listing remarks
Welcome to Belmor Park. THE NEW MODERN VIBE FOR THE YOUNG AT HEART! A premier 55+ gated community where comfort meets an active lifestyle! This beautifully maintained 2bed/1.75baths home sits on a desirable corner lot, offering peaceful territorial views and FRONT-ROW access to the community’s executive golf course, perfect for morning walks or watching the sunset from your private deck. The spacious floor plan features modern LVP flooring in the main living areas and plush carpeting in the bedrooms. The generous kitchen comes fully equipped with stainless steel appliances, while the private outdoor retreat includes a covered back patio and durable Trex decking, ideal for year-round e
Key facts
- Gated community
- Massive clubhouse
- Golf course views
Tags
Neighborhood map
What this means for you Summary
Snapshot
- This is a 2-bed/2.0-bath manufactured listed at $225k.
Deal economics
- At list price, monthly cash flow is $204 ($2k/yr) — positive.
- The deal already cash-flows at list — no discount required.
- To meet the 1% rule (rent ≥ 1% of price), the offer needs to be $223k (1.0% below list).
- Recommended offer: $198k (12.0% below list) — sets the bar for market timing.
- Cap rate 7.4% vs local median 2.7% in Federal Way — top-decile yield for the area; either an underpriced asset or a hidden risk that comps aren't pricing in. Stress-test before assuming the spread holds.
Location & tenants
- Location reads 71/100 on livability (#221 in WA) — a middle-class / working-renter tenant base. Strengths: commute A+, housing A+, health & safety A+; Watch: crime F, cost of living F.
- Federal Way School District (suburban): math 35% / reading 47% proficiency, ranked #207 of 291 in WA (top 71%) — families likely to look elsewhere, expect single-tenant / working-renter base with shorter leases.
- Zoned schools: Lake Dolloff Elementary School (469 students, 85% FRL); Sequoyah Middle School (535 students, 81% FRL); Todd Beamer High School (1,302 students, 70% FRL) — zoned schools average 79% FRL vs 48% district-wide (31 pts higher); higher-poverty schools than district average — tighter screening recommended.
- Market conditions: Rents rising (+2.3%/yr); 233 active listings in the ZIP; 27 comparable units currently listed for rent nearby; rentals leasing fast (median 5d on market — plan ~1-2 weeks tenant-placement turnaround); solid renter incomes; 10,555 units permitted in King County in 2024 (7,119 in 5+ unit buildings).
- This rent runs 35% of the median local income ($75k/yr) — at the standard rent-burdened threshold; future hikes will face affordability resistance.
Forward outlook
- Local home prices are declining (-3.0%/yr); year-one equity from $2k of loan paydown is wiped out by about $7k of value loss. Plan a longer hold.
- King County population projected at +44% by 2050 — long-run rental-demand tailwind backs the buy-and-hold thesis.
Negotiation context
- It's been on market 276 days — a 12% lower offer ($198k) is reasonable based on typical stale-listing flexibility.
- 4 sale attempts since 21y ago; this cycle's ask has dropped $20k (8%) from the opening price — seller is motivated, your offer sets the floor, not the list.
- Current owner paid $155k; 45% above their basis — modest negotiation headroom, anchor on the comps not their cost.
Questions for the listing agent
- It's been on market 276 days. Have you received any prior offers? Is the seller open to a 12% concession, seller financing, or rate buy-down credit?
- Why hasn't it sold? Are there any deal-killer items the seller is aware of (foundation, flood, title, zoning, code violations)?
- Is there a deadline driving the sale (1031 exchange, divorce, estate, relocation)? That informs how much negotiation room exists.
- Crime grade is F in this area — have there been break-ins, vandalism, or insurance claims at this property in the last 3 years? What carrier currently insures it and at what premium?
- What's the average days-on-market for RENTAL listings here right now (not sales)? A rising rental-DOM trend means longer vacancies and softer asking-rent achievability than the comps imply.
- What's the recent tenant-quality profile in this submarket — average credit score on applications, eviction rate, late-payment / NSF rate, and stable-employment percentage? A property-management company in the area should have these aggregated.
- How much new for-sale + rental construction is in the pipeline within 1–3 miles? Heavy new supply typically softens prices + rents 12–24 months out; constrained supply supports both.
Investment metrics
- 1% rule
- 0.99% ✗
- Cap rate
- 7.38%
- Cash-on-cash
- 3.89%
- DSCR
- 1.17
- GRM
- 8.4
CMA / ARV
- ARV (median comp)
- $286,872
- List price
- $224,950
- Delta
- -21.59%
- Verdict
- UNDERPRICED
- Comps
- 16 within 1.0 mi
Show comp detail 12 sales within ~0.75 mi
| Address | Dist | Beds/Ba | Sqft | Sold | Price | $/sf | Match |
|---|---|---|---|---|---|---|---|
| 2101 S 324th St #102 | 0.13mi | 2/2.0 | 1,344 (0%) | 10mo | $249,900 | $186 | 85 |
| 32820 20th Ave S #35 | 0.26mi | 2/2.0 | 1,344 (0%) | 7mo | $315,000 | $234 | 82 |
| 32820 20th Ave S #24 | 0.26mi | 2/2.0 | 1,400 (+4%) | 3mo | $360,000 | $257 | 78 |
| 2101 S 324th St #232 | 0.13mi | 2/2.0 | 1,392 (+4%) | 12mo | $199,000 | $143 | 78 |
| 2101 S 324th St #164 | 0.13mi | 3/2.0 (+1) | 1,404 (+4%) | 4mo | $300,000 | $214 | 78 |
| 2101 S 324th St #107 | 0.13mi | 2/2.0 | 1,248 (-7%) | 7mo | $152,500 | $122 | 76 |
| 32820 20th Ave S #18 | 0.26mi | 3/2.0 (+1) | 1,296 (-4%) | 3mo | $327,500 | $253 | 74 |
| 2101 S 324th St #109 | 0.13mi | 2/2.0 | 1,250 (-7%) | 12mo | $90,000 | $72 | 72 |
| 2101 S 324th St #185 | 0.13mi | 2/2.0 | 1,231 (-8%) | 10mo | $229,950 | $187 | 71 |
| 2101 S 324th St #163 | 0.13mi | 3/2.0 (+1) | 1,458 (+8%) | 11mo | $319,000 | $219 | 66 |
| 2101 S 324th St #193 | 0.13mi | 2/2.0 | 1,176 (-12%) | 11mo | $279,000 | $237 | 64 |
| 2101 S 324TH #215 | 0.13mi | 2/2.0 | 1,152 (-14%) | 12mo | $172,500 | $150 | 60 |
Match score weights: distance 35% · size 25% · config 20% · recency 20%. Top-matched comps best support the ARV.
Projected returns pro-forma
-3.0% appreciation · 2.33% rent growth · sell at horizon
- IRR
- -10.9%
- Equity multiple
- 0.60×
- Total profit
- $-24,895
- Equity at exit
- $33,541
- IRR
- -2.6%
- Equity multiple
- 0.83×
- Total profit
- $-10,821
- Equity at exit
- $19,450
Cash invested: $62,986 (down + closing). Projections, not guarantees.
Landlord ↔ Tenant lean methodology
- Overall (STATE)
- 28 Tenant-Leaning
- State Washington
- 28 Tenant-Leaning · D+8
- County
- — inherits STATE
- City
- — inherits STATE
ZIP-level market 98003
- Rents YoY
- 2.3%
- Active inventory
- 233
- Price-to-rent
- 8.4×
Monthly cashflow live
- Estimated rent
- $2,226 high interval (Pro) →
- Mortgage (P&I)
- −$1,180
- Tax est. 1.5%
- −$281 /mo · $3,374/yr
- Insurance
- −$94
- HOA
- −$0
- Vacancy / Maint / Mgmt
- −$468
- Net cashflow
- $204
Break-even live
Sensitivity live
| Price | -10% $360 | -5% $282 | +0% $204 | +5% $127 | +10% $49 |
|---|---|---|---|---|---|
| Rent | -10% $28 | -5% $116 | +0% $204 | +5% $292 | +10% $380 |
| Rate | -1.0pp $318 | -0.5pp $262 | base $204 | +0.5pp $146 | +1.0pp $87 |
UW: 25.0% down · 7.5% · 30yr · 1.5% tax · 5.0% vac · 8.0% maint · 8.0% mgmt
Financing live
Cash to close
- Down payment
- $56,238
- Closing costs
- $6,748
- Reserves months
- —
- Total cash needed
- —
Loan-product check · same deal, 3 products live
Conventional
25% down · 7.5% · 30yr
- Down + closing
- —
- Monthly P&I
- —
- Monthly cashflow
- —
- DSCR
- —
- Eligible?
- —
Personal DTI + credit; lowest rate.
DSCR
20% down · 8.5% · 30yr
- Down + closing
- —
- Monthly P&I
- —
- Monthly cashflow
- —
- DSCR
- —
- Eligible?
- —
No personal income docs; deal must DSCR.
Hard money
10% down · 12.0% · 12mo
- Down + closing
- —
- Monthly P&I
- —
- Monthly cashflow
- —
- DSCR
- —
- Eligible?
- —
Short-term bridge; refi at stabilization.
Rent comps 27 comps
| Address | Beds | Baths | Sqft | Rent | $/sqft | DOM | Units | Dist |
|---|---|---|---|---|---|---|---|---|
| 32905 19th Pl S Federal Way, WA | 1.0–3.0 | 1.0–2.0 | 937 | $2,104 | $2.24 | 0d | 16 | 0.24mi |
| 33016 17th Pl S Unit B302 Federal Way, WA | 2.0 | 1.0 | 886 | $1,785 | $2.01 | 12d | 1 | 0.45mi |
| 31701 Pete Von Reichbauer Way S Federal Way, WA | 2.0 | 1.0 | 721 | $2,142 | $2.97 | 7d | 1 | 0.47mi |
| 2517 S 316th Ln Federal Way, WA | 1.0–2.0 | 1.0–2.0 | 825 | $2,010 | $2.44 | 0d | 4 | 0.61mi |
| 2100 S 336th St Unit P5 Federal Way, WA | 2.0 | 2.5 | 918 | $2,500 | $2.72 | 4d | 1 | 0.62mi |
| 2100 S 336th St Unit C1 Federal Way, WA | 3.0 | 2.5 | 1460 | $4,000 | $2.74 | 45d | 1 | 0.62mi |
| 33311 18th Ln S Federal Way, WA | 1.0–3.0 | 1.0–2.0 | 950 | $1,812 | $1.91 | 3d | 7 | 0.62mi |
| 1066 S 320th St Federal Way, WA | 1.0–3.0 | 1.0–2.0 | 1088 | $2,016 | $1.85 | 3d | 7 | 0.68mi |
| 32305 10th Pl S Federal Way, WA | 3.0 | 1.5 | 1320 | $3,200 | $2.42 | 45d | 1 | 0.74mi |
| 31408 28th Ave S Federal Way, WA | 3.0 | 2.5–3.5 | 1864 | $2,900 | $1.56 | 5d | 5 | 0.75mi |
| 31750 7th Pl S Federal Way, WA | 3.0 | 1.0 | 1280 | $2,600 | $2.03 | 45d | 1 | 0.95mi |
| 30813 19th Pl S Federal Way, WA | 2.0 | 1.0 | 900 | $2,195 | $2.44 | 4d | 1 | 1.01mi |
| 1201 S 336th St Federal Way, WA | 1.0–4.0 | 1.0–2.0 | 1094 | $2,016 | $1.84 | 0d | 10 | 1.01mi |
| 31655 Military Rd S Auburn, WA | 1.0–4.0 | 1.0–2.0 | 1032 | $2,016 | $1.95 | 0d | 8 | 1.03mi |
| 3634 S 334th St Federal Way, WA | 3.0 | 1.0 | 1540 | $2,900 | $1.88 | 45d | 1 | 1.03mi |
| 1916 S 308th St Federal Way, WA | 3.0 | 1.0 | 1040 | $2,395 | $2.30 | 45d | 1 | 1.06mi |
| 1650 S 308th St Federal Way, WA | 1.0–2.0 | 1.0 | 850 | $1,495 | $1.76 | 7d | 3 | 1.12mi |
| 32836 3rd Pl S Federal Way, WA | 2.0 | 2.0 | 1080 | $2,150 | $1.99 | 12d | 1 | 1.14mi |
| 30602 Pacific Hwy S Federal Way, WA | 1.0–2.0 | 1.0–1.5 | 950 | $1,695 | $1.78 | 0d | 15 | 1.17mi |
| 1737 S 305th Pl Unit 4 Federal Way, WA | 2.0 | 1.0 | 950 | $2,000 | $2.11 | 45d | 1 | 1.21mi |
| 117 S 330th St Federal Way, WA | 2.0 | 1.0–2.0 | 1050 | $1,695 | $1.61 | 7d | 1 | 1.36mi |
| 32420 1st Ln SW Federal Way, WA | 2.0 | 1.0 | 980 | $2,050 | $2.09 | 22d | 1 | 1.37mi |
| 30331 15th Ct S Unit 03 Federal Way, WA | 2.0 | 1.5 | 1135 | $2,295 | $2.02 | 45d | 1 | 1.38mi |
| 33131 1st Ave SW Federal Way, WA | 1.0–2.0 | 1.0–2.0 | 818 | $2,230 | $2.73 | 0d | 13 | 1.41mi |
| 2015 S 301st St Federal Way, WA | 3.0 | 1.5 | 1120 | $2,800 | $2.50 | 4d | 1 | 1.47mi |
| 31912 3rd Ln SW Federal Way, WA | 1.0–3.0 | 1.0–2.0 | 963 | $2,038 | $2.12 | 0d | 17 | 1.48mi |
| 122 S 339th Cir Unit B Federal Way, WA | 2.0 | 1.5 | 1009 | $1,850 | $1.83 | 0d | 1 | 1.50mi |
Listing history 27 events
-
2026-06-21days on market $224,950 Active 276 DOM
-
2026-06-18days on market $224,950 Active 273 DOM
-
2026-06-17days on market $224,950 Active 272 DOM
-
2026-06-16days on market $224,950 Active 271 DOM
-
2026-06-15days on market $224,950 Active 270 DOM
-
2026-06-13days on market $224,950 Active 268 DOM
-
2026-06-09days on market $224,950 Active 264 DOM
-
2026-06-08days on market $224,950 Active 263 DOM
-
2026-06-07days on market $224,950 Active 262 DOM
-
2026-06-04days on market $224,950 Active 259 DOM
-
2026-06-03days on market $224,950 Active 258 DOM
-
2026-06-02days on market $224,950 Active 257 DOM
-
2026-06-01days on market $224,950 Active 256 DOM
-
2026-05-31days on market $224,950 Active 255 DOM
-
2026-04-15price $224,950
-
2026-02-12price $229,950
-
2026-01-14price $239,950
-
2025-09-18$245,000 Active
-
2023-04-04soldstatus $155,000 Closed
-
2023-03-19status Pending
-
2023-03-09price $159,900
-
2023-02-24price $175,000
-
2023-02-18price $187,500
-
2023-02-08$189,000 Active
-
2023-02-08Active
-
2006-02-15soldstatus $27,000
-
2005-10-24$28,500
ⓘ Source: listings_history table (triggers on properties + properties_extension) + one-shot
backfill from property_details.listing_events for pre-trigger history.
Climate risk First Street
- Flood 1/10 Low FEMA zone X (unshaded) · 0% chance over 30 yrs
- Wildfire 1/10 Low
- Heat 3/10 Moderate 7 d/yr ≥87°F today · 15 d/yr by 30 yrs out
- Wind 1/10 Low
- Air quality 7/10 Severe 10 unhealthy d/yr today · 11 by 30 yrs out
Nearby sold comps map
Loading sold comps map…
Walkable amenities ~0.75 mi
Loading nearby amenities…
Taxation est. · year 1
- Rental income
- $26,718
- − Mortgage interest
- −$12,601
- − Property taxes
- −$3,374
- − Insurance
- −$1,125
- − Repairs & maintenance
- −$2,137
- − Management
- −$2,137
- − Depreciation
- −$6,544
- Taxable loss
- −$1,201
- Est. tax savings @ 24.0%
- +$288
- After-tax cash flow
- $2,740/yr
For passive investors: Depreciation is non-cash, so a rental often shows a tax loss while cash-flowing — sheltering income. Rental losses are passive: they offset passive income freely, and up to $25,000/yr can offset ordinary (W-2) income if you actively participate and your MAGI is under $100k (phasing out to $0 by $150k); unused losses carry forward. On sale, claimed depreciation is recaptured at up to 25%, and gains may owe capital-gains tax (a 1031 exchange can defer both). Figures are a year-1 estimate at your 24.0% rate — not tax advice; consult a CPA.
Schools (NCES district)
- District
- Federal Way School District
- NCES district ID
- 5302820
- Math proficiency
- 35% ▬ 0.00%
- Reading proficiency
- 47% ▬ 0.00%
- Median HH income
- $61,594
- Composite
- 38.79/100
- National rank
- #8361
- State rank
- #207 of 291 in WA
Livability — Federal Way
- Score
- 71/100
- State rank
- #221
- US rank
- #6403
Category grades
Schools grade is shown separately in the Schools card above.
Census & demographics
- Census place
- Federal Way, WA
- County
- King County · 2,251,916 people
- City population
- 102,067
- Metro
- Seattle-Tacoma-Bellevue, WA
- Population (ZIP)
- 51,619
- Household income
- $75,319
- Rent vs Own
- Severe rent burden
- 2895.0
Population outlook (King County) Hauer SSP2
- Today (2025)
- 2,576,485 people
- By 2030
- 2,803,316 · +8.8%
- By 2040
- 3,255,921 · +26.4%
- By 2050
- 3,706,444 · +43.9%
- By 2075
- 4,746,063 · +84.2%
- By 2100
- 5,407,730 · +109.9%
Race, ethnicity, and origin ACS 2023
- Neighborhood character
- Highly diverse neighborhood (Simpson 0.79)
- Race & ethnicity
- White 32% Hispanic / Latino 23% Black 19% Two or more races 16% Asian 13% Pacific Islander 2%
- Hispanic origin (detail)
- Mexican 18%
- Common ancestry
- Portuguese 3% Lithuanian 2% Swedish 2%
- Foreign-born
- 32% · Canada, South Korea, Vietnam
- Languages at home
- 57% English-only · Spanish 18% Other Indo-European 3% Russian/Polish/Slavic 3%
Political lean MEDSL · King
- 2024 margin
- Solid D (+51.7) · D 74.2% · R 22.5% · Other 3.4%
- 2008→2024 swing
- +9.6pp toward D · 2008: 42.1pp · 2024: 51.7pp
- All cycles
- 2024: D+51.7 2020: D+52.7 2016: D+50.4 2012: D+39.9 2008: D+42.1
Not yet ingested
- Civics
- —
Market trends
- HPI YoY
- ▼ -623.87%
- Current HPI
- 327.5371
- Rent YoY
- ▲ 2.33%
- Metro
- Seattle-Tacoma-Bellevue, WA
- State GDP YoY
- ▲ 4.65%
- F500 in state
- 22
Industry mix (Fortune 500 HQ in WA)
| Industry | F500 HQs | Revenue |
|---|---|---|
| Retail | 2 | $269B |
|
||
| Technology / Retail | 1 | $638B |
|
||
| Technology | 1 | $245B |
|
||
| Telecommunications | 1 | $38B |
|
||
| Food / Beverage | 1 | $36B |
|
||
| Automotive / Trucks | 1 | $34B |
|
||
Price history
+689.3% since first listed13 events — show timeline
- 2026-04-15 Price Changed $224,950 NWMLS as Distributed by MLS Grid
- 2026-02-12 Price Changed $229,950 NWMLS as Distributed by MLS Grid
- 2026-01-14 Price Changed $239,950 NWMLS as Distributed by MLS Grid
- 2025-09-18 Listed $245,000 NWMLS as Distributed by MLS Grid
- 2023-04-04 Sold (MLS) $155,000 NWMLS as Distributed by MLS Grid
- 2023-03-19 Pending — NWMLS as Distributed by MLS Grid
- 2023-03-09 Price Changed $159,900 NWMLS as Distributed by MLS Grid
- 2023-02-24 Price Changed $175,000 NWMLS as Distributed by MLS Grid
- 2023-02-18 Price Changed $187,500 NWMLS as Distributed by MLS Grid
- 2023-02-08 Listed — NWMLS as Distributed by MLS Grid
- 2023-02-08 Listed $189,000 NWMLS as Distributed by MLS Grid
- 2006-02-15 Sold (MLS) $27,000 NWMLS as Distributed by MLS Grid
- 2005-10-24 Listed $28,500 NWMLS as Distributed by MLS Grid
Cash-flow waterfall
monthlySold comps — $/sqft
last 12 mo · ≤1 miLoading sold comps…