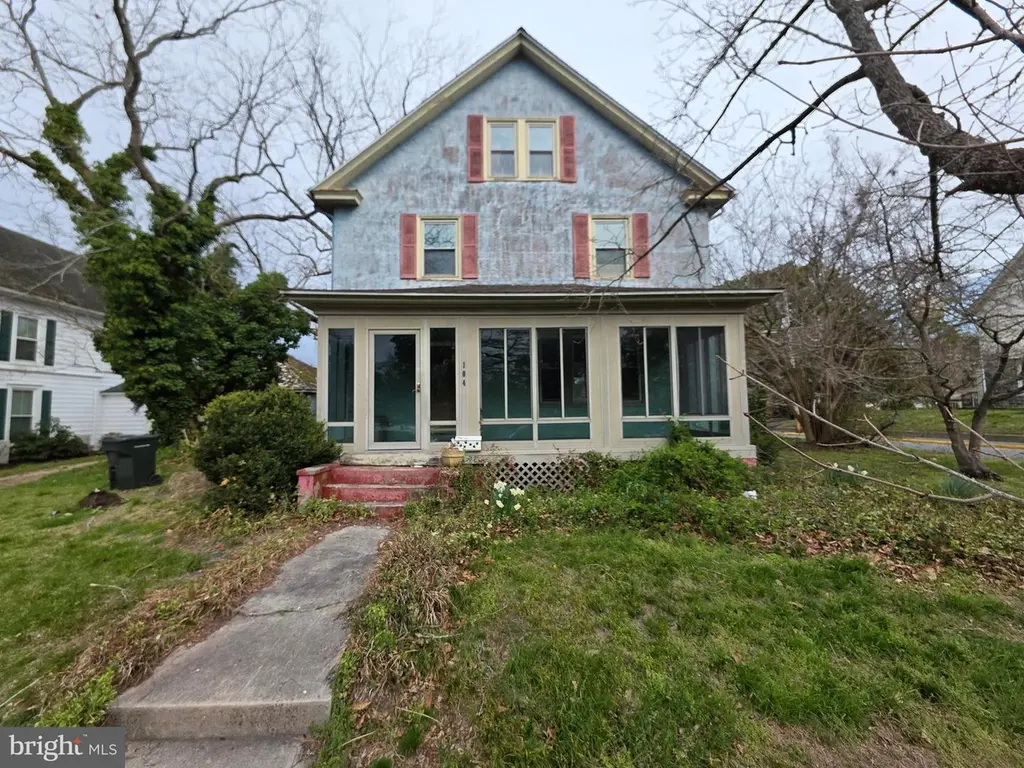
104 W Federal St · Snow Hill, MD
Flood risk 1/10 · Minimal
- FEMA flood zone
- X (unshaded)
- Chance of flooding over 30 yrs
- 0.0%
- Est. flood insurance / yr
- $473 – $860
Fire risk 3/10 · Minor
- Est. fire insurance / yr
- $755 – $1,403
Heat risk 8/10 · Major
- Hot days now (above 103°F)
- 7 days/yr
- Hot days in 30 yrs
- 17 days/yr
Wind risk 8/10 · Major
- Chance of severe wind over 30 yrs
- 80.0%
Air-quality risk 2/10 · Minimal
- Unhealthy air days now
- 1 days/yr
- Unhealthy air days in 30 yrs
- 2 days/yr
Risk factors via First Street. Map © Google.
Why this score? — see what drove the B- grade
The composite is a weighted blend of 9 inputs, each scored 0–100. Each bar is that input's sub-score; the figure is the points it added to the 100-point composite (weight × sub-score).
- Cash flow +30.0/30.0
- 1% rule +10.0/10.0
- DSCR +10.0/10.0
- ARV discount +7.5/15.0
- Livability +3.5/5.0
- Schools +3.3/10.0
- Rent growth +2.5/5.0
- Condition / age +2.5/5.0
- Appreciation +0.0/10.0
$150,000
🖨 Deal sheet 📄 Offer letter ✓ Due diligence
Listing remarks
Estate knows very little in regards to home systems, their condition and functionality. Showings must sign Hold Harmless. Home being sold strictly As-Is. Inspections are for informational purposes only.
Key facts
- 0.25 acre lot
- 2 garage spots
- Built 1908
Neighborhood map
What this means for you Summary
Snapshot
- This is a 2-bed/2.0-bath single-family listed at $150k.
Deal economics
- At list price, monthly cash flow is $823 ($10k/yr) — positive.
- The deal already cash-flows at list — no discount required.
- Meets the 1% rule at list price ($2k rent vs $150k).
Location & tenants
- Location reads 70/100 on livability (#167 in MD) — a middle-class / working-renter tenant base. Strengths: cost of living A+, health & safety A+, crime A-; Watch: amenities F, commute F, employment F.
- Worcester County Public Schools (town): math 30% / reading 44% proficiency, ranked #6 of 24 in MD (top 25%) — families likely to look elsewhere, expect single-tenant / working-renter base with shorter leases.
- Zoned schools: Snow Hill Middle (math 19% / reading 29%, grade F, #114 of 225 statewide, top 52%, 403 students, 59% FRL); Snow Hill High (math 57% / reading 82%, grade B, #40 of 222 statewide, top 19%, 348 students, 55% FRL) — zoned schools average 57% FRL vs 39% district-wide (19 pts higher); higher-poverty schools than district average — tighter screening recommended.
- Market conditions: 26 active listings in the ZIP; 1 comparable units currently listed for rent nearby; 354 units permitted in Worcester County in 2024 (6 in 5+ unit buildings).
Forward outlook
- Local home prices are declining (-3.0%/yr); year-one equity from $1k of loan paydown is wiped out by about $4k of value loss. Plan a longer hold.
- Worcester County population projected to shrink 4% by 2050 — rents likely to lag national; underwrite the cash flow, not the appreciation.
- At projected returns (-3.0% appreciation + 3.0% rent growth), your $42k cash investment doubles in ~6 years — after that, you're playing with house money.
Negotiation context
- Only 1 days on market — expect competitive offers; lowballing is unlikely to land.
Risks & watch-outs
- Watch-outs: built in 1908 — expect roof / HVAC / electrical / plumbing capex.
- Climate carrying-cost: severe wind risk, 80% chance of damaging wind over 30y; extreme-heat days projected 7→17/yr by 2055 (HVAC capex compounding) — expect insurance premiums to compound above CPI over the hold.
Questions for the listing agent
- Built in 1908 — when were the roof, HVAC, electrical panel, plumbing, and water heater last replaced?
- Is there a deadline driving the sale (1031 exchange, divorce, estate, relocation)? That informs how much negotiation room exists.
- What's the average days-on-market for RENTAL listings here right now (not sales)? A rising rental-DOM trend means longer vacancies and softer asking-rent achievability than the comps imply.
- What's the recent tenant-quality profile in this submarket — average credit score on applications, eviction rate, late-payment / NSF rate, and stable-employment percentage? A property-management company in the area should have these aggregated.
- How much new for-sale + rental construction is in the pipeline within 1–3 miles? Heavy new supply typically softens prices + rents 12–24 months out; constrained supply supports both.
Investment metrics
- 1% rule
- 1.63% ✓
- Cap rate
- 12.87%
- Cash-on-cash
- 23.50%
- DSCR
- 2.05
- GRM
- 5.1
CMA / ARV
- ARV (on-the-fly)
- $320,768
- Comps found
- 12
Show comp detail 12 sales within ~0.75 mi
| Address | Dist | Beds/Ba | Sqft | Sold | Price | $/sf | Match |
|---|---|---|---|---|---|---|---|
| 104 W Federal St | 0.00mi | 2/1.5 | 1,792 (0%) | 1mo | $150,000 | $84 | 98 |
| 104 N Bay St N | 0.30mi | 3/1.5 (+1) | 1,779 (-1%) | 9mo | $185,000 | $104 | 70 |
| 205 W Martin St | 0.22mi | 3/2.0 (+1) | 1,778 (-1%) | 22mo | $349,900 | $197 | 65 |
| 211 Market St | 0.27mi | 3/2.5 (+1) | 1,642 (-8%) | 14mo | $310,000 | $189 | 55 |
| 200 Mumford St | 0.26mi | 3/2.5 (+1) | 2,060 (+15%) | 6mo | $340,000 | $165 | 51 |
| 301 Coulbourne Ln | 0.49mi | 3/1.5 (+1) | 1,756 (-2%) | 21mo | $315,000 | $179 | 49 |
| 108 N Morris St | 0.27mi | 3/2.0 (+1) | 1,614 (-10%) | 23mo | $299,900 | $186 | 46 |
| 403 S Morris St | 0.50mi | 3/2.0 (+1) | 1,604 (-10%) | 10mo | $305,000 | $190 | 46 |
| 220 E Federal St | 0.31mi | 3/1.5 (+1) | 1,552 (-13%) | 13mo | $170,000 | $110 | 46 |
| 201 W Market St | 0.20mi | 3/1.0 (+1) | 1,550 (-14%) | 24mo | $216,700 | $140 | 39 |
| 209 S Morris St | 0.32mi | 3/3.0 (+1) | 2,040 (+14%) | 23mo | $170,000 | $83 | 33 |
| 5444 E Market St | 0.72mi | 3/1.0 (+1) | 1,568 (-12%) | 21mo | $324,900 | $207 | 19 |
Match score weights: distance 35% · size 25% · config 20% · recency 20%. Top-matched comps best support the ARV.
Projected returns pro-forma
-3.0% appreciation · 3.0% rent growth · sell at horizon
- IRR
- 16.6%
- Equity multiple
- 1.67×
- Total profit
- $28,173
- Equity at exit
- $22,365
- IRR
- 25.2%
- Equity multiple
- 3.20×
- Total profit
- $92,341
- Equity at exit
- $12,969
Cash invested: $42,000 (down + closing). Projections, not guarantees.
Landlord ↔ Tenant lean methodology
- Overall (STATE)
- 27 Tenant-Leaning
- State Maryland
- 27 Tenant-Leaning · D+14
- County
- — inherits STATE
- City
- — inherits STATE
ZIP-level market 21863
- Home prices YoY
- -12.0%
- Active inventory
- 26
- Price-to-rent
- 5.1×
Monthly cashflow live
- Estimated rent
- $2,450 medium interval (Pro) →
- Mortgage (P&I)
- −$787
- Tax from tax record
- −$264 /mo · $3,165/yr
- Insurance
- −$62
- HOA
- −$0
- Vacancy / Maint / Mgmt
- −$514
- Net cashflow
- $823
Break-even live
UW: 25.0% down · 7.5% · 30yr · 1.5% tax · 5.0% vac · 8.0% maint · 8.0% mgmt
Financing live
Cash to close
- Down payment
- $37,500
- Closing costs
- $4,500
- Reserves months
- —
- Total cash needed
- —
Loan-product check · same deal, 3 products live
Conventional
25% down · 7.5% · 30yr
- Down + closing
- —
- Monthly P&I
- —
- Monthly cashflow
- —
- DSCR
- —
- Eligible?
- —
Personal DTI + credit; lowest rate.
DSCR
20% down · 8.5% · 30yr
- Down + closing
- —
- Monthly P&I
- —
- Monthly cashflow
- —
- DSCR
- —
- Eligible?
- —
No personal income docs; deal must DSCR.
Hard money
10% down · 12.0% · 12mo
- Down + closing
- —
- Monthly P&I
- —
- Monthly cashflow
- —
- DSCR
- —
- Eligible?
- —
Short-term bridge; refi at stabilization.
Rent comps 1 comps
| Address | Beds | Baths | Sqft | Rent | $/sqft | DOM | Units | Dist |
|---|---|---|---|---|---|---|---|---|
| 211 W Market St Snow Hill, MD | 3.0 | 2.5 | 1642 | $2,450 | $1.49 | 44d | 1 | 0.25mi |
Listing history 3 events
-
2026-04-19status Pending
-
2026-03-30historical Active Under Contract
-
2026-03-30$150,000 Active
ⓘ Source: listings_history table (triggers on properties + properties_extension) + one-shot
backfill from property_details.listing_events for pre-trigger history.
Tax reassessment forecast MD · Partial reset (capped growth)
- Current annual tax
- $3,165 · $264/mo
- Projected year-2 tax
- $3,165 · $264/mo
- Expected delta
- $0/yr ($0/mo · 0.0%)
ⓘ Screening estimate from a state-policy table — verify with the county assessor before closing.
Climate risk First Street
- Flood 1/10 Low FEMA zone X (unshaded) · 0% chance over 30 yrs
- Wildfire 3/10 Moderate
- Heat 8/10 Severe 7 d/yr ≥103°F today · 17 d/yr by 30 yrs out
- Wind 8/10 Severe 80% chance of damaging wind over 30 yrs
- Air quality 2/10 Low 1 unhealthy d/yr today · 2 by 30 yrs out
Nearby sold comps map
Loading sold comps map…
Walkable amenities ~0.75 mi
Loading nearby amenities…
Taxation est. · year 1
- Rental income
- $29,400
- − Mortgage interest
- −$8,402
- − Property taxes
- −$3,165
- − Insurance
- −$750
- − Repairs & maintenance
- −$2,352
- − Management
- −$2,352
- − Depreciation
- −$4,364
- Taxable income
- $8,015
- Est. tax owed @ 24.0%
- −$1,924
- After-tax cash flow
- $7,948/yr
For passive investors: Depreciation is non-cash, so a rental often shows a tax loss while cash-flowing — sheltering income. Rental losses are passive: they offset passive income freely, and up to $25,000/yr can offset ordinary (W-2) income if you actively participate and your MAGI is under $100k (phasing out to $0 by $150k); unused losses carry forward. On sale, claimed depreciation is recaptured at up to 25%, and gains may owe capital-gains tax (a 1031 exchange can defer both). Figures are a year-1 estimate at your 24.0% rate — not tax advice; consult a CPA.
Schools (NCES district)
- District
- Worcester County Public Schools
- NCES district ID
- 2400720
- Math proficiency
- 30% ▼ -25.00%
- Reading proficiency
- 44% ▼ -20.00%
- Median HH income
- $56,748
- Composite
- 32.6/100
- National rank
- #5672
- State rank
- #6 of 24 in MD
Livability — Snow Hill
- Score
- 70/100
- State rank
- #167
- US rank
- #7515
Category grades
Schools grade is shown separately in the Schools card above.
Census & demographics
- Census place
- Snow Hill, MD
- Population (ZIP)
- 5,202
Population outlook (Worcester County) Hauer SSP2
- Today (2025)
- 51,363 people
- By 2030
- 51,191 · -0.3%
- By 2040
- 50,459 · -1.8%
- By 2050
- 49,451 · -3.7%
- By 2075
- 48,533 · -5.5%
- By 2100
- 44,223 · -13.9%
Race, ethnicity, and origin ACS 2023
- Neighborhood character
- Predominantly White (71%)
- Race & ethnicity
- White 71% Black 22% Two or more races 5% Hispanic / Latino 3% Asian 1%
- Common ancestry
- Slovak 2% Romanian 1% Italian 1%
- Foreign-born
- 2% · Canada
- Languages at home
- 96% English-only · Spanish 2% Other Indo-European 1%
Political lean MEDSL · Worcester
- 2024 margin
- Strong R (+22.0) · D 38.0% · R 60.0% · Other 2.0%
- 2008→2024 swing
- -6.5pp toward R · 2008: -15.5pp · 2024: -22.0pp
- All cycles
- 2024: R+22.0 2020: R+19.0 2016: R+27.9 2012: R+18.3 2008: R+15.5
Not yet ingested
- Civics
- —
Market trends
- HPI YoY
- ▼ -39.78%
- Current HPI
- 291.6294
- Rent YoY
- —
- Metro
- —
- State GDP YoY
- ▲ 2.97%
- F500 in state
- 12
Industry mix (Fortune 500 HQ in MD)
| Industry | F500 HQs | Revenue |
|---|---|---|
| Aerospace / Defense | 1 | $71B |
|
||
| Utilities | 1 | $25B |
|
||
| Hotels | 1 | $24B |
|
||
| Consumer Goods | 1 | $7B |
|
||
| Real Estate | 1 | $6B |
|
||
| Chemicals | 1 | $2B |
|
||
Price history
3 events — show timeline
- 2026-04-19 Pending — BRIGHT MLS
- 2026-03-30 Contingent — BRIGHT MLS
- 2026-03-30 Listed $150,000 BRIGHT MLS
Property tax history
+2.2%/yrLatest (2025): $3,165 · +1.6% YoY. Source: county tax records.
Cash-flow waterfall
monthlySold comps — $/sqft
last 12 mo · ≤1 miLoading sold comps…