 Multi-family
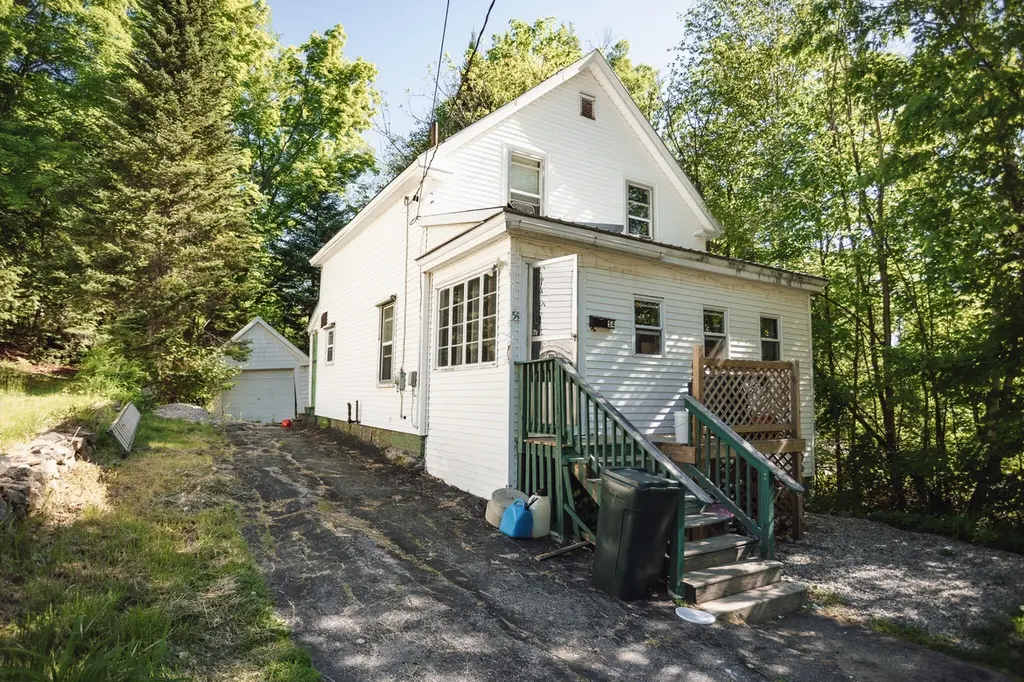
54 Chaplin St · Rumford, ME
Flood risk 7/10 · Major
- FEMA flood zone
- X (unshaded)
- Chance of flooding over 30 yrs
- 0.99%
- Est. flood insurance / yr
- $507 – $1,088
Fire risk 1/10 · Minimal
- Est. fire insurance / yr
- $669 – $1,243
Heat risk 2/10 · Minimal
- Hot days now (above 90°F)
- 7 days/yr
- Hot days in 30 yrs
- 17 days/yr
Wind risk 3/10 · Minor
- Chance of severe wind over 30 yrs
- 6.0%
Air-quality risk 2/10 · Minimal
- Unhealthy air days now
- 1 days/yr
- Unhealthy air days in 30 yrs
- 1 days/yr
Risk factors via First Street. Map © Google.
Why this score? — see what drove the C grade
The composite is a weighted blend of 9 inputs, each scored 0–100. Each bar is that input's sub-score; the figure is the points it added to the 100-point composite (weight × sub-score).
- Cash flow +16.3/30.0
- Appreciation +10.0/10.0
- ARV discount +7.5/15.0
- Schools +6.3/10.0
- DSCR +5.0/10.0
- Livability +3.8/5.0
- 1% rule +3.6/10.0
- Rent growth +2.5/5.0
- Condition / age +2.5/5.0
$165,000
🖨 Deal sheet (PDF) 📄 Offer letter ✓ Due diligence
Multi-family units
County records classify this as Multi-Family (2-4 Unit). Listing-text estimate: 1 unit. estimate disagrees with records
Listing remarks
Opportunity awaits with this 3 bedroom, 2 bath home in Rumford! Conveniently located close to shopping, dining, schools, and other local amenities, this property offers great potential for an owner occupant or investor. With a little TLC, this home could truly shine. Bring your vision and make it your own!
Key facts
- 6,098 sq ft lot
- Garage
- Built 1908
Property features AI
Exterior
- Parking: Detached 1-car garage; Paved on-site parking with 1–4 spaces
- Utilities: Public water; Public sewer; Utilities currently on
- Home design: Single family residence; Built in 1908; 1,063 above-grade finished area
- Construction: Wood frame construction with vinyl siding; Stone and brick/mortar foundation; Metal and shingle roof
- Exterior features: Glassed-in porch; Porch; Interior lot; Near golf course, shopping, and town; Neighborhood setting; Level lot; Paved road
Interior
- Kitchen: Kitchen on first level; Refrigerator included
- Bedrooms: Bedroom 1 on second level; Bedroom 2 on second level; Bedroom 3 on second level
- Flooring: Carpet; Laminate
- Bathrooms: 2 full bathrooms
- Heating & cooling: Baseboard hot water heating; Circuit breaker electric service; Electric water heater
- Interior features: 7 total rooms; Unfinished full basement with interior entry and walk-out access
- Laundry & utility: Washer hookup on main level
Neighborhood map
What this means for you Summary
Snapshot
- This is a 3-bed/1.0-bath multifamily listed at $165k.
Deal economics
- At list price, monthly cash flow is $23 ($276/yr) — positive.
- The deal already cash-flows at list — no discount required.
- To meet the 1% rule (rent ≥ 1% of price), the offer needs to be $141k (14.5% below list).
- Recommended offer: $141k (14.5% below list) — sets the bar for 1% rule.
- Cap rate 6.9% vs local median 5.1% in Rumford — top-decile yield for the area; either an underpriced asset or a hidden risk that comps aren't pricing in. Stress-test before assuming the spread holds.
Location & tenants
- Location reads 75/100 on livability (#39 in ME, #4,030 nationally) — a middle-class / working-renter tenant base. Strengths: cost of living A+, housing A+, health & safety A+; Watch: commute D, schools F, amenities F.
- RSU 10 (rural): math 72% / reading 79% proficiency, ranked #107 of 112 in ME (top 96%) — strong family-tenant draw, lease renewals of 3-5y typical.
- Market conditions: 82 active listings in the ZIP; 3 comparable units currently listed for rent nearby; rentals lingering (median 45d on market — plan ~5-8 weeks vacancy on turnover, expect pricing pressure); 100% of comp listings sitting > 30 days — soft ceiling on asking rent; 329 units permitted in Oxford County in 2024 (0 in 5+ unit buildings).
Forward outlook
- In year one you build about $18k of equity ($1k loan paydown + $16k appreciation (10.0% local appreciation)).
- Oxford County population projected at -21% by 2050 — secular population decline; favor cash flow + early exit over multi-decade hold.
- At projected returns (10.0% appreciation + 3.0% rent growth), your $46k cash investment doubles in ~3 years — after that, you're playing with house money.
- By year 3, paydown + projected appreciation supports a ~$45k cash-out refi (75% LTV) — recoverable capital for the next deal without selling this one.
Negotiation context
- Only 13 days on market — expect competitive offers; lowballing is unlikely to land.
- 5 sale attempts since 15y ago with the ask held roughly flat each time — persistent listings suggest the price (not the market) is what's stuck; bring a comps-based counter.
- Current owner paid $26k; list at $165k implies a 547% gain — meaningful room to come down on a strong offer.
Risks & watch-outs
- Watch-outs: flood insurance adds $66/mo; built in 1908 — expect roof / HVAC / electrical / plumbing capex.
- Climate carrying-cost: major flood risk — expect insurance premiums to compound above CPI over the hold.
Questions for the listing agent
- Built in 1908 — when were the roof, HVAC, electrical panel, plumbing, and water heater last replaced?
- What's the actual annual flood-insurance premium (NFIP or private), and is the property in a SFHA with mandatory coverage?
- Is there a deadline driving the sale (1031 exchange, divorce, estate, relocation)? That informs how much negotiation room exists.
- Schools are F-rated, which usually means shorter tenancies and higher turnover. Who's the typical renter profile here, and what's been the actual vacancy rate?
- What's the average days-on-market for RENTAL listings here right now (not sales)? A rising rental-DOM trend means longer vacancies and softer asking-rent achievability than the comps imply.
- What's the recent tenant-quality profile in this submarket — average credit score on applications, eviction rate, late-payment / NSF rate, and stable-employment percentage? A property-management company in the area should have these aggregated.
- How much new apartment / multifamily construction is in the pipeline within 1–3 miles? Heavy new supply (>2% of stock underway) typically softens rents 12–24 months out; light construction supports rent growth.
Investment metrics
- 1% rule
- 0.86% ✗
- Cap rate
- 6.94%
- Cash-on-cash
- 2.32%
- DSCR
- 1.10
- GRM
- 9.7
CMA / ARV
No comps found within radius.
Projected returns pro-forma
10.0% appreciation · 3.0% rent growth · sell at horizon
- IRR
- 24.7%
- Equity multiple
- 2.98×
- Total profit
- $91,318
- Equity at exit
- $148,645
- IRR
- 21.8%
- Equity multiple
- 6.80×
- Total profit
- $267,750
- Equity at exit
- $320,559
Cash invested: $46,200 (down + closing). Projections, not guarantees.
Landlord ↔ Tenant lean methodology
- Overall (STATE)
- 41 Moderately Tenant-Leaning
- State Maine
- 41 Moderately Tenant-Leaning · D+2
- County
- — inherits STATE
- City
- — inherits STATE
ZIP-level market 04276
- Home prices YoY
- 4.4%
- Active inventory
- 82
- Price-to-rent
- 9.7×
Monthly cashflow live
- Estimated rent
- $1,411 medium interval (Pro) →
- Mortgage (P&I)
- −$865
- Tax from tax record
- −$92 /mo · $1,098/yr
- Insurance
- −$69
- Flood insurance flood zone
- −$66 /mo · $798/yr
- HOA
- −$0
- Vacancy / Maint / Mgmt
- −$296
- Net cashflow
- $23
Break-even live
Sensitivity live
| Price | -10% $116 | -5% $70 | +0% $23 | +5% $-24 | +10% $-70 |
|---|---|---|---|---|---|
| Rent | -10% $-89 | -5% $-33 | +0% $23 | +5% $79 | +10% $134 |
| Rate | -1.0pp $106 | -0.5pp $65 | base $23 | +0.5pp $-20 | +1.0pp $-63 |
UW: 25.0% down · 7.5% · 30yr · 1.5% tax · 5.0% vac · 8.0% maint · 8.0% mgmt
Financing live
Cash to close
- Down payment
- $41,250
- Closing costs
- $4,950
- Reserves months
- —
- Total cash needed
- —
Loan-product check · same deal, 3 products live
Conventional
25% down · 7.5% · 30yr
- Down + closing
- —
- Monthly P&I
- —
- Monthly cashflow
- —
- DSCR
- —
- Eligible?
- —
Personal DTI + credit; lowest rate.
DSCR
20% down · 8.5% · 30yr
- Down + closing
- —
- Monthly P&I
- —
- Monthly cashflow
- —
- DSCR
- —
- Eligible?
- —
No personal income docs; deal must DSCR.
Hard money
10% down · 12.0% · 12mo
- Down + closing
- —
- Monthly P&I
- —
- Monthly cashflow
- —
- DSCR
- —
- Eligible?
- —
Short-term bridge; refi at stabilization.
Rent comps 3 comps
| Address | Beds | Baths | Sqft | Rent | $/sqft | DOM | Units | Dist |
|---|---|---|---|---|---|---|---|---|
| 25 Maine Ave Unit 3R Rumford, ME | 2.0 | 1.0 | 750 | $1,100 | $1.47 | 45d | 1 | 1.09mi |
| 205 Cumberland St Unit 2R Rumford, ME | 3.0 | 1.0 | 1000 | $1,500 | $1.50 | 45d | 1 | 1.16mi |
| 30 Falmouth St Rumford, ME | 3.0 | 1.0 | 1000 | $1,700 | $1.70 | 45d | 1 | 1.34mi |
Listing history 10 events
-
2026-06-21days on market $165,000 Active 13 DOM
-
2026-06-21days on market $165,000 Active 12 DOM
-
2026-06-18days on market $165,000 Active 10 DOM
-
2026-06-17days on market $165,000 Active 9 DOM
-
2026-06-16days on market $165,000 Active 8 DOM
-
2026-06-15days on market $165,000 Active 7 DOM
-
2026-06-13days on market $165,000 Active 5 DOM
-
2026-06-12days on market $165,000 Active 4 DOM
-
2026-06-09remarks 307-char remark
-
2026-06-09$165,000 Active 1 DOM
ⓘ Source: listings_history table (triggers on properties + properties_extension) + one-shot
backfill from property_details.listing_events for pre-trigger history.
Tax reassessment forecast ME · Partial reset (capped growth)
- Current annual tax
- $1,098 · $92/mo
- Projected year-2 tax
- $1,671 · $139/mo
- Expected delta
- +$573/yr (+$48/mo · 52.2%)
ⓘ Screening estimate from a state-policy table — verify with the county assessor before closing.
Climate risk First Street
- Flood 7/10 Severe FEMA zone X (unshaded) · 99% chance over 30 yrs
- Wildfire 1/10 Low
- Heat 2/10 Low 7 d/yr ≥90°F today · 17 d/yr by 30 yrs out
- Wind 3/10 Moderate 6% chance of damaging wind over 30 yrs
- Air quality 2/10 Low 1 unhealthy d/yr today · 1 by 30 yrs out
Nearby sold comps map
Loading sold comps map…
Walkable amenities ~0.75 mi
Loading nearby amenities…
Taxation est. · year 1
- Rental income
- $16,936
- − Mortgage interest
- −$9,243
- − Property taxes
- −$1,098
- − Insurance
- −$1,622
- − Repairs & maintenance
- −$1,355
- − Management
- −$1,355
- − Depreciation
- −$4,800
- Taxable loss
- −$2,537
- Est. tax savings @ 24.0%
- +$609
- After-tax cash flow
- $884/yr
For passive investors: Depreciation is non-cash, so a rental often shows a tax loss while cash-flowing — sheltering income. Rental losses are passive: they offset passive income freely, and up to $25,000/yr can offset ordinary (W-2) income if you actively participate and your MAGI is under $100k (phasing out to $0 by $150k); unused losses carry forward. On sale, claimed depreciation is recaptured at up to 25%, and gains may owe capital-gains tax (a 1031 exchange can defer both). Figures are a year-1 estimate at your 24.0% rate — not tax advice; consult a CPA.
Schools (NCES district)
- District
- RSU 10
- NCES district ID
- 2314795
- Math proficiency
- 72% ▲ 50.00%
- Reading proficiency
- 79% ▲ 34.00%
- Median HH income
- $37,647
- Composite
- 62.72/100
- National rank
- #671
- State rank
- #107 of 112 in ME
Livability — Rumford
- Score
- 75/100
- State rank
- #39
- US rank
- #4030
Category grades
Schools grade is shown separately in the Schools card above.
Census & demographics
- Census place
- Rumford, ME
- Population (ZIP)
- 5,918
Population outlook (Oxford County) Hauer SSP2
- Today (2025)
- 55,853 people
- By 2030
- 54,190 · -3.0%
- By 2040
- 49,484 · -11.4%
- By 2050
- 43,958 · -21.3%
- By 2075
- 32,308 · -42.2%
- By 2100
- 21,858 · -60.9%
Race, ethnicity, and origin ACS 2023
- Neighborhood character
- Predominantly White (94%)
- Race & ethnicity
- White 94% Two or more races 4%
- Common ancestry
- Lithuanian 27% Slovak 5% German 2%
- Foreign-born
- 1% · Canada
- Languages at home
- 98% English-only · French/Haitian/Cajun 1% Tagalog/Filipino 1%
Political lean MEDSL · Oxford
- 2024 margin
- R (+12.9) · D 42.7% · R 55.6% · Other 1.7%
- 2008→2024 swing
- -28.9pp toward R · 2008: 16.0pp · 2024: -12.9pp
- All cycles
- 2024: R+12.9 2020: R+8.8 2016: R+13.0 2012: D+14.9 2008: D+16.0
Not yet ingested
- Civics
- —
Market trends
- HPI YoY
- ▲ 12.73%
- Current HPI
- 301.2786
- Rent YoY
- —
- Metro
- —
- State GDP YoY
- —
- F500 in state
- 0
Price history
+562.7% since first listed7 events — show timeline
- 2026-06-08 Listed $165,000 MREIS
- 2023-11-21 Delisted — MREIS
- 2023-09-18 Listed $135,000 MREIS
- 2014-08-21 Listed $37,000 MREIS
- 2013-05-31 Listed $31,900 MREIS
- 2011-10-27 Sold (MLS) $25,500 MREIS
- 2011-08-28 Listed $24,900 MREIS
Property tax history
+2.3%/yrLatest (2025): $1,098 · +12.7% YoY. Source: county tax records.
Cash-flow waterfall
monthlySold comps — $/sqft
last 12 mo · ≤1 miLoading sold comps…