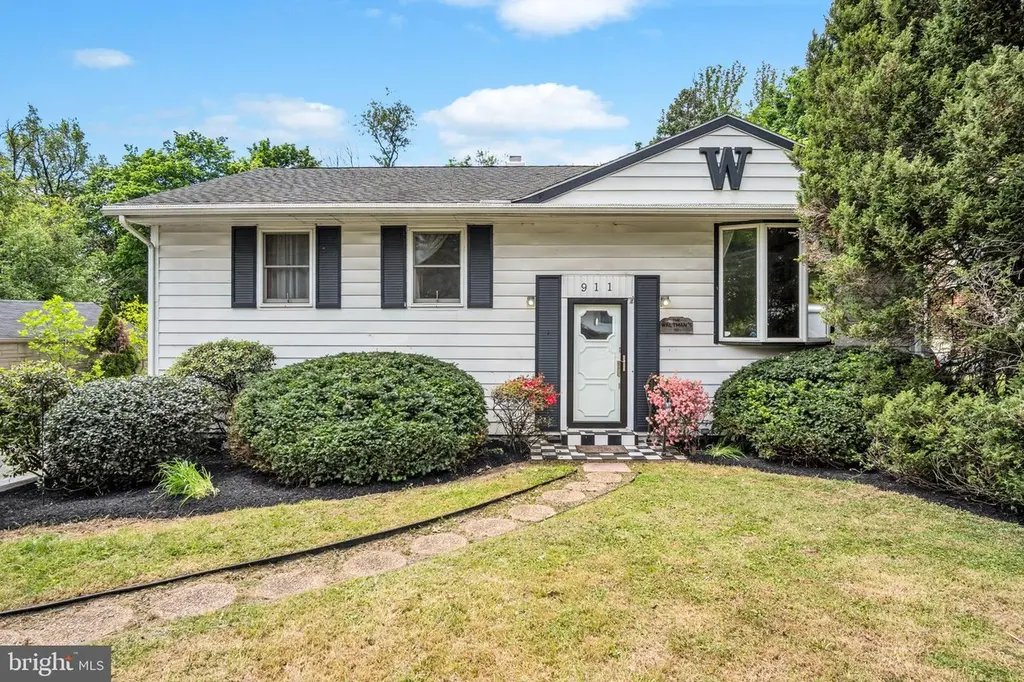
911 S Progress Ave · Progress, PA
Flood risk 1/10 · Minimal
- FEMA flood zone
- X (unshaded)
- Chance of flooding over 30 yrs
- 0.0%
- Est. flood insurance / yr
- $473 – $860
Fire risk 1/10 · Minimal
- Est. fire insurance / yr
- $511 – $949
Heat risk 5/10 · Moderate
- Hot days now (above 100°F)
- 6 days/yr
- Hot days in 30 yrs
- 13 days/yr
Wind risk 3/10 · Minor
- Chance of severe wind over 30 yrs
- 5.0%
Air-quality risk 3/10 · Minor
- Unhealthy air days now
- 2 days/yr
- Unhealthy air days in 30 yrs
- 4 days/yr
Risk factors via First Street. Map © Google.
Why this score? — see what drove the D grade
The composite is a weighted blend of 9 inputs, each scored 0–100. Each bar is that input's sub-score; the figure is the points it added to the 100-point composite (weight × sub-score).
- ARV discount +15.0/15.0
- Cash flow +9.7/30.0
- Livability +3.8/5.0
- Rent growth +3.4/5.0
- 1% rule +3.1/10.0
- DSCR +2.8/10.0
- Schools +2.6/10.0
- Condition / age +2.5/5.0
- Appreciation +0.0/10.0
$215,000
🖨 Deal sheet (PDF) 📄 Offer letter ✓ Due diligence
Listing remarks
All offers are due Tuesday 5/26/26 by 2 pm to list agent's email. This home is ready for you to put your touches on and make it your own. A 3 bedroom 1.5 bath home will provide instant equity as you update it to your liking. This property's yard and outdoor living has much to offer. A large cement deck over looking a fenced yard and lower level patio -- The level yard is ready for your fur babies to run and play. A separate fenced area for your garden is ready to be planted for this summer. The home's location is so convenient to shopping, schools and all services. Great storage shed for all your toys and gardening tools. The home has an oversized garage behind the home.
Key facts
- Close to schools
- Separate fenced area
- Large cement deck
Tags
Property features AI
Finance
- Other: Fee simple ownership; Not located in a federal flood zone
Exterior
- Parking: Attached carport (1 space); Off-street parking and driveway; Asphalt driveway with about 4 driveway spaces; Total of about 5 garage/parking spaces
- Utilities: Well water source; On-site septic system; 100 amp electric service; Electric hot water
- Home design: Detached structure; Frame construction; Architectural shingle roof; Block foundation; Above- and below-grade structures
- Construction: Frame construction; Block foundation; Architectural shingle roof; Estimated year built
- Exterior features: Exterior lighting; Deck(s); Chain link fencing; Backs to trees; Front yard and landscaped grounds; Level lot with rear yard
Interior
- Kitchen: Country-style kitchen; Kitchen/dining combination; Wet/dry bar
- Bedrooms: Three bedrooms on the main level
- Flooring: Carpet; Ceramic tile; Vinyl
- Bathrooms: One full bathroom on the main level; One half bathroom on a lower level
- Heating & cooling: Heat pump with electric backup; Electric heating fuel; Heat pump cooling; 100 amp electrical service; Electric hot water
- Interior features: Storm door; Tub/shower; Ceiling fan(s); Combination kitchen/dining; Traditional floor plan; Country-style kitchen; Wet/dry bar
- Laundry & utility: Basement with interior access and outside/rear entrances; Basement includes drain and workshop; Not furnished
Neighborhood map
What this means for you Summary
Snapshot
- This is a 3-bed/1.5-bath single-family listed at $215k.
Deal economics
- At list price, monthly cash flow is $-140 ($-2k/yr) — negative.
- To cash-flow at today's rent, offer at most $190k (11.5% below list).
- To meet the 1% rule (rent ≥ 1% of price), the offer needs to be $175k (18.7% below list).
- Recommended offer: $175k (18.7% below list) — sets the bar for 1% rule.
- Cap rate 5.5% vs local median 4.3% in Progress — meaningfully above typical; check what's discounted (condition, days-on-market, listing class) to confirm the premium yield is real.
Location & tenants
- Location reads 76/100 on livability (#385 in PA, #3,436 nationally) — a middle-class / working-renter tenant base. Strengths: cost of living A+, housing A+, health & safety A+; Watch: amenities F, commute F.
- Susquehanna Township SD (suburban): math 17% / reading 39% proficiency, ranked #444 of 539 in PA (top 82%) — low school quality limits family demand, transient renter base, plan for 1-2y turnover.
- Zoned schools: Thomas W Holtzman Jr El Sch (math 22% / reading 45%, grade F, #1,081 of 1,518 statewide, top 71%, 820 students, 67% FRL); Susquehanna Twp Ms (math 7% / reading 34%, grade F, #435 of 512 statewide, top 85%, 723 students, 63% FRL); Susquehanna Twp Hs (math 37% / reading 10%, grade F, #379 of 437 statewide, top 87%, 743 students, 55% FRL) — zoned schools average 62% FRL vs 35% district-wide (27 pts higher); higher-poverty schools than district average — tighter screening recommended.
- Market conditions: Rents rising (+3.8%/yr); 186 active listings in the ZIP; 9 comparable units currently listed for rent nearby; rentals at typical pace (median 23d on market — plan ~3-4 weeks tenant-placement turnaround); 44% of comp listings sitting > 30 days — soft ceiling on asking rent; solid renter incomes; 540 units permitted in Dauphin County in 2024 (194 in 5+ unit buildings).
Forward outlook
- Local home prices are declining (-3.0%/yr); year-one equity from $1k of loan paydown is wiped out by about $6k of value loss. Plan a longer hold.
Negotiation context
- It's been on market 18 days — a 2% lower offer ($212k) is reasonable based on typical stale-listing flexibility.
Risks & watch-outs
- Climate carrying-cost: extreme-heat days projected 6→13/yr by 2055 (HVAC capex compounding) — expect insurance premiums to compound above CPI over the hold.
Questions for the listing agent
- What do current leases actually rent for vs. the listed asking? Can we see a recent rent roll and the last 12 months of T-12 income?
- Built in 1961 — when were the roof, HVAC, electrical panel, plumbing, and water heater last replaced?
- Is there a deadline driving the sale (1031 exchange, divorce, estate, relocation)? That informs how much negotiation room exists.
- The area grade is low — what's the realistic commute time and amenity access for the typical tenant pool here? Any planned neighborhood developments (good or bad) we should know about?
- What's the average days-on-market for RENTAL listings here right now (not sales)? A rising rental-DOM trend means longer vacancies and softer asking-rent achievability than the comps imply.
- What's the recent tenant-quality profile in this submarket — average credit score on applications, eviction rate, late-payment / NSF rate, and stable-employment percentage? A property-management company in the area should have these aggregated.
- How much new for-sale + rental construction is in the pipeline within 1–3 miles? Heavy new supply typically softens prices + rents 12–24 months out; constrained supply supports both.
Investment metrics
- 1% rule
- 0.81% ✗
- Cap rate
- 5.51%
- Cash-on-cash
- -2.79%
- DSCR
- 0.88
- GRM
- 10.3
CMA / ARV
- ARV (median comp)
- $293,805
- List price
- $215,000
- Delta
- -26.82%
- Verdict
- UNDERPRICED
- Comps
- 20 within 1.0 mi
Show comp detail 12 sales within ~0.75 mi
| Address | Dist | Beds/Ba | Sqft | Sold | Price | $/sf | Match |
|---|---|---|---|---|---|---|---|
| 3700 Vista Ter | 0.46mi | 2/1.0 (-1) | 1,546 (-6%) | 1mo | $275,000 | $178 | 62 |
| 3802 Darby Rd | 0.72mi | 3/2.0 | 1,715 (+5%) | 1mo | $270,000 | $157 | 56 |
| 474 N 32nd St | 0.56mi | 3/2.0 | 1,740 (+6%) | 7mo | $275,000 | $158 | 56 |
| 3801 Bonnybrook Rd | 0.74mi | 3/3.0 | 1,645 (+0%) | 5mo | $330,000 | $201 | 55 |
| 308 Redwood St | 0.74mi | 2/1.5 (-1) | 1,586 (-3%) | 1mo | $160,000 | $101 | 54 |
| 630 S 29th St | 0.72mi | 3/1.5 | 1,508 (-8%) | 2mo | $250,000 | $166 | 52 |
| 522 Park Ter | 0.45mi | 3/1.5 | 1,868 (+14%) | 5mo | $286,000 | $153 | 52 |
| 3740 Elder Rd | 0.53mi | 3/1.5 | 1,428 (-13%) | 9mo | $225,000 | $158 | 46 |
| 25 N 31st St | 0.73mi | 3/1.5 | 1,821 (+11%) | 7mo | $240,000 | $132 | 41 |
| 10 Park Ter | 0.71mi | 3/1.5 | 1,450 (-12%) | 8mo | $250,000 | $172 | 41 |
| 313 S 31st St | 0.75mi | 3/1.5 | 1,873 (+14%) | 3mo | $320,000 | $171 | 39 |
| 3727 Montour St | 0.70mi | 2/2.0 (-1) | 1,400 (-15%) | 9mo | $238,777 | $171 | 29 |
Match score weights: distance 35% · size 25% · config 20% · recency 20%. Top-matched comps best support the ARV.
Projected returns pro-forma
-3.0% appreciation · 3.76% rent growth · sell at horizon
- IRR
- -20.1%
- Equity multiple
- 0.30×
- Total profit
- $-42,375
- Equity at exit
- $32,057
- IRR
- -11.4%
- Equity multiple
- 0.29×
- Total profit
- $-42,592
- Equity at exit
- $18,589
Cash invested: $60,200 (down + closing). Projections, not guarantees.
Landlord ↔ Tenant lean methodology
- Overall (STATE)
- 62 Landlord-Friendly
- State Pennsylvania
- 62 Landlord-Friendly · EVEN
- County
- — inherits STATE
- City
- — inherits STATE
ZIP-level market 17111
- Rents YoY
- 3.8%
- Active inventory
- 186
- Price-to-rent
- 10.3×
Monthly cashflow live
- Estimated rent
- $1,748 high interval (Pro) →
- Mortgage (P&I)
- −$1,127
- Tax from tax record
- −$304 /mo · $3,646/yr
- Insurance
- −$90
- HOA
- −$0
- Vacancy / Maint / Mgmt
- −$367
- Net cashflow
- $-140
Break-even live
Sensitivity live
| Price | -10% $-19 | -5% $-79 | +0% $-140 | +5% $-201 | +10% $-262 |
|---|---|---|---|---|---|
| Rent | -10% $-278 | -5% $-209 | +0% $-140 | +5% $-71 | +10% $-2 |
| Rate | -1.0pp $-32 | -0.5pp $-86 | base $-140 | +0.5pp $-196 | +1.0pp $-253 |
UW: 25.0% down · 7.5% · 30yr · 1.5% tax · 5.0% vac · 8.0% maint · 8.0% mgmt
Financing live
Cash to close
- Down payment
- $53,750
- Closing costs
- $6,450
- Reserves months
- —
- Total cash needed
- —
Loan-product check · same deal, 3 products live
Conventional
25% down · 7.5% · 30yr
- Down + closing
- —
- Monthly P&I
- —
- Monthly cashflow
- —
- DSCR
- —
- Eligible?
- —
Personal DTI + credit; lowest rate.
DSCR
20% down · 8.5% · 30yr
- Down + closing
- —
- Monthly P&I
- —
- Monthly cashflow
- —
- DSCR
- —
- Eligible?
- —
No personal income docs; deal must DSCR.
Hard money
10% down · 12.0% · 12mo
- Down + closing
- —
- Monthly P&I
- —
- Monthly cashflow
- —
- DSCR
- —
- Eligible?
- —
Short-term bridge; refi at stabilization.
Rent comps 9 comps
| Address | Beds | Baths | Sqft | Rent | $/sqft | DOM | Units | Dist |
|---|---|---|---|---|---|---|---|---|
| 649 S 23rd St Unit 1 Harrisburg, PA | 3.0 | 1.0 | 1450 | $1,465 | $1.01 | 45d | 1 | 1.06mi |
| 649 S 23rd St Harrisburg, PA | 3.0 | 1.0 | 1450 | $1,465 | $1.01 | 23d | 1 | 1.06mi |
| 217 N 40th St Unit 202 1 Harrisburg, PA | 2.0 | 1.0 | 1200 | $1,299 | $1.08 | 45d | 1 | 1.07mi |
| 4131 Spring Valley Rd Harrisburg, PA | 1.0–2.0 | 1.0–2.0 | 974 | $1,440 | $1.48 | 16d | 1 | 1.11mi |
| 2121 Kensington St Harrisburg, PA | 3.0 | 1.0 | 1088 | $1,450 | $1.33 | 45d | 1 | 1.21mi |
| 2016 Swatara St Harrisburg, PA | 3.0 | 1.0 | 1380 | $1,175 | $0.85 | 45d | 1 | 1.34mi |
| 4810 Etta Rd Harrisburg, PA | 3.0 | 2.0 | 2118 | $2,450 | $1.16 | 16d | 1 | 1.48mi |
| 301 N Progress Ave Harrisburg, PA | 1.0–3.0 | 1.0–2.0 | 1203 | $1,610 | $1.34 | 16d | 4 | 1.49mi |
| 821 Sequoia Dr Harrisburg, PA | 1.0–3.0 | 1.0–2.5 | 1200 | $1,945 | $1.62 | 16d | 42 | 1.49mi |
Listing history 1 events
-
2026-05-09$250,000 Active 416-char remark
ⓘ Source: listings_history table (triggers on properties + properties_extension) + one-shot
backfill from property_details.listing_events for pre-trigger history.
Tax reassessment forecast PA · Partial reset (capped growth)
- Current annual tax
- $3,646 · $304/mo
- Projected year-2 tax
- $3,646 · $304/mo
- Expected delta
- $0/yr ($0/mo · 0.0%)
ⓘ Screening estimate from a state-policy table — verify with the county assessor before closing.
Climate risk First Street
- Flood 1/10 Low FEMA zone X (unshaded) · 0% chance over 30 yrs
- Wildfire 1/10 Low
- Heat 5/10 Major 6 d/yr ≥100°F today · 13 d/yr by 30 yrs out
- Wind 3/10 Moderate 5% chance of damaging wind over 30 yrs
- Air quality 3/10 Moderate 2 unhealthy d/yr today · 4 by 30 yrs out
Nearby sold comps map
Loading sold comps map…
Walkable amenities ~0.75 mi
Loading nearby amenities…
Taxation est. · year 1
- Rental income
- $20,973
- − Mortgage interest
- −$12,043
- − Property taxes
- −$3,646
- − Insurance
- −$1,075
- − Repairs & maintenance
- −$1,678
- − Management
- −$1,678
- − Depreciation
- −$6,255
- Taxable loss
- −$5,402
- Est. tax savings @ 24.0%
- +$1,296
- After-tax cash flow
- $-386/yr
For passive investors: Depreciation is non-cash, so a rental often shows a tax loss while cash-flowing — sheltering income. Rental losses are passive: they offset passive income freely, and up to $25,000/yr can offset ordinary (W-2) income if you actively participate and your MAGI is under $100k (phasing out to $0 by $150k); unused losses carry forward. On sale, claimed depreciation is recaptured at up to 25%, and gains may owe capital-gains tax (a 1031 exchange can defer both). Figures are a year-1 estimate at your 24.0% rate — not tax advice; consult a CPA.
Schools (NCES district)
- District
- Susquehanna Township SD
- NCES district ID
- 4223010
- Math proficiency
- 17% ▼ -15.00%
- Reading proficiency
- 39% ▼ -10.00%
- Median HH income
- $61,794
- Composite
- 25.59/100
- National rank
- #7424
- State rank
- #444 of 539 in PA
Livability — Progress
- Score
- 76/100
- State rank
- #385
- US rank
- #3436
Category grades
Schools grade is shown separately in the Schools card above.
Census & demographics
- County
- Dauphin County · 247,857 people
- City population
- 27,422
- Metro
- Harrisburg-Carlisle, PA
- Population (ZIP)
- 36,744
- Household income
- $86,385
- Rent vs Own
- Severe rent burden
- 756.0
Population outlook (Dauphin County) Hauer SSP2
- Today (2025)
- 281,628 people
- By 2030
- 283,549 · +0.7%
- By 2040
- 285,385 · +1.3%
- By 2050
- 286,188 · +1.6%
- By 2075
- 291,053 · +3.3%
- By 2100
- 282,374 · +0.3%
Race, ethnicity, and origin ACS 2023
- Neighborhood character
- Diverse neighborhood (Simpson 0.65)
- Race & ethnicity
- White 53% Black 22% Asian 13% Hispanic / Latino 8% Two or more races 6%
- Hispanic origin (detail)
- Mexican 1% Puerto Rican 4%
- Common ancestry
- Romanian 4% Lithuanian 1% Serbian 1%
- Foreign-born
- 14% · India, Canada, Vietnam
- Languages at home
- 83% English-only · Other Indo-European 7% Spanish 6% Vietnamese 1%
Political lean MEDSL · Dauphin
- 2024 margin
- Lean D (+5.9) · D 52.4% · R 46.5% · Other 1.1%
- 2008→2024 swing
- -3.1pp toward R · 2008: 9.1pp · 2024: 5.9pp
- All cycles
- 2024: D+5.9 2020: D+8.5 2016: D+2.8 2012: D+6.0 2008: D+9.1
Not yet ingested
- Civics
- —
Market trends
- HPI YoY
- ▼ -140.67%
- Current HPI
- 236.6936
- Rent YoY
- ▲ 3.76%
- Metro
- Harrisburg-Carlisle, PA
- State GDP YoY
- ▲ 1.68%
- F500 in state
- 34
Industry mix (Fortune 500 HQ in PA)
| Industry | F500 HQs | Revenue |
|---|---|---|
| Healthcare | 2 | $309B |
|
||
| Insurance | 2 | $27B |
|
||
| Telecommunications / Media | 1 | $124B |
|
||
| Industrial Distribution | 1 | $22B |
|
||
| Financial Services | 1 | $20B |
|
||
| Chemicals / Materials | 1 | $18B |
|
||
Price history
-14.0% since first listed3 events — show timeline
- 2026-05-27 Pending — BRIGHT MLS
- 2026-05-22 Price Changed $215,000 BRIGHT MLS
- 2026-05-09 Listed $250,000 BRIGHT MLS
Property tax history
+3.1%/yrLatest (2026): $3,646 · +5.7% YoY. Source: county tax records.
Cash-flow waterfall
monthlySold comps — $/sqft
last 12 mo · ≤1 miLoading sold comps…