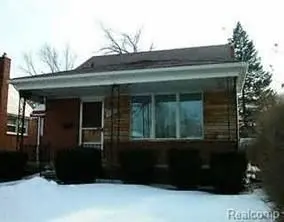
21733 Audette St · Dearborn, MI
Flood risk 1/10 · Minimal
- FEMA flood zone
- X (unshaded)
- Chance of flooding over 30 yrs
- 0.0%
- Est. flood insurance / yr
- $473 – $860
Fire risk 1/10 · Minimal
- Est. fire insurance / yr
- $784 – $1,456
Heat risk 3/10 · Minor
- Hot days now (above 98°F)
- 7 days/yr
- Hot days in 30 yrs
- 15 days/yr
Wind risk 2/10 · Minimal
- Chance of severe wind over 30 yrs
- —
Air-quality risk 3/10 · Minor
- Unhealthy air days now
- 2 days/yr
- Unhealthy air days in 30 yrs
- 4 days/yr
Risk factors via First Street. Map © Google.
Why this score? — see what drove the B- grade
The composite is a weighted blend of 9 inputs, each scored 0–100. Each bar is that input's sub-score; the figure is the points it added to the 100-point composite (weight × sub-score).
- Cash flow +25.0/30.0
- ARV discount +15.0/15.0
- DSCR +8.2/10.0
- 1% rule +7.2/10.0
- Livability +4.0/5.0
- Rent growth +3.4/5.0
- Schools +2.8/10.0
- Condition / age +2.5/5.0
- Appreciation +0.0/10.0
$149,900
🖨 Deal sheet 📄 Offer letter ✓ Due diligence
Listing remarks MLS
BUNGALOW HOME, WITH 3 BEDROOMS, 2 FULL BATH, KITCHEN, LIVING ROOM, DINING ROOM, BASEMENT, AND 2 CAR GARAGE.
Key facts
- 4,792 sq ft lot
- 2 garage spots
- Built 1967
Neighborhood map
What this means for you Summary
Snapshot
- This is a 3-bed/2.0-bath single-family listed at $150k.
Deal economics
- At list price, monthly cash flow is $328 ($4k/yr) — positive.
- The deal already cash-flows at list — no discount required.
- Meets the 1% rule at list price ($2k rent vs $150k).
- Cap rate 8.9% vs local median 4.3% in Dearborn — top-decile yield for the area; either an underpriced asset or a hidden risk that comps aren't pricing in. Stress-test before assuming the spread holds.
Location & tenants
- Location reads 80/100 on livability (#84 in MI, #1,904 nationally) — a professional / high-income tenant draw. Strengths: commute A+, cost of living A+, housing A+; Watch: amenities D, schools D-.
- Dearborn City School District (urban): math 26% / reading 39% proficiency, ranked #325 of 540 in MI (top 60%) — families likely to look elsewhere, expect single-tenant / working-renter base with shorter leases; 66% free/reduced lunch — lower-income household profile, screen leases tightly.
- Market conditions: Rents rising (+3.6%/yr); 148 active listings in the ZIP; 19 comparable units currently listed for rent nearby; rentals leasing fast (median 11d on market — plan ~1-2 weeks tenant-placement turnaround); solid renter incomes; 2,639 units permitted in Wayne County in 2024 (1,216 in 5+ unit buildings).
Forward outlook
- Local home prices are declining (-3.0%/yr); year-one equity from $1k of loan paydown is wiped out by about $4k of value loss. Plan a longer hold.
- Wayne County population projected at -17% by 2050 — secular population decline; favor cash flow + early exit over multi-decade hold.
Negotiation context
- Only 7 days on market — expect competitive offers; lowballing is unlikely to land.
- 11 sale attempts since 24y ago with the ask held roughly flat each time — persistent listings suggest the price (not the market) is what's stuck; bring a comps-based counter.
Questions for the listing agent
- Built in 1967 — when were the roof, HVAC, electrical panel, plumbing, and water heater last replaced?
- Is there a deadline driving the sale (1031 exchange, divorce, estate, relocation)? That informs how much negotiation room exists.
- Schools are D-rated, which usually means shorter tenancies and higher turnover. Who's the typical renter profile here, and what's been the actual vacancy rate?
- What's the average days-on-market for RENTAL listings here right now (not sales)? A rising rental-DOM trend means longer vacancies and softer asking-rent achievability than the comps imply.
- What's the recent tenant-quality profile in this submarket — average credit score on applications, eviction rate, late-payment / NSF rate, and stable-employment percentage? A property-management company in the area should have these aggregated.
- How much new for-sale + rental construction is in the pipeline within 1–3 miles? Heavy new supply typically softens prices + rents 12–24 months out; constrained supply supports both.
Investment metrics
- 1% rule
- 1.22% ✓
- Cap rate
- 8.92%
- Cash-on-cash
- 9.38%
- DSCR
- 1.42
- GRM
- 6.8
CMA / ARV
- ARV (on-the-fly)
- $238,966
- Comps found
- 12
Show comp detail 12 sales within ~0.75 mi
| Address | Dist | Beds/Ba | Sqft | Sold | Price | $/sf | Match |
|---|---|---|---|---|---|---|---|
| 22101 Francis St | 0.38mi | 3/1.5 | 1,403 (-1%) | 1mo | $305,000 | $217 | 78 |
| 3020 Williams St | 0.20mi | 2/1.5 (-1) | 1,352 (-4%) | 2mo | $220,000 | $163 | 74 |
| 21230 Audette St | 0.23mi | 4/2.0 (+1) | 1,248 (-12%) | 1mo | $202,500 | $162 | 64 |
| 3205 Lincoln St | 0.42mi | 3/1.0 | 1,500 (+6%) | 4mo | $193,000 | $129 | 63 |
| 3400 Dudley St | 0.41mi | 2/1.0 (-1) | 1,370 (-3%) | 6mo | $120,000 | $88 | 61 |
| 2920 Hubbard St | 0.54mi | 3/1.0 | 1,534 (+8%) | 1mo | $220,000 | $143 | 56 |
| 21709 Edna St | 0.65mi | 3/2.0 | 1,521 (+8%) | 6mo | $325,000 | $214 | 52 |
| 22153 Park St | 0.73mi | 3/2.0 | 1,552 (+10%) | 0mo | $305,000 | $197 | 50 |
| 2829 Bennett St | 0.56mi | 3/1.0 | 1,244 (-12%) | 1mo | $209,900 | $169 | 49 |
| 22742 Beech St | 0.56mi | 3/1.5 | 1,594 (+13%) | 2mo | $359,500 | $226 | 49 |
| 21522 Audrey St | 0.57mi | 3/1.0 | 1,213 (-14%) | 4mo | $230,000 | $190 | 42 |
| 23256 Cleveland St | 0.72mi | 2/1.0 (-1) | 1,520 (+8%) | 6mo | $160,000 | $105 | 40 |
Match score weights: distance 35% · size 25% · config 20% · recency 20%. Top-matched comps best support the ARV.
Projected returns pro-forma
-3.0% appreciation · 3.57% rent growth · sell at horizon
- IRR
- -1.4%
- Equity multiple
- 0.95×
- Total profit
- $-2,246
- Equity at exit
- $22,351
- IRR
- 9.0%
- Equity multiple
- 1.71×
- Total profit
- $29,682
- Equity at exit
- $12,961
Cash invested: $41,972 (down + closing). Projections, not guarantees.
Landlord ↔ Tenant lean methodology
- Overall (STATE)
- 62 Landlord-Friendly
- State Michigan
- 62 Landlord-Friendly · EVEN
- County
- — inherits STATE
- City
- — inherits STATE
ZIP-level market 48124
- Rents YoY
- 3.6%
- Active inventory
- 148
- Price-to-rent
- 6.8×
Monthly cashflow live
- Estimated rent
- $1,835 high interval (Pro) →
- Mortgage (P&I)
- −$786
- Tax from tax record
- −$273 /mo · $3,270/yr
- Insurance
- −$62
- HOA
- −$0
- Vacancy / Maint / Mgmt
- −$385
- Net cashflow
- $328
Break-even live
UW: 25.0% down · 7.5% · 30yr · 1.5% tax · 5.0% vac · 8.0% maint · 8.0% mgmt
Financing live
Cash to close
- Down payment
- $37,475
- Closing costs
- $4,497
- Reserves months
- —
- Total cash needed
- —
Loan-product check · same deal, 3 products live
Conventional
25% down · 7.5% · 30yr
- Down + closing
- —
- Monthly P&I
- —
- Monthly cashflow
- —
- DSCR
- —
- Eligible?
- —
Personal DTI + credit; lowest rate.
DSCR
20% down · 8.5% · 30yr
- Down + closing
- —
- Monthly P&I
- —
- Monthly cashflow
- —
- DSCR
- —
- Eligible?
- —
No personal income docs; deal must DSCR.
Hard money
10% down · 12.0% · 12mo
- Down + closing
- —
- Monthly P&I
- —
- Monthly cashflow
- —
- DSCR
- —
- Eligible?
- —
Short-term bridge; refi at stabilization.
Rent comps 19 comps
| Address | Beds | Baths | Sqft | Rent | $/sqft | DOM | Units | Dist |
|---|---|---|---|---|---|---|---|---|
| 21337 Audette St Dearborn, MI | 3.0 | 1.0 | 964 | $1,850 | $1.92 | 43d | 1 | 0.17mi |
| 3620 Monroe St Dearborn, MI | 3.0 | 2.0 | 1100 | $1,800 | $1.64 | 10d | 1 | 0.59mi |
| 2825 Queen St Dearborn, MI | 2.0 | 1.0 | 1000 | $1,299 | $1.30 | 43d | 1 | 0.67mi |
| 2823 Queen St Dearborn, MI | 3.0 | 2.0 | 1400 | $1,599 | $1.14 | 18d | 1 | 0.67mi |
| 22340 Park St Dearborn, MI | 2.0 | 1.0 | 1056 | $1,350 | $1.28 | 5d | 1 | 0.68mi |
| 20728 Carlysle St Dearborn, MI | 3.0 | 1.0 | 1087 | $1,850 | $1.70 | 1d | 1 | 0.73mi |
| 1008 S Military St Dearborn, MI | 2.0 | 1.5 | 1500 | $2,295 | $1.53 | 43d | 1 | 0.77mi |
| 2631 Woodside St Dearborn, MI | 3.0 | 1.0 | 894 | $1,650 | $1.85 | 1d | 1 | 1.02mi |
| 3901 Academy St Dearborn Heights, MI | 4.0 | 2.0 | 1400 | $2,100 | $1.50 | 1d | 1 | 1.09mi |
| 21954 Morley Ave #108 Dearborn, MI | 2.0 | 1.0 | 1000 | $1,750 | $1.75 | 24d | 1 | 1.12mi |
| 4638 Gertrude St Dearborn Heights, MI | 3.0 | 1.0 | 1020 | $1,700 | $1.67 | 5d | 1 | 1.18mi |
| 4757 Dudley St Dearborn Heights, MI | 3.0 | 1.0 | 995 | $1,350 | $1.36 | 11d | 1 | 1.20mi |
| 4810 Campbell St Dearborn Heights, MI | 3.0 | 1.0 | 1000 | $1,700 | $1.70 | 1d | 1 | 1.21mi |
| 4914 Gertrude St Dearborn Heights, MI | 2.0 | 1.0 | 908 | $1,230 | $1.35 | 17d | 1 | 1.28mi |
| 4934 McKinley St Dearborn Heights, MI | 3.0 | 1.0 | 1051 | $1,700 | $1.62 | 1d | 1 | 1.31mi |
| 4631 Ziegler St Dearborn Heights, MI | 3.0 | 1.0 | 1050 | $1,650 | $1.57 | 43d | 1 | 1.42mi |
| 4704 Jackson St Dearborn Heights, MI | 3.0 | 1.0 | 1000 | $1,500 | $1.50 | 21d | 1 | 1.42mi |
| 24154 Dartmouth St Dearborn, MI | 2.0 | 1.0 | 950 | $1,275 | $1.34 | 15d | 1 | 1.46mi |
| 24442 Union St Dearborn, MI | 3.0 | 1.5 | 1000 | $1,900 | $1.90 | 1d | 1 | 1.49mi |
Listing history 32 events
-
2025-06-27status Pending
-
2025-03-25historical
-
2024-12-17status Pending
-
2022-09-23status Pending
-
2019-07-16historical
-
2018-12-05status Pending 107-char remark
Show marketing remark (107 chars)
BUNGALOW HOME, WITH 3 BEDROOMS, 2 FULL BATH, KITCHEN, LIVING ROOM, DINING ROOM, BASEMENT, AND 2 CAR GARAGE.
-
2018-07-20historical 107-char remark
Show marketing remark (107 chars)
BUNGALOW HOME, WITH 3 BEDROOMS, 2 FULL BATH, KITCHEN, LIVING ROOM, DINING ROOM, BASEMENT, AND 2 CAR GARAGE.
-
2018-06-08status Pending
-
2018-06-06historical
-
2018-05-14status Pending 107-char remark
Show marketing remark (107 chars)
BUNGALOW HOME, WITH 3 BEDROOMS, 2 FULL BATH, KITCHEN, LIVING ROOM, DINING ROOM, BASEMENT, AND 2 CAR GARAGE.
-
2018-05-14status Pending
Show marketing remark (107 chars)
BUNGALOW HOME, WITH 3 BEDROOMS, 2 FULL BATH, KITCHEN, LIVING ROOM, DINING ROOM, BASEMENT, AND 2 CAR GARAGE.
-
2018-05-14status Pending
Show marketing remark (107 chars)
BUNGALOW HOME, WITH 3 BEDROOMS, 2 FULL BATH, KITCHEN, LIVING ROOM, DINING ROOM, BASEMENT, AND 2 CAR GARAGE.
-
2018-05-14historical
Show marketing remark (107 chars)
BUNGALOW HOME, WITH 3 BEDROOMS, 2 FULL BATH, KITCHEN, LIVING ROOM, DINING ROOM, BASEMENT, AND 2 CAR GARAGE.
-
2018-05-14historical
Show marketing remark (107 chars)
BUNGALOW HOME, WITH 3 BEDROOMS, 2 FULL BATH, KITCHEN, LIVING ROOM, DINING ROOM, BASEMENT, AND 2 CAR GARAGE.
-
2018-05-07$149,900 Active
Show marketing remark (107 chars)
BUNGALOW HOME, WITH 3 BEDROOMS, 2 FULL BATH, KITCHEN, LIVING ROOM, DINING ROOM, BASEMENT, AND 2 CAR GARAGE.
-
2018-05-07$149,900 Active 107-char remark
Show marketing remark (107 chars)
BUNGALOW HOME, WITH 3 BEDROOMS, 2 FULL BATH, KITCHEN, LIVING ROOM, DINING ROOM, BASEMENT, AND 2 CAR GARAGE.
-
2018-05-07$149,900 Active
Show marketing remark (107 chars)
BUNGALOW HOME, WITH 3 BEDROOMS, 2 FULL BATH, KITCHEN, LIVING ROOM, DINING ROOM, BASEMENT, AND 2 CAR GARAGE.
-
2018-05-07$149,900
Show marketing remark (107 chars)
BUNGALOW HOME, WITH 3 BEDROOMS, 2 FULL BATH, KITCHEN, LIVING ROOM, DINING ROOM, BASEMENT, AND 2 CAR GARAGE.
-
2003-11-17soldstatus $135,000
-
2003-08-27soldstatus $135,000
-
2003-06-10historical
-
2003-05-30$149,900
-
2003-05-30historical
-
2003-05-28$157,900
-
2003-05-28historical
-
2003-04-07$157,900
-
2003-04-07historical
-
2003-03-27$159,900
-
2003-03-27$159,900
-
2003-03-10$159,900
-
2002-11-22historical
-
2002-10-17$159,900
ⓘ Source: listings_history table (triggers on properties + properties_extension) + one-shot
backfill from property_details.listing_events for pre-trigger history.
Tax reassessment forecast MI · Partial reset (capped growth)
- Current annual tax
- $3,270 · $273/mo
- Projected year-2 tax
- $3,270 · $273/mo
- Expected delta
- $0/yr ($0/mo · 0.0%)
ⓘ Screening estimate from a state-policy table — verify with the county assessor before closing.
Climate risk First Street
- Flood 1/10 Low FEMA zone X (unshaded) · 0% chance over 30 yrs
- Wildfire 1/10 Low
- Heat 3/10 Moderate 7 d/yr ≥98°F today · 15 d/yr by 30 yrs out
- Wind 2/10 Low
- Air quality 3/10 Moderate 2 unhealthy d/yr today · 4 by 30 yrs out
Nearby sold comps map
Loading sold comps map…
Walkable amenities ~0.75 mi
Loading nearby amenities…
Taxation est. · year 1
- Rental income
- $22,015
- − Mortgage interest
- −$8,397
- − Property taxes
- −$3,270
- − Insurance
- −$750
- − Repairs & maintenance
- −$1,761
- − Management
- −$1,761
- − Depreciation
- −$4,361
- Taxable income
- $1,715
- Est. tax owed @ 24.0%
- −$412
- After-tax cash flow
- $3,527/yr
For passive investors: Depreciation is non-cash, so a rental often shows a tax loss while cash-flowing — sheltering income. Rental losses are passive: they offset passive income freely, and up to $25,000/yr can offset ordinary (W-2) income if you actively participate and your MAGI is under $100k (phasing out to $0 by $150k); unused losses carry forward. On sale, claimed depreciation is recaptured at up to 25%, and gains may owe capital-gains tax (a 1031 exchange can defer both). Figures are a year-1 estimate at your 24.0% rate — not tax advice; consult a CPA.
Schools (NCES district)
- District
- Dearborn City School District
- NCES district ID
- 2611600
- Math proficiency
- 26% ▼ -14.00%
- Reading proficiency
- 39% ▼ -8.00%
- Median HH income
- $46,884
- Composite
- 27.93/100
- National rank
- #6864
- State rank
- #325 of 540 in MI
Livability — Dearborn
- Score
- 80/100
- State rank
- #84
- US rank
- #1904
Category grades
Schools grade is shown separately in the Schools card above.
Census & demographics
- Census place
- Dearborn, MI
- County
- Wayne County · 1,562,939 people
- City population
- 86,476
- Metro
- Detroit-Warren-Dearborn, MI
- Population (ZIP)
- 34,479
- Household income
- $81,796
- Rent vs Own
- Severe rent burden
- 444.0
Population outlook (Wayne County) Hauer SSP2
- Today (2025)
- 1,675,273 people
- By 2030
- 1,620,300 · -3.3%
- By 2040
- 1,502,341 · -10.3%
- By 2050
- 1,384,039 · -17.4%
- By 2075
- 1,124,592 · -32.9%
- By 2100
- 881,193 · -47.4%
Race, ethnicity, and origin ACS 2023
- Neighborhood character
- Predominantly White (84%)
- Race & ethnicity
- White 84% Two or more races 7% Hispanic / Latino 5% Black 4%
- Hispanic origin (detail)
- Mexican 3%
- Common ancestry
- Romanian 12% Lithuanian 4% Slovak 3%
- Foreign-born
- 10% · Canada
- Languages at home
- 82% English-only · Arabic 12% Spanish 2% Other Indo-European 2%
Political lean MEDSL · Wayne
- 2024 margin
- Strong D (+29.0) · D 62.7% · R 33.7% · Other 3.6%
- 2008→2024 swing
- -20.5pp toward R · 2008: 49.5pp · 2024: 29.0pp
- All cycles
- 2024: D+29.0 2020: D+38.1 2016: D+37.3 2012: D+46.9 2008: D+49.5
Not yet ingested
- Civics
- —
Market trends
- HPI YoY
- ▼ -278.39%
- Current HPI
- 204.5229
- Rent YoY
- ▲ 3.57%
- Metro
- Detroit-Warren-Dearborn, MI
- State GDP YoY
- ▲ 1.37%
- F500 in state
- 28
Industry mix (Fortune 500 HQ in MI)
| Industry | F500 HQs | Revenue |
|---|---|---|
| Automotive Parts | 3 | $48B |
|
||
| Automotive | 2 | $372B |
|
||
| Chemicals | 1 | $45B |
|
||
| Automotive Retail | 1 | $29B |
|
||
| Healthcare / Medical Devices | 1 | $23B |
|
||
| Automotive Technology | 1 | $20B |
|
||
Price history
-6.3% since first listed32 events — show timeline
- 2025-06-27 Pending — REALCOMP
- 2025-03-25 Listing Removed — REALCOMP
- 2024-12-17 Pending — REALCOMP
- 2022-09-23 Pending — REALCOMP
- 2019-07-16 Listing Removed — REALCOMP
- 2018-12-05 Pending — MiRealSource-MiMLS
- 2018-07-20 Listing Removed — MiRealSource-MiMLS
- 2018-06-08 Pending — REALCOMP
- 2018-06-06 Listing Removed — REALCOMP
- 2018-05-14 Pending — MiRealSource-MiMLS
- 2018-05-14 Pending — MiRealSource-MiMLS
- 2018-05-14 Pending — REALCOMP
- 2018-05-14 Listing Removed — REALCOMP
- 2018-05-14 Listing Removed — MiRealSource-MiMLS
- 2018-05-07 Listed $149,900 REALCOMP
- 2018-05-07 Listed $149,900 MiRealSource-MiMLS
- 2018-05-07 Listed $149,900 MiRealSource-MiMLS
- 2018-05-07 Listed $149,900 REALCOMP
- 2003-11-17 Sold (Public Records) $135,000 Public Records
- 2003-08-27 Sold (MLS) $135,000 REALCOMP
- 2003-06-10 Listing Removed — MiRealSource-MiMLS
- 2003-05-30 Listing Removed — REALCOMP
- 2003-05-30 Listed $149,900 REALCOMP
- 2003-05-28 Listing Removed — REALCOMP
- 2003-05-28 Listed $157,900 REALCOMP
- 2003-04-07 Listing Removed — REALCOMP
- 2003-04-07 Listed $157,900 REALCOMP
- 2003-03-27 Listed $159,900 REALCOMP
- 2003-03-27 Listed $159,900 MiRealSource-MiMLS
- 2003-03-10 Listed $159,900 REALCOMP
- 2002-11-22 Listing Removed — REALCOMP
- 2002-10-17 Listed $159,900 REALCOMP
Property tax history
+0.5%/yrLatest (2025): $3,270 · -24.6% YoY. Source: county tax records.
Cash-flow waterfall
monthlySold comps — $/sqft
last 12 mo · ≤1 miLoading sold comps…