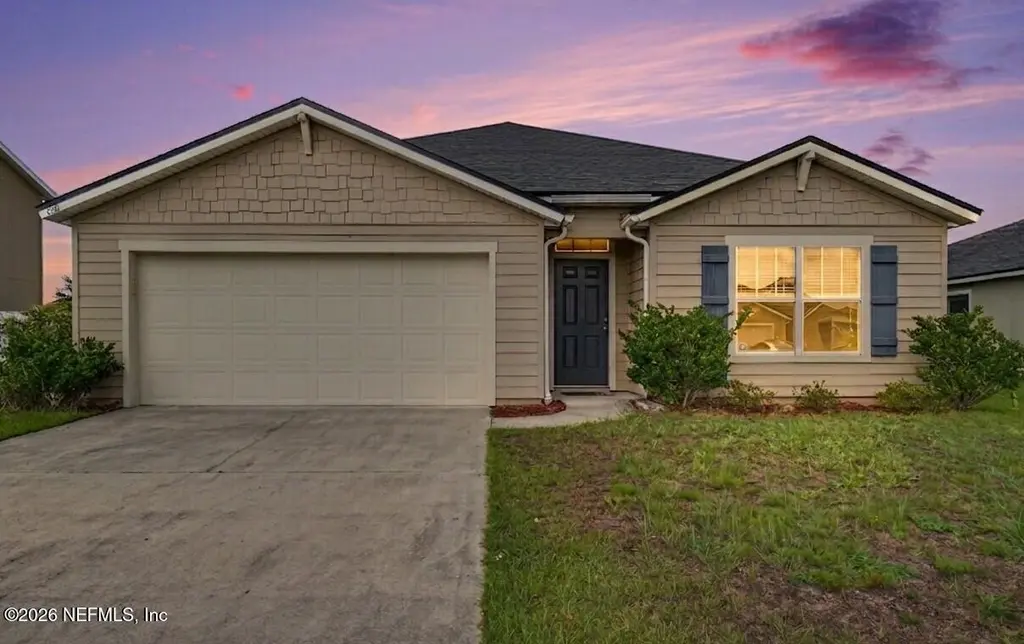
6112 Black Filly Ln · Jacksonville, FL
Flood risk 1/10 · Minimal
- FEMA flood zone
- X (unshaded)
- Chance of flooding over 30 yrs
- 0.0%
- Est. flood insurance / yr
- $507 – $1,088
Fire risk 8/10 · Major
- Est. fire insurance / yr
- $947 – $1,759
Heat risk 8/10 · Major
- Hot days now (above 108°F)
- 7 days/yr
- Hot days in 30 yrs
- 20 days/yr
Wind risk 9/10 · Severe
- Chance of severe wind over 30 yrs
- 99.0%
Air-quality risk 3/10 · Minor
- Unhealthy air days now
- 2 days/yr
- Unhealthy air days in 30 yrs
- 3 days/yr
Risk factors via First Street. Map © Google.
Why this score? — see what drove the D+ grade
The composite is a weighted blend of 9 inputs, each scored 0–100. Each bar is that input's sub-score; the figure is the points it added to the 100-point composite (weight × sub-score).
- ARV discount +13.3/15.0
- Cash flow +8.9/30.0
- Appreciation +5.2/10.0
- Livability +4.2/5.0
- Schools +3.9/10.0
- 1% rule +3.8/10.0
- DSCR +2.5/10.0
- Rent growth +2.5/5.0
- Condition / age +2.5/5.0
$270,000
🖨 Deal sheet (PDF) 📄 Offer letter ✓ Due diligence
Listing remarks MLS
Step into this beautifully maintained home offering an open, airy floor plan and tranquil pond views. Start your mornings with a cup of coffee in the bright dining area, where large windows invite natural light and scenic water views. The kitchen, in pristine condition, is the heart of the home—perfect for both everyday living and entertaining. Built in 2015, this home still feels brand new with thoughtful care and updates throughout. You'll find four generously sized bedrooms, providing plenty of space for family, guests, or a home office. One standout feature is the Lifestyle Screen Garage Door—a fully retractable screen system with a walk-through door, ideal for enjoying fresh air, hosting gatherings, or creating a versatile bonus space. Plus, the garage is fully tiled for a clean, finished look. Located in a sought-after community with fantastic amenities including a sparkling community pool and more, this home offers comfort, style, and functionality all in one.
Key facts
- 8,712 sq ft lot
- 2 garage spots
- Community pool
Property features AI
Finance
- HOA & community: Part of Winchester Ridge association; Association amenities include children's pool, clubhouse, fitness center; Association fee $150 annually; CDD fee applies
Exterior
- Parking: Garage; 2-car garage
- Utilities: Public sewer; Cable connected; Electricity connected; Sewer connected; Water connected
- Home design: Single family residence; One story; Residential use
- Construction: Shingle roof
- Exterior features: Shingle roof; Pond on the property; East-facing
Interior
- Kitchen: Dishwasher; Disposal; Electric range; Microwave; Refrigerator
- Bedrooms: 4 bedrooms
- Flooring: Carpet; Tile
- Bathrooms: 2 full bathrooms
- Heating & cooling: Central heating; Central air conditioning; Has heating and cooling
- Interior features: Breakfast bar; Eat-in kitchen; Open floorplan; Pantry; Primary bedroom on main level
- Laundry & utility: Unfurnished
Neighborhood map
What this means for you Summary
Snapshot
- This is a 4-bed/2.0-bath single-family listed at $270k.
Deal economics
- At list price, monthly cash flow is $-216 ($-3k/yr) — negative.
- To cash-flow at today's rent, offer at most $232k (14.1% below list).
- To meet the 1% rule (rent ≥ 1% of price), the offer needs to be $239k (11.6% below list).
- Recommended offer: $232k (14.1% below list) — sets the bar for cash-flow.
- Cap rate 5.3% vs local median 3.9% in Jacksonville — top-decile yield for the area; either an underpriced asset or a hidden risk that comps aren't pricing in. Stress-test before assuming the spread holds.
Location & tenants
- Location reads 83/100 on livability (#50 in FL, #911 nationally) — a professional / high-income tenant draw. Strengths: amenities A+, commute A+, housing A+.
- Duval (urban): math 46% / reading 45% proficiency, ranked #48 of 73 in FL (top 66%) — families likely to look elsewhere, expect single-tenant / working-renter base with shorter leases.
- Zoned schools: Mamie Agnes Jones Elementary School (math 57% / reading 47%, grade C-, #990 of 2,144 statewide, top 48%, 430 students, 61% FRL); Joseph Stilwell Middle School (math 31% / reading 33%, grade F, #448 of 571 statewide, top 79%, 612 students, 68% FRL); Marine Science Education Center (31 students, 16% FRL) — zoned schools at 49% FRL track the district average.
- Market conditions: 233 active listings in the ZIP; 6 comparable units currently listed for rent nearby; rentals leasing fast (median 6d on market — plan ~1-2 weeks tenant-placement turnaround); solid renter incomes; 6,503 units permitted in Duval County in 2024 (1,131 in 5+ unit buildings).
- This rent runs 33% of the median local income ($87k/yr) — at the standard rent-burdened threshold; future hikes will face affordability resistance.
Forward outlook
- In year one you build about $3k of equity ($2k loan paydown + $1k appreciation (0.5% local appreciation)).
- Duval County population projected at +19% by 2050 — long-run rental-demand tailwind backs the buy-and-hold thesis.
- By year 9, paydown + projected appreciation supports a ~$31k cash-out refi (75% LTV) — recoverable capital for the next deal without selling this one.
Negotiation context
- It's been on market 16 days — a 2% lower offer ($266k) is reasonable based on typical stale-listing flexibility.
- 3 sale attempts since 11y ago with the ask held roughly flat each time — persistent listings suggest the price (not the market) is what's stuck; bring a comps-based counter.
- Current owner paid $147k; list at $270k implies a 84% gain — meaningful room to come down on a strong offer.
Risks & watch-outs
- Climate carrying-cost: severe wind risk, 99% chance of damaging wind over 30y; severe wildfire risk; extreme-heat days projected 7→20/yr by 2055 (HVAC capex compounding) — expect insurance premiums to compound above CPI over the hold.
Questions for the listing agent
- What do current leases actually rent for vs. the listed asking? Can we see a recent rent roll and the last 12 months of T-12 income?
- What does the HOA fee cover, when was the last increase, and are there any pending special assessments or reserve-fund shortfalls?
- Is there a deadline driving the sale (1031 exchange, divorce, estate, relocation)? That informs how much negotiation room exists.
- Schools are B-rated — typically a magnet for longer-tenancy family renters. What's the average tenant stay here, and is there a school-zone premium baked into asking?
- The area grade is low — what's the realistic commute time and amenity access for the typical tenant pool here? Any planned neighborhood developments (good or bad) we should know about?
- What's the average days-on-market for RENTAL listings here right now (not sales)? A rising rental-DOM trend means longer vacancies and softer asking-rent achievability than the comps imply.
- What's the recent tenant-quality profile in this submarket — average credit score on applications, eviction rate, late-payment / NSF rate, and stable-employment percentage? A property-management company in the area should have these aggregated.
- How much new for-sale + rental construction is in the pipeline within 1–3 miles? Heavy new supply typically softens prices + rents 12–24 months out; constrained supply supports both.
Investment metrics
- 1% rule
- 0.88% ✗
- Cap rate
- 5.33%
- Cash-on-cash
- -3.42%
- DSCR
- 0.85
- GRM
- 9.4
CMA / ARV
- ARV (on-the-fly)
- $309,952
- Comps found
- 12
Show comp detail 12 sales within ~0.75 mi
| Address | Dist | Beds/Ba | Sqft | Sold | Price | $/sf | Match |
|---|---|---|---|---|---|---|---|
| 15361 Bareback Dr | 0.13mi | 4/2.0 | 1,796 (-3%) | 1mo | $295,000 | $164 | 88 |
| 15620 Saddled Charger Dr | 0.39mi | 4/2.0 | 1,856 (0%) | 2mo | $264,900 | $143 | 80 |
| 15306 Hidden Foal Dr | 0.18mi | 4/2.0 | 1,740 (-6%) | 1mo | $240,000 | $138 | 80 |
| 6119 Black Filly Ln | 0.03mi | 3/2.0 (-1) | 1,711 (-8%) | 1mo | $290,000 | $169 | 80 |
| 15373 Hidden Foal Dr | 0.06mi | 3/2.0 (-1) | 1,711 (-8%) | 1mo | $287,147 | $168 | 78 |
| 15543 Bareback Dr | 0.05mi | 3/2.0 (-1) | 1,709 (-8%) | 5mo | $285,000 | $167 | 76 |
| 5752 Lagoon Cruise Way | 0.41mi | 4/2.0 | 1,797 (-3%) | 5mo | $383,000 | $213 | 72 |
| 5717 Lagoon Cruise Way | 0.37mi | 3/2.0 (-1) | 1,622 (-13%) | 2mo | $309,990 | $191 | 55 |
| 15679 Saddled Charger Dr | 0.48mi | 3/2.0 (-1) | 1,711 (-8%) | 8mo | $265,000 | $155 | 53 |
| 5728 Lagoon Cruise Way | 0.43mi | 3/2.0 (-1) | 1,622 (-13%) | 4mo | $309,990 | $191 | 50 |
| 15771 Palfrey Chase Dr | 0.67mi | 3/2.0 (-1) | 1,714 (-8%) | 4mo | $274,000 | $160 | 47 |
| 15712 Equine Gait Dr | 0.59mi | 3/2.0 (-1) | 1,618 (-13%) | 9mo | $269,000 | $166 | 38 |
Match score weights: distance 35% · size 25% · config 20% · recency 20%. Top-matched comps best support the ARV.
Projected returns pro-forma
0.45% appreciation · 3.0% rent growth · sell at horizon
- IRR
- -4.3%
- Equity multiple
- 0.79×
- Total profit
- $-15,682
- Equity at exit
- $84,532
- IRR
- 1.3%
- Equity multiple
- 1.15×
- Total profit
- $11,462
- Equity at exit
- $106,645
Cash invested: $75,600 (down + closing). Projections, not guarantees.
Landlord ↔ Tenant lean methodology
- Overall (STATE)
- 87 Strongly Landlord-Friendly
- State Florida
- 87 Strongly Landlord-Friendly · R+3
- County
- — inherits STATE
- City
- — inherits STATE
ZIP-level market 32234
- Home prices YoY
- 0.2%
- Active inventory
- 233
- Price-to-rent
- 9.4×
Monthly cashflow live
- Estimated rent
- $2,387 high interval (Pro) →
- Mortgage (P&I)
- −$1,416
- Tax from tax record
- −$560 /mo · $6,723/yr
- Insurance
- −$112
- HOA
- −$13
- Vacancy / Maint / Mgmt
- −$501
- Net cashflow
- $-216
Break-even live
Sensitivity live
| Price | -10% $-63 | -5% $-139 | +0% $-216 | +5% $-292 | +10% $-368 |
|---|---|---|---|---|---|
| Rent | -10% $-404 | -5% $-310 | +0% $-216 | +5% $-121 | +10% $-27 |
| Rate | -1.0pp $-80 | -0.5pp $-147 | base $-216 | +0.5pp $-286 | +1.0pp $-357 |
UW: 25.0% down · 7.5% · 30yr · 1.5% tax · 5.0% vac · 8.0% maint · 8.0% mgmt
Financing live
Cash to close
- Down payment
- $67,500
- Closing costs
- $8,100
- Reserves months
- —
- Total cash needed
- —
Loan-product check · same deal, 3 products live
Conventional
25% down · 7.5% · 30yr
- Down + closing
- —
- Monthly P&I
- —
- Monthly cashflow
- —
- DSCR
- —
- Eligible?
- —
Personal DTI + credit; lowest rate.
DSCR
20% down · 8.5% · 30yr
- Down + closing
- —
- Monthly P&I
- —
- Monthly cashflow
- —
- DSCR
- —
- Eligible?
- —
No personal income docs; deal must DSCR.
Hard money
10% down · 12.0% · 12mo
- Down + closing
- —
- Monthly P&I
- —
- Monthly cashflow
- —
- DSCR
- —
- Eligible?
- —
Short-term bridge; refi at stabilization.
Rent comps 6 comps
| Address | Beds | Baths | Sqft | Rent | $/sqft | DOM | Units | Dist |
|---|---|---|---|---|---|---|---|---|
| 15246 Hidden Foal Dr Jacksonville, FL | 3.0 | 2.0 | 1730 | $1,900 | $1.10 | 13d | 1 | 0.27mi |
| 15180 Bareback Dr Jacksonville, FL | 4.0 | 2.0 | 1840 | $1,999 | $1.09 | 4d | 1 | 0.32mi |
| 5724 Lagoon Cruise Way Jacksonville, FL | 4.0 | 3.0 | 2494 | $2,800 | $1.12 | 6d | 1 | 0.42mi |
| 15729 Equine Gait Dr Jacksonville, FL | 3.0 | 2.0 | 1650 | $1,950 | $1.18 | 3d | 1 | 0.61mi |
| 6092 Bucking Bronco Dr Jacksonville, FL | 4.0 | 2.0 | 1778 | $1,995 | $1.12 | 9d | 1 | 0.62mi |
| 15647 Woodbury Dr Jacksonville, FL | 3.0–5.0 | 2.0–3.5 | 1863 | $2,222 | $1.19 | 3d | 27 | 0.81mi |
HOA detail
- Monthly dues
- $13 · $156/yr
- Likely covers
- waterpool
Listing history 11 events
-
2026-06-21days on market $270,000 Active 16 DOM
-
2026-06-18days on market $270,000 Active 13 DOM
-
2026-06-17days on market $270,000 Active 12 DOM
-
2026-06-16days on market $270,000 Active 11 DOM
-
2026-06-15days on market $270,000 Active 10 DOM
-
2026-06-13days on market $270,000 Active 8 DOM
-
2026-06-13days on market $270,000 Active 7 DOM
-
2026-06-09days on market $270,000 Active 4 DOM
-
2026-06-08days on market $270,000 Active 3 DOM
-
2026-06-07remarks 699-char remark
-
2026-06-07$270,000 Active 2 DOM
ⓘ Source: listings_history table (triggers on properties + properties_extension) + one-shot
backfill from property_details.listing_events for pre-trigger history.
Tax reassessment forecast FL · Resets to sale price
- Current annual tax
- $6,723 · $560/mo
- Projected year-2 tax
- $6,723 · $560/mo
- Expected delta
- $0/yr ($0/mo · 0.0%)
ⓘ Screening estimate from a state-policy table — verify with the county assessor before closing.
Climate risk First Street
- Flood 1/10 Low FEMA zone X (unshaded) · 0% chance over 30 yrs
- Wildfire 8/10 Severe
- Heat 8/10 Severe 7 d/yr ≥108°F today · 20 d/yr by 30 yrs out
- Wind 9/10 Extreme 99% chance of damaging wind over 30 yrs
- Air quality 3/10 Moderate 2 unhealthy d/yr today · 3 by 30 yrs out
Nearby sold comps map
Loading sold comps map…
Walkable amenities ~0.75 mi
Loading nearby amenities…
Taxation est. · year 1
- Rental income
- $28,649
- − Mortgage interest
- −$15,124
- − Property taxes
- −$6,723
- − Insurance
- −$1,350
- − Repairs & maintenance
- −$2,292
- − Management
- −$2,292
- − HOA
- −$156
- − Depreciation
- −$7,855
- Taxable loss
- −$7,142
- Est. tax savings @ 24.0%
- +$1,714
- After-tax cash flow
- $-873/yr
For passive investors: Depreciation is non-cash, so a rental often shows a tax loss while cash-flowing — sheltering income. Rental losses are passive: they offset passive income freely, and up to $25,000/yr can offset ordinary (W-2) income if you actively participate and your MAGI is under $100k (phasing out to $0 by $150k); unused losses carry forward. On sale, claimed depreciation is recaptured at up to 25%, and gains may owe capital-gains tax (a 1031 exchange can defer both). Figures are a year-1 estimate at your 24.0% rate — not tax advice; consult a CPA.
Schools (NCES district)
- District
- Duval
- NCES district ID
- 1200480
- Math proficiency
- 46% ▼ -11.00%
- Reading proficiency
- 45% ▼ -4.00%
- Median HH income
- $48,987
- Composite
- 38.97/100
- National rank
- #4076
- State rank
- #48 of 73 in FL
Livability — Jacksonville
- Score
- 83/100
- State rank
- #50
- US rank
- #911
Category grades
Schools grade is shown separately in the Schools card above.
Census & demographics
- Census place
- Jacksonville, FL
- County
- Duval County · 1,015,274 people
- City population
- 979,034
- Metro
- Jacksonville, FL
- Population (ZIP)
- 9,678
- Household income
- $87,331
- Rent vs Own
- Severe rent burden
- 62.0
Population outlook (Duval County) Hauer SSP2
- Today (2025)
- 1,013,010 people
- By 2030
- 1,059,228 · +4.6%
- By 2040
- 1,141,439 · +12.7%
- By 2050
- 1,205,258 · +19.0%
- By 2075
- 1,324,282 · +30.7%
- By 2100
- 1,319,620 · +30.3%
Race, ethnicity, and origin ACS 2023
- Neighborhood character
- Predominantly White (76%)
- Race & ethnicity
- White 76% Black 16% Hispanic / Latino 6% Two or more races 4%
- Hispanic origin (detail)
- Mexican 1% Puerto Rican 2% Salvadoran 1%
- Common ancestry
- Serbian 2% Lithuanian 1% Slovak 1%
- Foreign-born
- 4% · Canada, Dominican Republic
- Languages at home
- 95% English-only · Spanish 4%
Political lean MEDSL · Duval
- 2024 margin
- Toss-up / Even · D 48.7% · R 50.1% · Other 1.2%
- 2008→2024 swing
- +0.4pp no change · 2008: -1.9pp · 2024: -1.5pp
- All cycles
- 2024: R+1.5 2020: D+3.8 2016: R+1.5 2012: R+3.6 2008: R+1.9
Not yet ingested
- Civics
- —
Market trends
- HPI YoY
- ▲ 0.45%
- Current HPI
- 288.4613
- Rent YoY
- —
- Metro
- Jacksonville, FL
- State GDP YoY
- ▲ 3.28%
- F500 in state
- 36
Industry mix (Fortune 500 HQ in FL)
| Industry | F500 HQs | Revenue |
|---|---|---|
| Industrial Technology | 2 | $29B |
|
||
| Insurance | 2 | $17B |
|
||
| Retail | 1 | $60B |
|
||
| Technology Distribution | 1 | $58B |
|
||
| Homebuilding | 1 | $35B |
|
||
| Technology Manufacturing | 1 | $35B |
|
||
Price history
-91.5% since first listed7 events — show timeline
- 2026-06-05 Listed $270,000 realMLS
- 2025-09-19 Listing Removed — realMLS
- 2025-03-19 Listed $310,000 realMLS
- 2015-09-24 Sold (MLS) $146,675 realMLS
- 2015-09-09 Pending — realMLS
- 2015-09-04 Listed $151,375 realMLS
- 2010-01-20 Sold (Public Records) $3,187,700 Public Records
Property tax history
+33.2%/yrLatest (2025): $6,723 · +11.1% YoY. Source: county tax records.
Cash-flow waterfall
monthlySold comps — $/sqft
last 12 mo · ≤1 miLoading sold comps…