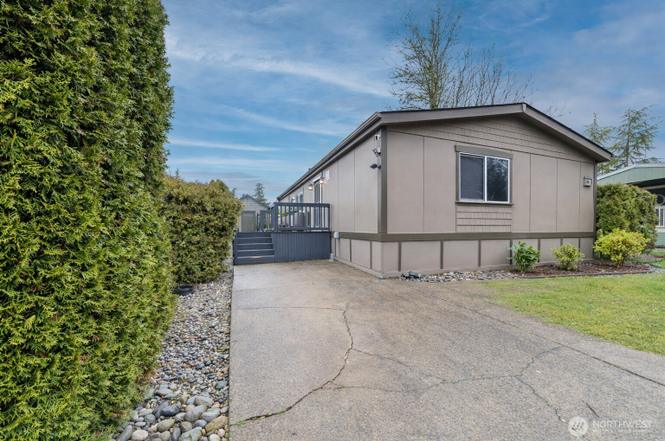
31600 126th Ave SE #86 · Auburn, WA
Flood risk 1/10 · Minimal
- FEMA flood zone
- X (unshaded)
- Chance of flooding over 30 yrs
- 0.0%
- Est. flood insurance / yr
- $507 – $1,088
Fire risk 1/10 · Minimal
- Est. fire insurance / yr
- $604 – $1,122
Heat risk 3/10 · Minor
- Hot days now (above 87°F)
- 7 days/yr
- Hot days in 30 yrs
- 15 days/yr
Wind risk 1/10 · Minimal
- Chance of severe wind over 30 yrs
- —
Air-quality risk 7/10 · Major
- Unhealthy air days now
- 10 days/yr
- Unhealthy air days in 30 yrs
- 11 days/yr
Risk factors via First Street. Map © Google.
Why this score? — see what drove the B- grade
The composite is a weighted blend of 9 inputs, each scored 0–100. Each bar is that input's sub-score; the figure is the points it added to the 100-point composite (weight × sub-score).
- Cash flow +26.5/30.0
- Appreciation +10.0/10.0
- DSCR +9.0/10.0
- 1% rule +7.1/10.0
- Schools +4.7/10.0
- Livability +4.0/5.0
- Condition / age +2.5/5.0
- Rent growth +2.4/5.0
- ARV discount +0.0/15.0
$185,000
🖨 Deal sheet 📄 Offer letter ✓ Due diligence
Listing remarks
This beautifully maintained 3-bed, 2-bath manufactured home is located in the desirable College Park community of Lea Hill and offers 1,244 sq ft of comfortable, well-designed living space. Highlights include vaulted ceilings, great natural light, a cozy wood stove, and beautiful flooring throughout. The spacious kitchen provides plenty of room to cook and gather, while the private patio/deck is perfect for relaxing or entertaining. Two assigned parking spaces and a Community Recreational Area to add to the appeal. Conveniently located near shopping, schools, and major routes—an excellent opportunity to own a beautiful home in a well-run park. Some photos of home are virtually staged.
Key facts
- Manufactured home
- Spacious kitchen
- Private patio
Tags
Property features AI
Finance
- Other: Mobile home remains
- Financial info: Accepts Cash and Conventional financing
- HOA & community: Located in College Park community; Park includes recreational area; 227 homes in the park; Park approved for sale; Land lease billed at $1,087
Exterior
- Parking: Uncovered parking; 2 open parking spaces
- Utilities: Electric and natural gas; Public water (billed by park and paid with space rent); Sewer billed by park and paid with space rent; Power service by PSE; Cable: Xfinity; Internet: Xfinity
- Home design: Manufactured home (double wide); One story; Manufactured by Fleetwood; Very good condition; Tie-down foundation; Faces west
- Construction: Wood construction; Composition roof
- Exterior features: Wood exterior; Wood products; Paved lot; Patio/porch/deck; Awnings; Skylights; Vaulted ceilings; Has view
Interior
- Kitchen: Disposal; Microwave; Refrigerator; Stove/Range
- Bedrooms: 3 bedrooms
- Flooring: Laminate; Vinyl plank
- Bathrooms: 2 full bathrooms; 2 bathtubs; 2 showers
- Heating & cooling: Forced air heating; Stove / free-standing heating; No central cooling
- Interior features: Fireplace (wood burning); Water heater
- Laundry & utility: Washer; Dryer; Utility room with electric water heater
Neighborhood map
What this means for you Summary
Snapshot
- This is a 3-bed/2.0-bath manufactured listed at $185k.
Deal economics
- At list price, monthly cash flow is $490 ($6k/yr) — positive.
- The deal already cash-flows at list — no discount required.
- Meets the 1% rule at list price ($2k rent vs $185k).
- Recommended offer: $163k (12.0% below list) — sets the bar for market timing.
- Cap rate 9.5% vs local median 2.7% in Auburn — top-decile yield for the area; either an underpriced asset or a hidden risk that comps aren't pricing in. Stress-test before assuming the spread holds.
Location & tenants
- Location reads 81/100 on livability (#75 in WA, #1,371 nationally) — a professional / high-income tenant draw. Strengths: amenities A+, commute A+, employment A+; Watch: crime F, cost of living F.
- Auburn School District (urban): math 47% / reading 56% proficiency, ranked #125 of 291 in WA (top 43%) — acceptable for families but not a draw, mixed tenant base, ~2y average lease.
- Market conditions: Rents soft (-0.5%/yr); 291 active listings in the ZIP; 5 comparable units currently listed for rent nearby; rentals leasing fast (median 2d on market — plan ~1-2 weeks tenant-placement turnaround); high-income renter base; 10,555 units permitted in King County in 2024 (7,119 in 5+ unit buildings).
Forward outlook
- In year one you build about $20k of equity ($1k loan paydown + $18k appreciation (10.0% local appreciation)).
- King County population projected at +44% by 2050 — long-run rental-demand tailwind backs the buy-and-hold thesis.
- At projected returns (10.0% appreciation + 0.0% rent growth), your $52k cash investment doubles in ~2 years — after that, you're playing with house money.
- By year 2, paydown + projected appreciation supports a ~$32k cash-out refi (75% LTV) — recoverable capital for the next deal without selling this one.
Negotiation context
- It's been on market 131 days — a 12% lower offer ($163k) is reasonable based on typical stale-listing flexibility.
- 6 sale attempts since 5y ago; this cycle's ask has dropped $15k (8%) from the opening price — seller is motivated, your offer sets the floor, not the list.
- Current owner paid $150k; 23% above their basis — modest negotiation headroom, anchor on the comps not their cost.
Questions for the listing agent
- It's been on market 131 days. Have you received any prior offers? Is the seller open to a 12% concession, seller financing, or rate buy-down credit?
- Why hasn't it sold? Are there any deal-killer items the seller is aware of (foundation, flood, title, zoning, code violations)?
- Is there a deadline driving the sale (1031 exchange, divorce, estate, relocation)? That informs how much negotiation room exists.
- Crime grade is F in this area — have there been break-ins, vandalism, or insurance claims at this property in the last 3 years? What carrier currently insures it and at what premium?
- What's the average days-on-market for RENTAL listings here right now (not sales)? A rising rental-DOM trend means longer vacancies and softer asking-rent achievability than the comps imply.
- What's the recent tenant-quality profile in this submarket — average credit score on applications, eviction rate, late-payment / NSF rate, and stable-employment percentage? A property-management company in the area should have these aggregated.
- How much new for-sale + rental construction is in the pipeline within 1–3 miles? Heavy new supply typically softens prices + rents 12–24 months out; constrained supply supports both.
Investment metrics
- 1% rule
- 1.21% ✓
- Cap rate
- 9.47%
- Cash-on-cash
- 11.35%
- DSCR
- 1.50
- GRM
- 6.9
CMA / ARV
- ARV (on-the-fly)
- $145,548
- Comps found
- 3
Show comp detail 3 sales within ~0.75 mi
| Address | Dist | Beds/Ba | Sqft | Sold | Price | $/sf | Match |
|---|---|---|---|---|---|---|---|
| 31600 126th Ave SE #42 | 0.00mi | 3/2.0 | 1,188 (-4%) | 8mo | $180,000 | $152 | 86 |
| 31600 126th Ave SE #156 | 0.00mi | 3/2.0 | 1,150 (-8%) | 13mo | $135,000 | $117 | 77 |
| 31600 126 Ave SE Unit E1 | 0.22mi | 3/2.0 | 1,400 (+12%) | 9mo | $145,000 | $104 | 61 |
Match score weights: distance 35% · size 25% · config 20% · recency 20%. Top-matched comps best support the ARV.
Projected returns pro-forma
10.0% appreciation · 0.0% rent growth · sell at horizon
- IRR
- 31.3%
- Equity multiple
- 3.42×
- Total profit
- $125,425
- Equity at exit
- $166,663
- IRR
- 26.1%
- Equity multiple
- 7.43×
- Total profit
- $333,147
- Equity at exit
- $359,414
Cash invested: $51,800 (down + closing). Projections, not guarantees.
Landlord ↔ Tenant lean methodology
- Overall (STATE)
- 28 Tenant-Leaning
- State Washington
- 28 Tenant-Leaning · D+8
- County
- — inherits STATE
- City
- — inherits STATE
ZIP-level market 98092
- Home prices YoY
- 3.3%
- Rents YoY
- -0.5%
- Active inventory
- 291
- Price-to-rent
- 6.9×
Monthly cashflow live
- Estimated rent
- $2,238 high interval (Pro) →
- Mortgage (P&I)
- −$970
- Tax est. 1.5%
- −$231 /mo · $2,775/yr
- Insurance
- −$77
- HOA
- −$0
- Vacancy / Maint / Mgmt
- −$470
- Net cashflow
- $490
Break-even live
UW: 25.0% down · 7.5% · 30yr · 1.5% tax · 5.0% vac · 8.0% maint · 8.0% mgmt
Financing live
Cash to close
- Down payment
- $46,250
- Closing costs
- $5,550
- Reserves months
- —
- Total cash needed
- —
Loan-product check · same deal, 3 products live
Conventional
25% down · 7.5% · 30yr
- Down + closing
- —
- Monthly P&I
- —
- Monthly cashflow
- —
- DSCR
- —
- Eligible?
- —
Personal DTI + credit; lowest rate.
DSCR
20% down · 8.5% · 30yr
- Down + closing
- —
- Monthly P&I
- —
- Monthly cashflow
- —
- DSCR
- —
- Eligible?
- —
No personal income docs; deal must DSCR.
Hard money
10% down · 12.0% · 12mo
- Down + closing
- —
- Monthly P&I
- —
- Monthly cashflow
- —
- DSCR
- —
- Eligible?
- —
Short-term bridge; refi at stabilization.
Rent comps 5 comps
| Address | Beds | Baths | Sqft | Rent | $/sqft | DOM | Units | Dist |
|---|---|---|---|---|---|---|---|---|
| 12722 SE 312th St Auburn, WA | 4.0 | 1.0–2.0 | 870 | $2,166 | $2.49 | 1d | 21 | 0.22mi |
| 12902 SE 312th St Auburn, WA | 1.0–4.0 | 1.0–2.0 | 1062 | $2,301 | $2.17 | 1d | 16 | 0.36mi |
| 12110 SE 312th St Auburn, WA | 2.0 | 2.0 | 1035 | $2,095 | $2.02 | 24d | 4 | 0.39mi |
| 30819 124th Ave SE Auburn, WA | 2.0–4.0 | 1.0–2.0 | 908 | $1,694 | $1.86 | 1d | 2 | 0.44mi |
| 31900 104th Ave SE Unit A206 Auburn, WA | 2.0 | 1.5 | 1250 | $2,000 | $1.60 | 24d | 1 | 1.45mi |
Listing history 26 events
-
2026-06-18days on market $185,000 Active 131 DOM
-
2026-06-17days on market $185,000 Active 130 DOM
-
2026-06-16days on market $185,000 Active 129 DOM
-
2026-06-15days on market $185,000 Active 128 DOM
-
2026-06-13days on market $185,000 Active 126 DOM
-
2026-06-13days on market $185,000 Active 125 DOM
-
2026-06-09days on market $185,000 Active 122 DOM
-
2026-06-08days on market $185,000 Active 121 DOM
-
2026-06-07days on market $185,000 Active 120 DOM
-
2026-06-04days on market $185,000 Active 117 DOM
-
2026-06-03days on market $185,000 Active 116 DOM
-
2026-06-02days on market $185,000 Active 115 DOM
-
2026-06-01days on market $185,000 Active 114 DOM
-
2026-05-31days on market $185,000 Active 113 DOM
-
2026-04-09status Active
-
2026-03-31status Active
-
2026-03-20status Pending
-
2026-02-19price $190,000
-
2026-01-27status Active
-
2026-01-17status Pending
-
2026-01-08$200,000 Active
-
2022-02-17soldstatus $150,000 Closed
-
2022-01-25status Pending
-
2021-12-29status Active
-
2021-12-21status Pending
-
2021-12-17$149,950 Active
ⓘ Source: listings_history table (triggers on properties + properties_extension) + one-shot
backfill from property_details.listing_events for pre-trigger history.
Climate risk First Street
- Flood 1/10 Low FEMA zone X (unshaded) · 0% chance over 30 yrs
- Wildfire 1/10 Low
- Heat 3/10 Moderate 7 d/yr ≥87°F today · 15 d/yr by 30 yrs out
- Wind 1/10 Low
- Air quality 7/10 Severe 10 unhealthy d/yr today · 11 by 30 yrs out
Nearby sold comps map
Loading sold comps map…
Walkable amenities ~0.75 mi
Loading nearby amenities…
Taxation est. · year 1
- Rental income
- $26,860
- − Mortgage interest
- −$10,363
- − Property taxes
- −$2,775
- − Insurance
- −$925
- − Repairs & maintenance
- −$2,149
- − Management
- −$2,149
- − Depreciation
- −$5,382
- Taxable income
- $3,118
- Est. tax owed @ 24.0%
- −$748
- After-tax cash flow
- $5,129/yr
For passive investors: Depreciation is non-cash, so a rental often shows a tax loss while cash-flowing — sheltering income. Rental losses are passive: they offset passive income freely, and up to $25,000/yr can offset ordinary (W-2) income if you actively participate and your MAGI is under $100k (phasing out to $0 by $150k); unused losses carry forward. On sale, claimed depreciation is recaptured at up to 25%, and gains may owe capital-gains tax (a 1031 exchange can defer both). Figures are a year-1 estimate at your 24.0% rate — not tax advice; consult a CPA.
Schools (NCES district)
- District
- Auburn School District
- NCES district ID
- 5300300
- Math proficiency
- 47% ▼ -3.00%
- Reading proficiency
- 56% ▼ -1.00%
- Median HH income
- $58,048
- Composite
- 46.73/100
- National rank
- #5240
- State rank
- #125 of 291 in WA
Livability — Auburn
- Score
- 81/100
- State rank
- #75
- US rank
- #1371
Category grades
Schools grade is shown separately in the Schools card above.
Census & demographics
- Census place
- Auburn, WA
- County
- King County · 2,251,916 people
- City population
- 74,969
- Metro
- Seattle-Tacoma-Bellevue, WA
- Population (ZIP)
- 50,224
- Household income
- $122,300
- Rent vs Own
- Severe rent burden
- 1041.0
Population outlook (King County) Hauer SSP2
- Today (2025)
- 2,576,485 people
- By 2030
- 2,803,316 · +8.8%
- By 2040
- 3,255,921 · +26.4%
- By 2050
- 3,706,444 · +43.9%
- By 2075
- 4,746,063 · +84.2%
- By 2100
- 5,407,730 · +109.9%
Race, ethnicity, and origin ACS 2023
- Neighborhood character
- Diverse neighborhood (Simpson 0.66)
- Race & ethnicity
- White 54% Hispanic / Latino 15% Asian 14% Two or more races 13% Native American 4% Black 3% Pacific Islander 2%
- Hispanic origin (detail)
- Mexican 12%
- Common ancestry
- Portuguese 4% Italian 3% Subsaharan African 3%
- Foreign-born
- 20% · Canada, South Korea, Vietnam
- Languages at home
- 73% English-only · Spanish 9% Russian/Polish/Slavic 4% Other Indo-European 3%
Political lean MEDSL · King
- 2024 margin
- Solid D (+51.7) · D 74.2% · R 22.5% · Other 3.4%
- 2008→2024 swing
- +9.6pp toward D · 2008: 42.1pp · 2024: 51.7pp
- All cycles
- 2024: D+51.7 2020: D+52.7 2016: D+50.4 2012: D+39.9 2008: D+42.1
Not yet ingested
- Civics
- —
Market trends
- HPI YoY
- ▲ 49.75%
- Current HPI
- 1554.06
- Rent YoY
- ▼ -0.46%
- Metro
- Seattle-Tacoma-Bellevue, WA
- State GDP YoY
- ▲ 4.65%
- F500 in state
- 22
Industry mix (Fortune 500 HQ in WA)
| Industry | F500 HQs | Revenue |
|---|---|---|
| Retail | 2 | $269B |
|
||
| Technology / Retail | 1 | $638B |
|
||
| Technology | 1 | $245B |
|
||
| Telecommunications | 1 | $38B |
|
||
| Food / Beverage | 1 | $36B |
|
||
| Automotive / Trucks | 1 | $34B |
|
||
Price history
+26.7% since first listed12 events — show timeline
- 2026-04-09 Relisted — NWMLS as Distributed by MLS Grid
- 2026-03-31 Relisted — NWMLS as Distributed by MLS Grid
- 2026-03-20 Pending — NWMLS as Distributed by MLS Grid
- 2026-02-19 Price Changed $190,000 NWMLS as Distributed by MLS Grid
- 2026-01-27 Relisted — NWMLS as Distributed by MLS Grid
- 2026-01-17 Pending — NWMLS as Distributed by MLS Grid
- 2026-01-08 Listed $200,000 NWMLS as Distributed by MLS Grid
- 2022-02-17 Sold (MLS) $150,000 NWMLS as Distributed by MLS Grid
- 2022-01-25 Pending — NWMLS as Distributed by MLS Grid
- 2021-12-29 Relisted — NWMLS as Distributed by MLS Grid
- 2021-12-21 Pending — NWMLS as Distributed by MLS Grid
- 2021-12-17 Listed $149,950 NWMLS as Distributed by MLS Grid
Cash-flow waterfall
monthlySold comps — $/sqft
last 12 mo · ≤1 miLoading sold comps…