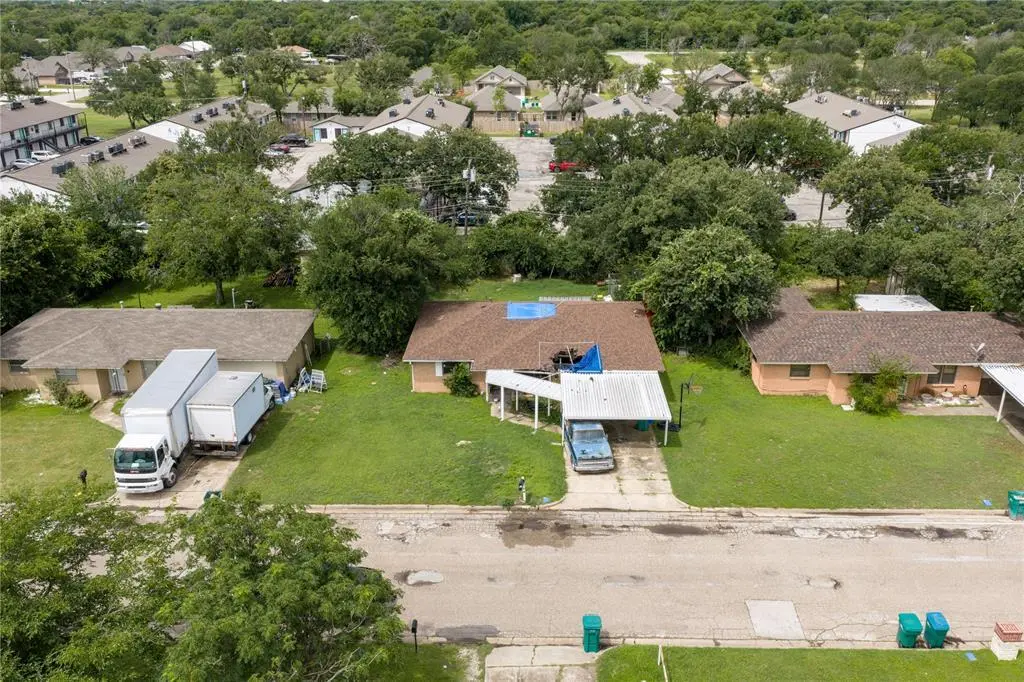
336 S Barbara St · Lacy-Lakeview, TX
Flood risk 1/10 · Minimal
- FEMA flood zone
- X (unshaded)
- Chance of flooding over 30 yrs
- 0.0%
- Est. flood insurance / yr
- $507 – $1,088
Fire risk 4/10 · Minor
- Est. fire insurance / yr
- $1,222 – $2,270
Heat risk 7/10 · Major
- Hot days now (above 110°F)
- 7 days/yr
- Hot days in 30 yrs
- 24 days/yr
Wind risk 6/10 · Moderate
- Chance of severe wind over 30 yrs
- 56.0%
Air-quality risk 2/10 · Minimal
- Unhealthy air days now
- 0 days/yr
- Unhealthy air days in 30 yrs
- 1 days/yr
Risk factors via First Street. Map © Google.
Why this score? — see what drove the B- grade
The composite is a weighted blend of 9 inputs, each scored 0–100. Each bar is that input's sub-score; the figure is the points it added to the 100-point composite (weight × sub-score).
- Cash flow +30.0/30.0
- 1% rule +10.0/10.0
- DSCR +10.0/10.0
- ARV discount +7.5/15.0
- Rent growth +3.1/5.0
- Livability +2.5/5.0
- Condition / age +2.5/5.0
- Schools +1.7/10.0
- Appreciation +0.0/10.0
$79,900
🖨 Deal sheet 📄 Offer letter ✓ Due diligence
Listing remarks
Attention investors and developers! Opportunity to renovate this home and make it your own! This is a 3 bed, 1 bath, 1,112 sq ft home. Property has fire damage and will need a full rehab. Great equity play once you bring this property back to life. Please contact as soon as possible as this will sell fast. Buyer responsible to do your own due diligence. Seller assumes no responsibility or risk for accidents or injuries that occur at the property or while inspecting the property
Key facts
- 8,973 sq ft lot
- 2 garage spots
- Built 1961
Property features AI
Finance
- Other: Property listed as residential single family; Listing status: Active; Possession at closing/funding
- HOA & community: No association
Exterior
- Parking: 2-car garage; 2 covered/carport spaces; Common covered parking
- Utilities: City water; City sewer; No municipal utility district
- Home design: Single-family residence; Residential property; One story
- Construction: Built in 1961; Composition roof
- Exterior features: Less than 0.5-acre lot; Directions: Turn left off of E Crest Dr onto S Barbara St; property will be on the left; Subdivision: Idlewood; County: McLennan
Interior
- Kitchen: Dishwasher; Kitchen on level 1 (approx. 14 x 15)
- Bedrooms: Primary bedroom on level 1 (approx. 12 x 12); Bedroom on level 1 (approx. 10 x 10); Bedroom on level 1 (approx. 10 x 10)
- Flooring: Carpet; Ceramic tile
- Bathrooms: 1 full bathroom
- Heating & cooling: Central air; Electric cooling
- Interior features: 7 total rooms; One-level layout; Other interior features
Neighborhood map
What this means for you Summary
Snapshot
- This is a 3-bed/1.5-bath single-family listed at $80k.
Deal economics
- At list price, monthly cash flow is $549 ($7k/yr) — positive.
- The deal already cash-flows at list — no discount required.
- Meets the 1% rule at list price ($2k rent vs $80k).
- Cap rate 14.5% vs local median 5.1% in Lacy-Lakeview — top-decile yield for the area; either an underpriced asset or a hidden risk that comps aren't pricing in. Stress-test before assuming the spread holds.
Location & tenants
- Location reads: area grade B — affects rentability + tenant quality, not the cash-flow math above.
- Connally ISD (suburban): math 16% / reading 25% proficiency, ranked #781 of 826 in TX (top 95%) — low school quality limits family demand, transient renter base, plan for 1-2y turnover; 68% free/reduced lunch — lower-income household profile, screen leases tightly.
- Zoned schools: Connally El (math 13% / reading 22%, grade F, #3,805 of 4,322 statewide, top 89%, 374 students, 87% FRL) — zoned schools average 87% FRL vs 68% district-wide (19 pts higher); higher-poverty schools than district average — tighter screening recommended.
- Market conditions: Rents rising (+2.2%/yr); 297 active listings in the ZIP; 13 comparable units currently listed for rent nearby; rentals leasing fast (median 13d on market — plan ~1-2 weeks tenant-placement turnaround); 1,014 units permitted in McLennan County in 2024 (200 in 5+ unit buildings).
- This rent runs 32% of the median local income ($58k/yr) — at the standard rent-burdened threshold; future hikes will face affordability resistance.
Forward outlook
- Local home prices are declining (-3.0%/yr); year-one equity from $552 of loan paydown is wiped out by about $2k of value loss. Plan a longer hold.
- McLennan County population projected at +17% by 2050 — long-run rental-demand tailwind backs the buy-and-hold thesis.
- At projected returns (-3.0% appreciation + 2.2% rent growth), your $22k cash investment doubles in ~5 years — after that, you're playing with house money.
Negotiation context
- Only 12 days on market — expect competitive offers; lowballing is unlikely to land.
Risks & watch-outs
- Watch-outs: property tax is 3.4% of price.
- Climate carrying-cost: major wind risk, 56% chance of damaging wind over 30y; extreme-heat days projected 7→24/yr by 2055 (HVAC capex compounding) — expect insurance premiums to compound above CPI over the hold.
Questions for the listing agent
- Built in 1961 — when were the roof, HVAC, electrical panel, plumbing, and water heater last replaced?
- Property tax is high relative to price — has the assessment been appealed recently, and will the sale trigger a re-assessment?
- Is there a deadline driving the sale (1031 exchange, divorce, estate, relocation)? That informs how much negotiation room exists.
- What's the average days-on-market for RENTAL listings here right now (not sales)? A rising rental-DOM trend means longer vacancies and softer asking-rent achievability than the comps imply.
- What's the recent tenant-quality profile in this submarket — average credit score on applications, eviction rate, late-payment / NSF rate, and stable-employment percentage? A property-management company in the area should have these aggregated.
- How much new for-sale + rental construction is in the pipeline within 1–3 miles? Heavy new supply typically softens prices + rents 12–24 months out; constrained supply supports both.
Investment metrics
- 1% rule
- 1.94% ✓
- Cap rate
- 14.54%
- Cash-on-cash
- 29.46%
- DSCR
- 2.31
- GRM
- 4.3
CMA / ARV
- ARV (on-the-fly)
- $194,600
- Comps found
- 12
Show comp detail 12 sales within ~0.75 mi
| Address | Dist | Beds/Ba | Sqft | Sold | Price | $/sf | Match |
|---|---|---|---|---|---|---|---|
| 310 S Rita | 0.19mi | 3/1.5 | 1,026 (-8%) | 15mo | $135,000 | $132 | 66 |
| 301 S Rita St | 0.25mi | 3/1.5 | 1,026 (-8%) | 12mo | $220,000 | $214 | 65 |
| 107 S Lakeview Dr | 0.53mi | 3/1.0 | 1,120 (+1%) | 11mo | $205,000 | $183 | 63 |
| 102 Susanna St | 0.47mi | 3/1.0 | 1,052 (-5%) | 8mo | $149,900 | $142 | 60 |
| 705 N Joyce St | 0.66mi | 3/1.0 | 1,092 (-2%) | 7mo | $165,000 | $151 | 58 |
| 209 N Lakeview Dr | 0.43mi | 3/1.0 | 1,024 (-8%) | 9mo | $195,000 | $190 | 57 |
| 201 N Oak Dr | 0.30mi | 3/2.0 | 988 (-11%) | 15mo | $172,500 | $175 | 53 |
| 127 S Oak St | 0.48mi | 3/2.0 | 1,219 (+10%) | 14mo | $199,975 | $164 | 48 |
| 705 N Scarlett Ln | 0.67mi | 3/1.0 | 1,238 (+11%) | 2mo | $184,900 | $149 | 47 |
| 613 N Rita St | 0.58mi | 3/1.0 | 952 (-14%) | 3mo | $187,000 | $196 | 44 |
| 106 S Lakeview Dr | 0.51mi | 3/1.5 | 1,244 (+12%) | 15mo | $154,900 | $125 | 44 |
| 112 S Lakeview Dr | 0.54mi | 3/2.0 | 1,268 (+14%) | 9mo | $229,900 | $181 | 42 |
Match score weights: distance 35% · size 25% · config 20% · recency 20%. Top-matched comps best support the ARV.
Projected returns pro-forma
-3.0% appreciation · 2.2% rent growth · sell at horizon
- IRR
- 23.0%
- Equity multiple
- 1.93×
- Total profit
- $20,900
- Equity at exit
- $11,913
- IRR
- 30.4%
- Equity multiple
- 3.62×
- Total profit
- $58,652
- Equity at exit
- $6,908
Cash invested: $22,372 (down + closing). Projections, not guarantees.
Landlord ↔ Tenant lean methodology
- Overall (STATE)
- 87 Strongly Landlord-Friendly
- State Texas
- 87 Strongly Landlord-Friendly · R+5
- County
- — inherits STATE
- City
- — inherits STATE
ZIP-level market 76705
- Home prices YoY
- -29.6%
- Rents YoY
- 2.2%
- Active inventory
- 297
- Price-to-rent
- 4.3×
Monthly cashflow live
- Estimated rent
- $1,550 high interval (Pro) →
- Mortgage (P&I)
- −$419
- Tax from tax record
- −$223 /mo · $2,679/yr
- Insurance
- −$33
- HOA
- −$0
- Vacancy / Maint / Mgmt
- −$326
- Net cashflow
- $549
Break-even live
UW: 25.0% down · 7.5% · 30yr · 1.5% tax · 5.0% vac · 8.0% maint · 8.0% mgmt
Financing live
Cash to close
- Down payment
- $19,975
- Closing costs
- $2,397
- Reserves months
- —
- Total cash needed
- —
Loan-product check · same deal, 3 products live
Conventional
25% down · 7.5% · 30yr
- Down + closing
- —
- Monthly P&I
- —
- Monthly cashflow
- —
- DSCR
- —
- Eligible?
- —
Personal DTI + credit; lowest rate.
DSCR
20% down · 8.5% · 30yr
- Down + closing
- —
- Monthly P&I
- —
- Monthly cashflow
- —
- DSCR
- —
- Eligible?
- —
No personal income docs; deal must DSCR.
Hard money
10% down · 12.0% · 12mo
- Down + closing
- —
- Monthly P&I
- —
- Monthly cashflow
- —
- DSCR
- —
- Eligible?
- —
Short-term bridge; refi at stabilization.
Rent comps 13 comps
| Address | Beds | Baths | Sqft | Rent | $/sqft | DOM | Units | Dist |
|---|---|---|---|---|---|---|---|---|
| 320 S Rita St Waco, TX | 3.0 | 1.0 | 1040 | $1,600 | $1.54 | 13d | 1 | 0.10mi |
| 129 N Lakeview Dr Waco, TX | 3.0 | 2.0 | 1207 | $3,750 | $3.11 | 43d | 1 | 0.43mi |
| 500 E Craven Ave Waco, TX | 2.0 | 1.0 | 750 | $1,075 | $1.43 | 13d | 1 | 0.58mi |
| 229 E Craven Ave Waco, TX | 3.0 | 2.0 | 1052 | $1,325 | $1.26 | 43d | 1 | 0.78mi |
| 225 E Craven Ave Waco, TX | 3.0 | 2.0 | 1052 | $1,400 | $1.33 | 43d | 1 | 0.79mi |
| 4509 Rocking K Dr Waco, TX | 3.0 | 2.0 | 1298 | $1,699 | $1.31 | 13d | 1 | 0.80mi |
| 218 Avenue F Waco, TX | 3.0 | 2.0 | 1332 | $1,600 | $1.20 | 43d | 1 | 0.84mi |
| 105 N Lacy Dr Waco, TX | 3.0 | 1.0–2.0 | 700 | $1,632 | $2.33 | 13d | 11 | 0.96mi |
| 4245 Meyers Ln Waco, TX | 2.0 | 2.0 | 772 | $1,745 | $2.26 | 13d | 1 | 1.02mi |
| 4245 Meyers Ln Waco, TX | 2.0 | 1.0 | 772 | $1,175 | $1.52 | 20d | 1 | 1.02mi |
| 109 E Frost St Waco, TX | 3.0 | 2.0 | 1338 | $2,200 | $1.64 | 13d | 1 | 1.03mi |
| 305 Shirley Dr Lacy Lakeview, TX | 3.0 | 2.0 | 1100 | $1,525 | $1.39 | 13d | 1 | 1.08mi |
| 3500 Meyers Ln Waco, TX | 1.0–2.0 | 1.0–2.0 | 684 | $1,125 | $1.64 | 13d | 1 | 1.24mi |
Listing history 10 events
-
2026-06-10days on market $79,900 Active 12 DOM
-
2026-06-09days on market $79,900 Active 11 DOM
-
2026-06-08days on market $79,900 Active 10 DOM
-
2026-06-07days on market $79,900 Active 9 DOM
-
2026-06-05days on market $79,900 Active 6 DOM
-
2026-06-02days on market $79,900 Active 4 DOM
-
2026-06-01days on market $79,900 Active 3 DOM
-
2026-05-31days on market $79,900 Active 2 DOM
-
2026-05-30remarks 482-char remark
-
2026-05-30$79,900 Active 1 DOM
ⓘ Source: listings_history table (triggers on properties + properties_extension) + one-shot
backfill from property_details.listing_events for pre-trigger history.
Tax reassessment forecast TX · Resets to sale price
- Current annual tax
- $2,679 · $223/mo
- Projected year-2 tax
- $2,679 · $223/mo
- Expected delta
- $0/yr ($0/mo · -0.0%)
ⓘ Screening estimate from a state-policy table — verify with the county assessor before closing.
Climate risk First Street
- Flood 1/10 Low FEMA zone X (unshaded) · 0% chance over 30 yrs
- Wildfire 4/10 Moderate
- Heat 7/10 Severe 7 d/yr ≥110°F today · 24 d/yr by 30 yrs out
- Wind 6/10 Major 56% chance of damaging wind over 30 yrs
- Air quality 2/10 Low 0 unhealthy d/yr today · 1 by 30 yrs out
Nearby sold comps map
Loading sold comps map…
Walkable amenities ~0.75 mi
Loading nearby amenities…
Taxation est. · year 1
- Rental income
- $18,605
- − Mortgage interest
- −$4,476
- − Property taxes
- −$2,679
- − Insurance
- −$400
- − Repairs & maintenance
- −$1,488
- − Management
- −$1,488
- − Depreciation
- −$2,324
- Taxable income
- $5,750
- Est. tax owed @ 24.0%
- −$1,380
- After-tax cash flow
- $5,212/yr
For passive investors: Depreciation is non-cash, so a rental often shows a tax loss while cash-flowing — sheltering income. Rental losses are passive: they offset passive income freely, and up to $25,000/yr can offset ordinary (W-2) income if you actively participate and your MAGI is under $100k (phasing out to $0 by $150k); unused losses carry forward. On sale, claimed depreciation is recaptured at up to 25%, and gains may owe capital-gains tax (a 1031 exchange can defer both). Figures are a year-1 estimate at your 24.0% rate — not tax advice; consult a CPA.
Schools (NCES district)
- District
- Connally ISD
- NCES district ID
- 4814970
- Math proficiency
- 16% ▼ -10.00%
- Reading proficiency
- 25% ▼ -5.00%
- Median HH income
- $35,388
- Composite
- 16.9/100
- National rank
- #9141
- State rank
- #781 of 826 in TX
Livability — Lacy-Lakeview
No livability data for this city. (Only ~50 U.S. cities are tracked.)
Census & demographics
- Census place
- Lacy-Lakeview, TX
- County
- McLennan County · 213,088 people
- City population
- 31,616
- Metro
- Waco, TX
- Population (ZIP)
- 31,616
- Household income
- $58,236
- Rent vs Own
- Severe rent burden
- 668.0
Population outlook (McLennan County) Hauer SSP2
- Today (2025)
- 264,191 people
- By 2030
- 273,578 · +3.6%
- By 2040
- 291,506 · +10.3%
- By 2050
- 308,044 · +16.6%
- By 2075
- 349,648 · +32.3%
- By 2100
- 364,779 · +38.1%
Race, ethnicity, and origin ACS 2023
- Neighborhood character
- Diverse neighborhood (Simpson 0.68)
- Race & ethnicity
- White 43% Hispanic / Latino 32% Two or more races 20% Black 18% Native American 1% Asian 1%
- Hispanic origin (detail)
- Mexican 31%
- Common ancestry
- Slovak 2% Lithuanian 1% Serbian 1%
- Foreign-born
- 13% · Canada, Vietnam
- Languages at home
- 73% English-only · Spanish 24% Other Indo-European 1% German/W. Germanic 1%
Political lean MEDSL · McLennan
- 2024 margin
- Solid R (+30.9) · D 34.0% · R 64.9% · Other 1.0%
- 2008→2024 swing
- -7.0pp toward R · 2008: -23.9pp · 2024: -30.9pp
- All cycles
- 2024: R+30.9 2020: R+23.4 2016: R+27.1 2012: R+29.8 2008: R+23.9
Not yet ingested
- Civics
- —
Market trends
- HPI YoY
- ▼ -91.45%
- Current HPI
- 217.9429
- Rent YoY
- ▲ 2.20%
- Metro
- Waco, TX
- State GDP YoY
- ▲ 3.95%
- F500 in state
- 110
Industry mix (Fortune 500 HQ in TX)
| Industry | F500 HQs | Revenue |
|---|---|---|
| Energy | 16 | $1,198B |
|
||
| Technology | 5 | $198B |
|
||
| Engineering / Construction | 4 | $72B |
|
||
| Energy Services | 3 | $60B |
|
||
| Utilities | 3 | $41B |
|
||
| Healthcare | 2 | $330B |
|
||
Price history
2 events — show timeline
- 2026-05-29 Listed $79,900 NTREIS
- 2002-10-24 Sold (Public Records) — Public Records
Property tax history
+3.9%/yrLatest (2025): $2,679 · +10.9% YoY. Source: county tax records.
Cash-flow waterfall
monthlySold comps — $/sqft
last 12 mo · ≤1 miLoading sold comps…