 Duplex
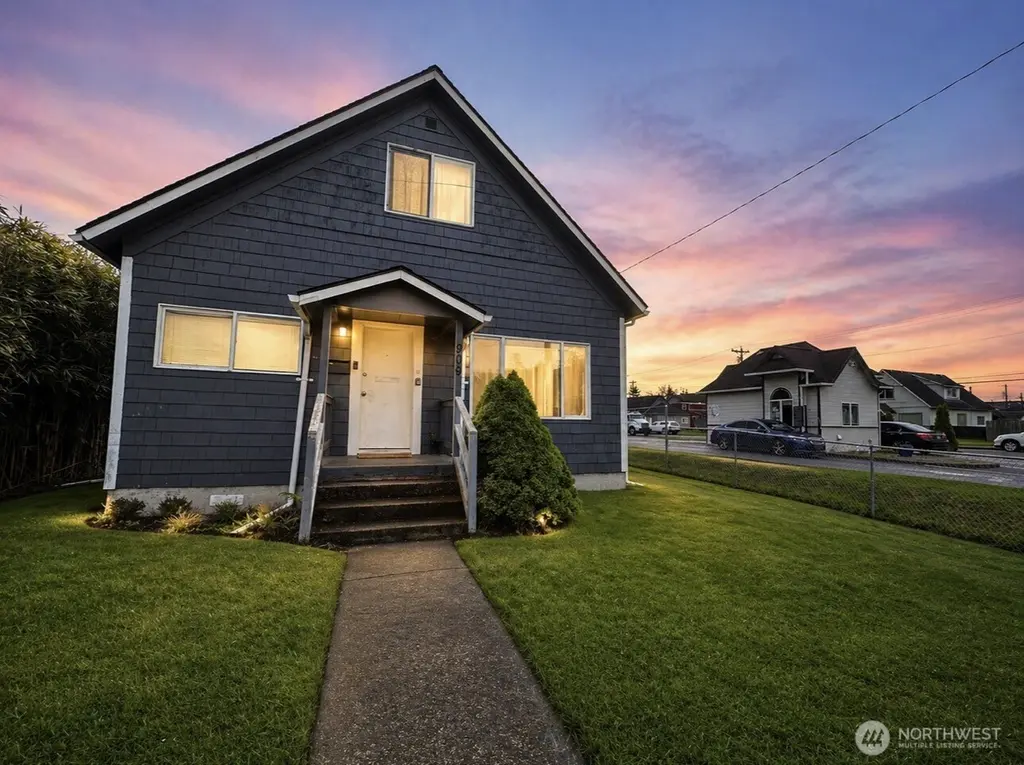
909 E 2nd St · Aberdeen, WA
Flood risk 9/10 · Severe
- FEMA flood zone
- X (shaded)
- Chance of flooding over 30 yrs
- 0.99%
- Est. flood insurance / yr
- $507 – $1,088
Fire risk 1/10 · Minimal
- Est. fire insurance / yr
- $604 – $1,122
Heat risk 1/10 · Minimal
- Hot days now (above 77°F)
- 8 days/yr
- Hot days in 30 yrs
- 17 days/yr
Wind risk 1/10 · Minimal
- Chance of severe wind over 30 yrs
- —
Air-quality risk 6/10 · Moderate
- Unhealthy air days now
- 7 days/yr
- Unhealthy air days in 30 yrs
- 7 days/yr
Risk factors via First Street. Map © Google.
Why this score? — see what drove the C- grade
The composite is a weighted blend of 9 inputs, each scored 0–100. Each bar is that input's sub-score; the figure is the points it added to the 100-point composite (weight × sub-score).
- Cash flow +20.9/30.0
- ARV discount +8.7/15.0
- DSCR +6.6/10.0
- 1% rule +4.6/10.0
- Livability +4.0/5.0
- Rent growth +3.6/5.0
- Schools +3.6/10.0
- Condition / age +2.5/5.0
- Appreciation +0.0/10.0
$290,000
🖨 Deal sheet (PDF) 📄 Offer letter ✓ Due diligence
Multi-family units
County records classify this as Multi-Family (2-4 Unit). Listing-text estimate: 2 units. confirmed
Listing remarks
Great investment opportunity in the City of Aberdeen! This duplex offers owner-occupant or investment potential—live in one unit while renting the other. Excellent rental history with upper and lower units. Lower unit features 3 bedrooms and 1 bath; upper unit features 2 bedrooms and 1 bath. Property has seen major renovations, including new electrical panels (2026), new roof (2024), exterior paint (2024), and new fence (2025). Upper unit has been renovated with new flooring, paint, trim, stove, kitchen cabinets, and refreshed bathroom. Lower unit was renovated in 2021 with updated flooring/carpet, kitchen cabinets, stove, and refrigerator. Skirting was replaced in February 2026, vapo
Key facts
- Exterior paint
- Major renovations
- New roof
Tags
Property features AI
Finance
- Other: Listing accepts Cash, Conventional, FHA, and VA financing
- Financial info: Gross scheduled income: $36,000; Gross adjusted income: $18,000; Total monthly income: $2,600; Actual rents: Unit 909 $1,500; Unit 909 1/2 $1,100; Net operating income: $28,113; Total annual expenses: $5,007; Insurance expense: $2,826; Electric expense (monthly): $300; Gross rent multiplier: 8.8; Vacancy rate: 8%; 2 units in building, none below grade
Exterior
- Parking: 4 uncovered parking spaces
- Security: Partially fenced
- Utilities: Electric energy source; Public water (City of Aberdeen Utilities); Sewer connected (City of Aberdeen Utilities); Power provided by Grays Harbor PUD; Cable and internet connected via Comcast; Monthly water/sewer/garbage estimate: $300
- Home design: Duplex (residential income / multi-family); Updated/remodeled condition; Has a view; 2 stories; Built circa 1920; Entry supported on pillar/post/pier foundation
- Construction: Standard frame construction; Wood exterior; Composition roof
- Exterior features: Partially fenced yard; Cable TV and high-speed internet available; Alley access; Curbs, paved streets and sidewalks
Interior
- Kitchen: Both units have range/oven; Both units include refrigerator; No dishwashers in either unit
- Bedrooms: Unit 909: 3 bedrooms; Unit 909 1/2: 2 bedrooms; Up to 5 possible bedrooms total
- Flooring: Vinyl; Carpet
- Bathrooms: Unit 909: 1 bathroom; Unit 909 1/2: 1 bathroom
- Heating & cooling: Baseboard heating; No cooling
- Interior features: Vinyl and carpet flooring; Partially fenced property
- Laundry & utility: No in-unit washer/dryer provided (both units)
Neighborhood map
What this means for you Summary
Snapshot
- This is a 2 × 2-bed/1.0-bath units multifamily listed at $290k.
Deal economics
- At list price, monthly cash flow is $336 ($4k/yr) — positive. Per door: $168/mo.
- The deal already cash-flows at list — no discount required.
- To meet the 1% rule (rent ≥ 1% of price), the offer needs to be $279k (3.8% below list).
- Recommended offer: $279k (3.8% below list) — sets the bar for 1% rule.
- Cap rate 8.0% vs local median 4.1% in Aberdeen — top-decile yield for the area; either an underpriced asset or a hidden risk that comps aren't pricing in. Stress-test before assuming the spread holds.
Location & tenants
- Location reads 81/100 on livability (#73 in WA, #1,320 nationally) — a professional / high-income tenant draw. Strengths: amenities A+, commute A+, cost of living A+; Watch: crime D-, employment F.
- Aberdeen School District (town): math 35% / reading 45% proficiency, ranked #222 of 291 in WA (top 76%) — families likely to look elsewhere, expect single-tenant / working-renter base with shorter leases; 61% free/reduced lunch — lower-income household profile, screen leases tightly.
- Zoned schools: Stevens Elementary School (345 students, 89% FRL); Miller Junior High (718 students, 68% FRL); Harbor Junior/Senior High School (124 students, 80% FRL) — zoned schools average 79% FRL vs 61% district-wide (18 pts higher); higher-poverty schools than district average — tighter screening recommended.
- Market conditions: Rents rising fast (+4.3%/yr); 266 active listings in the ZIP; 3 comparable units currently listed for rent nearby; rentals lingering (median 46d on market — plan ~5-8 weeks vacancy on turnover, expect pricing pressure); 100% of comp listings sitting > 30 days — soft ceiling on asking rent; 297 units permitted in Grays Harbor County in 2024 (17 in 5+ unit buildings).
- At $2,789/mo this rent would consume 58% of the median local household income ($58k/yr) (locally 635% of renters already pay >50% of income on rent) — very limited rent-growth headroom before tenants either downsize or default.
Forward outlook
- Local home prices are declining (-3.0%/yr); year-one equity from $2k of loan paydown is wiped out by about $9k of value loss. Plan a longer hold.
- Grays Harbor County population projected at -24% by 2050 — secular population decline; favor cash flow + early exit over multi-decade hold.
Negotiation context
- It's been on market 55 days — a 3% lower offer ($281k) is reasonable based on typical stale-listing flexibility.
- 5 sale attempts since 22y ago with the ask held roughly flat each time — persistent listings suggest the price (not the market) is what's stuck; bring a comps-based counter.
- Current owner paid $179k; list at $290k implies a 62% gain — meaningful room to come down on a strong offer.
Risks & watch-outs
- Watch-outs: flood insurance adds $66/mo; built in 1920 — expect roof / HVAC / electrical / plumbing capex.
- Climate carrying-cost: severe flood risk — expect insurance premiums to compound above CPI over the hold.
Questions for the listing agent
- It's been on market 55 days. Have you received any prior offers? Is the seller open to a 4% concession, seller financing, or rate buy-down credit?
- Can we see the unit-by-unit rent roll, current vacancy, and any below-market leases? What's the average tenancy length?
- What capital expenditures (roof, boiler, parking lot, exteriors) have been made in the last 5 years, and what's planned in the next 2?
- Built in 1920 — when were the roof, HVAC, electrical panel, plumbing, and water heater last replaced?
- What's the actual annual flood-insurance premium (NFIP or private), and is the property in a SFHA with mandatory coverage?
- Is there a deadline driving the sale (1031 exchange, divorce, estate, relocation)? That informs how much negotiation room exists.
- Schools are D-rated, which usually means shorter tenancies and higher turnover. Who's the typical renter profile here, and what's been the actual vacancy rate?
- Crime grade is D in this area — have there been break-ins, vandalism, or insurance claims at this property in the last 3 years? What carrier currently insures it and at what premium?
- What's the average days-on-market for RENTAL listings here right now (not sales)? A rising rental-DOM trend means longer vacancies and softer asking-rent achievability than the comps imply.
- What's the recent tenant-quality profile in this submarket — average credit score on applications, eviction rate, late-payment / NSF rate, and stable-employment percentage? A property-management company in the area should have these aggregated.
- How much new apartment / multifamily construction is in the pipeline within 1–3 miles? Heavy new supply (>2% of stock underway) typically softens rents 12–24 months out; light construction supports rent growth.
Investment metrics
- 1% rule
- 0.96% ✗
- Cap rate
- 7.96%
- Cash-on-cash
- 5.94%
- DSCR
- 1.26
- GRM
- 8.7
CMA / ARV
- ARV (median comp)
- $298,040
- List price
- $290,000
- Delta
- -2.70%
- Verdict
- FAIR
- Comps
- 9 within 1.0 mi
Projected returns pro-forma
-3.0% appreciation · 4.35% rent growth · sell at horizon
- IRR
- -7.2%
- Equity multiple
- 0.73×
- Total profit
- $-21,813
- Equity at exit
- $43,240
- IRR
- 3.9%
- Equity multiple
- 1.30×
- Total profit
- $24,562
- Equity at exit
- $25,074
Cash invested: $81,200 (down + closing). Projections, not guarantees.
Landlord ↔ Tenant lean methodology
- Overall (STATE)
- 28 Tenant-Leaning
- State Washington
- 28 Tenant-Leaning · D+8
- County
- — inherits STATE
- City
- — inherits STATE
ZIP-level market 98520
- Rents YoY
- 4.3%
- Active inventory
- 266
- Price-to-rent
- 17.3×
Monthly cashflow live
- Estimated rent
- $2,789 medium interval (Pro) →
- Mortgage (P&I)
- −$1,521
- Tax from tax record
- −$160 /mo · $1,914/yr
- Insurance
- −$121
- Flood insurance flood zone
- −$66 /mo · $798/yr
- HOA
- −$0
- Vacancy / Maint / Mgmt
- −$586
- Net cashflow
- $336
Break-even live
Sensitivity live
| Price | -10% $500 | -5% $418 | +0% $336 | +5% $254 | +10% $172 |
|---|---|---|---|---|---|
| Rent | -10% $115 | -5% $226 | +0% $336 | +5% $446 | +10% $556 |
| Rate | -1.0pp $482 | -0.5pp $409 | base $336 | +0.5pp $261 | +1.0pp $184 |
2-unit breakdown (identical units grouped — click to expand)
| Units | Beds | Baths | Est. rent |
|---|---|---|---|
| 2× units | 2 | 1 | $2,788 |
| #1 | 2 | 1 | $1,394 |
| #2 | 2 | 1 | $1,394 |
| Total (2 units) | $2,789 | ||
UW: 25.0% down · 7.5% · 30yr · 1.5% tax · 5.0% vac · 8.0% maint · 8.0% mgmt
Financing live
Cash to close
- Down payment
- $72,500
- Closing costs
- $8,700
- Reserves months
- —
- Total cash needed
- —
Loan-product check · same deal, 3 products live
Conventional
25% down · 7.5% · 30yr
- Down + closing
- —
- Monthly P&I
- —
- Monthly cashflow
- —
- DSCR
- —
- Eligible?
- —
Personal DTI + credit; lowest rate.
DSCR
20% down · 8.5% · 30yr
- Down + closing
- —
- Monthly P&I
- —
- Monthly cashflow
- —
- DSCR
- —
- Eligible?
- —
No personal income docs; deal must DSCR.
Hard money
10% down · 12.0% · 12mo
- Down + closing
- —
- Monthly P&I
- —
- Monthly cashflow
- —
- DSCR
- —
- Eligible?
- —
Short-term bridge; refi at stabilization.
Rent comps 3 comps
| Address | Beds | Baths | Sqft | Rent | $/sqft | DOM | Units | Dist |
|---|---|---|---|---|---|---|---|---|
| 908 E 1st St Aberdeen, WA | 3.0 | 1.0 | 1608 | $2,100 | $1.31 | 46d | 1 | 0.06mi |
| 801 Olympic Sq Aberdeen, MD | 2.0–3.0 | 2.0 | 1344 | $2,267 | $1.69 | 46d | 3 | 0.65mi |
| 1619 W 6th St Aberdeen, WA | 4.0 | 2.0 | 1750 | $2,295 | $1.31 | 46d | 1 | 1.21mi |
Listing history 31 events
-
2026-06-22days on market $290,000 Active 55 DOM
-
2026-06-21days on market $290,000 Active 54 DOM
-
2026-06-19days on market $290,000 Active 52 DOM
-
2026-06-18days on market $290,000 Active 51 DOM
-
2026-06-17days on market $290,000 Active 50 DOM
-
2026-06-16days on market $290,000 Active 49 DOM
-
2026-06-15pricedays on market $290,000 Active 48 DOM
-
2026-06-14days on market $250,000 Active 46 DOM
-
2026-06-12days on market $250,000 Active 45 DOM
-
2026-06-09days on market $250,000 Active 42 DOM
-
2026-06-08days on market $250,000 Active 41 DOM
-
2026-06-07days on market $250,000 Active 40 DOM
-
2026-06-03pricedays on market $250,000 Active 36 DOM
-
2026-06-02days on market $299,000 Active 35 DOM
-
2026-06-01days on market $299,000 Active 34 DOM
-
2026-05-31days on market $299,000 Active 33 DOM
-
2026-05-30days on market $299,000 Active 32 DOM
-
2026-04-28$299,000 Active
-
2021-06-15soldstatus $179,000 Closed
-
2021-05-06status Pending
-
2021-02-27status Pending
-
2021-01-28status Active
-
2021-01-27status Pending
-
2021-01-25$179,000 Active
-
2018-04-27soldstatus $90,000 Sold
-
2018-04-27soldstatus $90,000
-
2018-03-27status Pending
-
2018-03-14$89,900 Active
-
2005-05-19soldstatus $74,000
-
2005-05-19soldstatus $74,000
-
2004-08-24$74,777
ⓘ Source: listings_history table (triggers on properties + properties_extension) + one-shot
backfill from property_details.listing_events for pre-trigger history.
Tax reassessment forecast WA · Resets to sale price
- Current annual tax
- $1,914 · $160/mo
- Projected year-2 tax
- $2,842 · $237/mo
- Expected delta
- +$928/yr (+$77/mo · 48.5%)
ⓘ Screening estimate from a state-policy table — verify with the county assessor before closing.
Climate risk First Street
- Flood 9/10 Extreme FEMA zone X (shaded) · 99% chance over 30 yrs
- Wildfire 1/10 Low
- Heat 1/10 Low 8 d/yr ≥77°F today · 17 d/yr by 30 yrs out
- Wind 1/10 Low
- Air quality 6/10 Major 7 unhealthy d/yr today · 7 by 30 yrs out
Nearby sold comps map
Loading sold comps map…
Walkable amenities ~0.75 mi
Loading nearby amenities…
Taxation est. · year 1
- Rental income
- $33,468
- − Mortgage interest
- −$16,245
- − Property taxes
- −$1,914
- − Insurance
- −$2,248
- − Repairs & maintenance
- −$2,677
- − Management
- −$2,677
- − Depreciation
- −$8,436
- Taxable loss
- −$729
- Est. tax savings @ 24.0%
- +$175
- After-tax cash flow
- $4,204/yr
For passive investors: Depreciation is non-cash, so a rental often shows a tax loss while cash-flowing — sheltering income. Rental losses are passive: they offset passive income freely, and up to $25,000/yr can offset ordinary (W-2) income if you actively participate and your MAGI is under $100k (phasing out to $0 by $150k); unused losses carry forward. On sale, claimed depreciation is recaptured at up to 25%, and gains may owe capital-gains tax (a 1031 exchange can defer both). Figures are a year-1 estimate at your 24.0% rate — not tax advice; consult a CPA.
Schools (NCES district)
- District
- Aberdeen School District
- NCES district ID
- 5300030
- Math proficiency
- 35% ▼ -1.00%
- Reading proficiency
- 45% ▬ 0.00%
- Median HH income
- $41,896
- Composite
- 36.13/100
- National rank
- #9477
- State rank
- #222 of 291 in WA
Livability — Aberdeen
- Score
- 81/100
- State rank
- #73
- US rank
- #1320
Category grades
Schools grade is shown separately in the Schools card above.
Census & demographics
- Census place
- Aberdeen, WA
- County
- Grays Harbor County · 44,693 people
- City population
- 24,888
- Metro
- Aberdeen, WA
- Population (ZIP)
- 24,888
- Household income
- $58,153
- Rent vs Own
- Severe rent burden
- 635.0
Population outlook (Grays Harbor County) Hauer SSP2
- Today (2025)
- 66,443 people
- By 2030
- 63,255 · -4.8%
- By 2040
- 56,466 · -15.0%
- By 2050
- 50,516 · -24.0%
- By 2075
- 39,296 · -40.9%
- By 2100
- 31,142 · -53.1%
Race, ethnicity, and origin ACS 2023
- Neighborhood character
- Predominantly White (70%)
- Race & ethnicity
- White 70% Hispanic / Latino 16% Two or more races 9% Black 4% Native American 3% Asian 1% Pacific Islander 1%
- Hispanic origin (detail)
- Mexican 11%
- Common ancestry
- Portuguese 4% Italian 3% Lithuanian 2%
- Foreign-born
- 7% · Canada
- Languages at home
- 87% English-only · Spanish 10% Other Asian/Pacific 1% German/W. Germanic 1%
Political lean MEDSL · Grays Harbor
- 2024 margin
- Lean R (+6.0) · D 45.6% · R 51.6% · Other 2.8%
- 2008→2024 swing
- -20.6pp toward R · 2008: 14.6pp · 2024: -6.0pp
- All cycles
- 2024: R+6.0 2020: R+6.6 2016: R+7.1 2012: D+14.0 2008: D+14.6
Not yet ingested
- Civics
- —
Market trends
- HPI YoY
- ▼ -138.75%
- Current HPI
- 207.7393
- Rent YoY
- ▲ 4.35%
- Metro
- Aberdeen, WA
- State GDP YoY
- ▲ 4.65%
- F500 in state
- 22
Industry mix (Fortune 500 HQ in WA)
| Industry | F500 HQs | Revenue |
|---|---|---|
| Retail | 2 | $269B |
|
||
| Technology / Retail | 1 | $638B |
|
||
| Technology | 1 | $245B |
|
||
| Telecommunications | 1 | $38B |
|
||
| Food / Beverage | 1 | $36B |
|
||
| Automotive / Trucks | 1 | $34B |
|
||
Price history
+287.8% since first listed16 events — show timeline
- 2026-06-14 Price Changed $290,000 NWMLS as Distributed by MLS Grid
- 2026-06-03 Price Changed $250,000 NWMLS as Distributed by MLS Grid
- 2026-04-28 Listed $299,000 NWMLS as Distributed by MLS Grid
- 2021-06-15 Sold (MLS) $179,000 NWMLS as Distributed by MLS Grid
- 2021-05-06 Pending — NWMLS as Distributed by MLS Grid
- 2021-02-27 Pending — NWMLS as Distributed by MLS Grid
- 2021-01-28 Relisted — NWMLS as Distributed by MLS Grid
- 2021-01-27 Pending — NWMLS as Distributed by MLS Grid
- 2021-01-25 Listed $179,000 NWMLS as Distributed by MLS Grid
- 2018-04-27 Sold (Public Records) $90,000 Public Records
- 2018-04-27 Sold (MLS) $90,000 NWMLS as Distributed by MLS Grid
- 2018-03-27 Pending — NWMLS as Distributed by MLS Grid
- 2018-03-14 Listed $89,900 NWMLS as Distributed by MLS Grid
- 2005-05-19 Sold (Public Records) $74,000 Public Records
- 2005-05-19 Sold (MLS) $74,000 NWMLS as Distributed by MLS Grid
- 2004-08-24 Listed $74,777 NWMLS as Distributed by MLS Grid
Property tax history
+5.2%/yrLatest (2026): $1,914 · +21.1% YoY. Source: county tax records.
Cash-flow waterfall
monthlySold comps — $/sqft
last 12 mo · ≤1 miLoading sold comps…