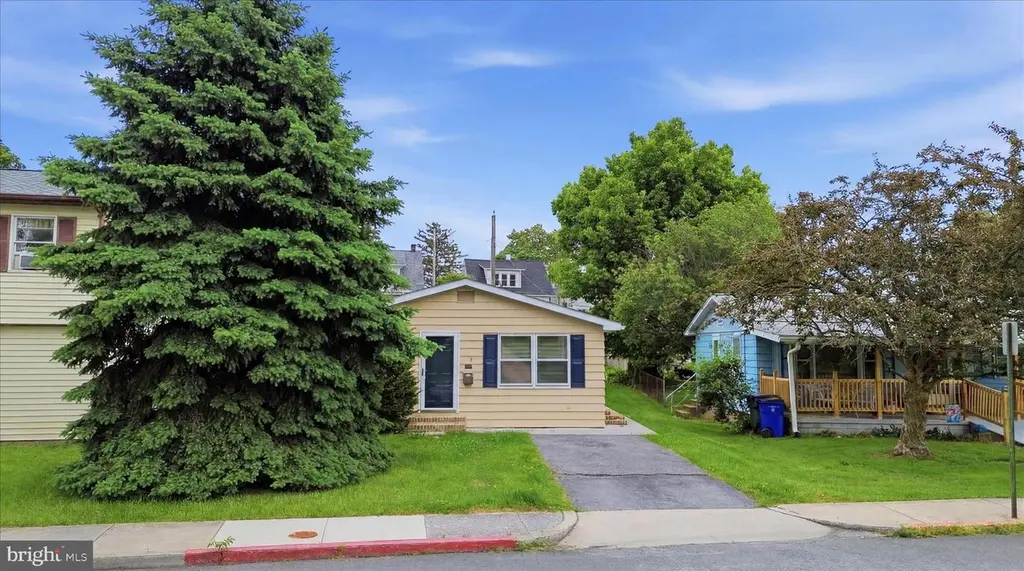
860 Pine St · Hagerstown, MD
Flood risk 6/10 · Moderate
- FEMA flood zone
- X (unshaded)
- Chance of flooding over 30 yrs
- 0.71%
- Est. flood insurance / yr
- $507 – $1,088
Fire risk 1/10 · Minimal
- Est. fire insurance / yr
- $755 – $1,403
Heat risk 5/10 · Moderate
- Hot days now (above 101°F)
- 7 days/yr
- Hot days in 30 yrs
- 17 days/yr
Wind risk 2/10 · Minimal
- Chance of severe wind over 30 yrs
- 2.0%
Air-quality risk 2/10 · Minimal
- Unhealthy air days now
- 1 days/yr
- Unhealthy air days in 30 yrs
- 2 days/yr
Risk factors via First Street. Map © Google.
Why this score? — see what drove the D grade
The composite is a weighted blend of 9 inputs, each scored 0–100. Each bar is that input's sub-score; the figure is the points it added to the 100-point composite (weight × sub-score).
- Cash flow +12.5/30.0
- ARV discount +11.3/15.0
- Livability +3.9/5.0
- DSCR +3.7/10.0
- Rent growth +3.5/5.0
- 1% rule +2.6/10.0
- Condition / age +2.5/5.0
- Schools +2.3/10.0
- Appreciation +0.0/10.0
$215,000
🖨 Deal sheet (PDF) 📄 Offer letter ✓ Due diligence
Listing remarks
Cute one story home on quiet street in Southend and close to CIty Park. New roof on house and shed in rear; new flooring through out; freshly painted interior. Three bedrooms, 1 bath; washer and dryer, central air.
Key facts
- Quiet street
- Close to city park
- One story home
Tags
Property features AI
Exterior
- Parking: Two driveway parking spaces; Two total garage and parking spaces; On-street parking available
- Utilities: Public water; Public sewer; Electric hot water; Electric heating fuel; Electric cooling fuel
- Home design: Detached property; Very good condition; Year built per assessor
- Construction: Aluminum siding; Shingle roof; Crawl space foundation; Double-pane windows with screens and storm windows; Building not winterized
- Exterior features: Not in a federal flood zone; Municipal trash service; Above-grade and below-grade structures; Shed on the property; Annual ground rent payment
Interior
- Kitchen: Electric oven/range; Exhaust fan
- Bedrooms: Three bedrooms on the main level
- Flooring: Carpet; Vinyl
- Bathrooms: One full bathroom (main level)
- Heating & cooling: Electric baseboard heating; Central air conditioning; Ceiling fans; Electric heating and cooling systems
- Interior features: Traditional floor plan; Dining area; Ceiling fan(s); Entry-level bedroom; Kitchenette; Drywall and paneled walls; Storm door
- Laundry & utility: Washer and dryer in unit; Main-floor laundry hookups; Electric water heater
Neighborhood map
What this means for you Summary
Snapshot
- This is a 3-bed/1.0-bath single-family listed at $215k.
Deal economics
- At list price, monthly cash flow is $-31 ($-372/yr) — negative.
- To cash-flow at today's rent, offer at most $210k (2.5% below list).
- To meet the 1% rule (rent ≥ 1% of price), the offer needs to be $163k (24.3% below list).
- Recommended offer: $163k (24.3% below list) — sets the bar for 1% rule.
- Cap rate 6.1% vs local median 4.4% in Hagerstown — top-decile yield for the area; either an underpriced asset or a hidden risk that comps aren't pricing in. Stress-test before assuming the spread holds.
Location & tenants
- Location reads 77/100 on livability (#83 in MD, #3,170 nationally) — a middle-class / working-renter tenant base. Strengths: commute A+, cost of living A+, health & safety A+; Watch: crime F, employment F.
- Washingtion County Public Schools (suburban): math 18% / reading 33% proficiency, ranked #13 of 24 in MD (top 54%) — low school quality limits family demand, transient renter base, plan for 1-2y turnover.
- Zoned schools: Bester Elementary (math 5% / reading 11%, grade F, #674 of 860 statewide, top 79%, 494 students, 88% FRL); E. Russell Hicks Middle (math 8% / reading 31%, grade F, #154 of 225 statewide, top 68%, 824 students, 74% FRL); South Hagerstown High (math 30% / reading 63%, grade D-, #118 of 222 statewide, top 54%, 1,487 students, 78% FRL) — zoned schools average 80% FRL vs 39% district-wide (41 pts higher); higher-poverty schools than district average — tighter screening recommended.
- Market conditions: Rents rising fast (+4.0%/yr); 383 active listings in the ZIP; 40 comparable units currently listed for rent nearby; rentals at typical pace (median 23d on market — plan ~3-4 weeks tenant-placement turnaround); 45% of comp listings sitting > 30 days — soft ceiling on asking rent; 232 units permitted in Washington County in 2024 (12 in 5+ unit buildings).
- This rent runs 31% of the median local income ($63k/yr) — at the standard rent-burdened threshold; future hikes will face affordability resistance.
Forward outlook
- Local home prices are declining (-3.0%/yr); year-one equity from $1k of loan paydown is wiped out by about $6k of value loss. Plan a longer hold.
Negotiation context
- Only 4 days on market — expect competitive offers; lowballing is unlikely to land.
Risks & watch-outs
- Climate carrying-cost: major flood risk; extreme-heat days projected 7→17/yr by 2055 (HVAC capex compounding) — expect insurance premiums to compound above CPI over the hold.
Questions for the listing agent
- What do current leases actually rent for vs. the listed asking? Can we see a recent rent roll and the last 12 months of T-12 income?
- Is there a deadline driving the sale (1031 exchange, divorce, estate, relocation)? That informs how much negotiation room exists.
- Crime grade is F in this area — have there been break-ins, vandalism, or insurance claims at this property in the last 3 years? What carrier currently insures it and at what premium?
- The area grade is low — what's the realistic commute time and amenity access for the typical tenant pool here? Any planned neighborhood developments (good or bad) we should know about?
- What's the average days-on-market for RENTAL listings here right now (not sales)? A rising rental-DOM trend means longer vacancies and softer asking-rent achievability than the comps imply.
- What's the recent tenant-quality profile in this submarket — average credit score on applications, eviction rate, late-payment / NSF rate, and stable-employment percentage? A property-management company in the area should have these aggregated.
- How much new for-sale + rental construction is in the pipeline within 1–3 miles? Heavy new supply typically softens prices + rents 12–24 months out; constrained supply supports both.
Investment metrics
- 1% rule
- 0.76% ✗
- Cap rate
- 6.12%
- Cash-on-cash
- -0.62%
- DSCR
- 0.97
- GRM
- 11.0
CMA / ARV
- ARV (median comp)
- $234,677
- List price
- $215,000
- Delta
- -8.38%
- Verdict
- FAIR
- Comps
- 20 within 1.0 mi
Show comp detail 11 sales within ~0.75 mi
| Address | Dist | Beds/Ba | Sqft | Sold | Price | $/sf | Match |
|---|---|---|---|---|---|---|---|
| 847 Pine St | 0.03mi | 3/1.0 | 1,000 (-1%) | 5mo | $225,000 | $225 | 93 |
| 719 Virginia Ave | 0.23mi | 3/2.0 | 1,008 (0%) | 3mo | $269,000 | $267 | 83 |
| 842 Guilford Ave | 0.14mi | 3/3.0 | 1,108 (+10%) | 1mo | $305,000 | $275 | 68 |
| 1123 Moller Ave | 0.50mi | 2/1.0 (-1) | 1,023 (+2%) | 6mo | $250,000 | $244 | 64 |
| 731 Maryland Ave | 0.31mi | 2/1.0 (-1) | 935 (-7%) | 13mo | $229,900 | $246 | 58 |
| 111 W Wilson Blvd | 0.33mi | 2/1.0 (-1) | 972 (-4%) | 22mo | $185,000 | $190 | 55 |
| 832 S Potomac St | 0.42mi | 2/1.5 (-1) | 1,136 (+13%) | 11mo | $194,000 | $171 | 43 |
| 23 W Wilson Blvd | 0.41mi | 2/1.0 (-1) | 1,125 (+12%) | 20mo | $225,000 | $200 | 39 |
| 411 Reynolds Ave | 0.47mi | 3/1.0 | 1,145 (+14%) | 19mo | $200,000 | $175 | 39 |
| 1106 S Potomac St | 0.69mi | 3/1.5 | 864 (-14%) | 9mo | $248,000 | $287 | 34 |
| 1029 Rose Hill Ave | 0.72mi | 3/2.0 | 1,152 (+14%) | 23mo | $276,900 | $240 | 19 |
Match score weights: distance 35% · size 25% · config 20% · recency 20%. Top-matched comps best support the ARV.
Projected returns pro-forma
-3.0% appreciation · 4.0% rent growth · sell at horizon
- IRR
- -16.4%
- Equity multiple
- 0.41×
- Total profit
- $-35,240
- Equity at exit
- $32,057
- IRR
- -6.7%
- Equity multiple
- 0.56×
- Total profit
- $-26,629
- Equity at exit
- $18,589
Cash invested: $60,200 (down + closing). Projections, not guarantees.
Landlord ↔ Tenant lean methodology
- Overall (STATE)
- 27 Tenant-Leaning
- State Maryland
- 27 Tenant-Leaning · D+14
- County
- — inherits STATE
- City
- — inherits STATE
ZIP-level market 21740
- Rents YoY
- 4.0%
- Active inventory
- 383
- Price-to-rent
- 11.0×
Monthly cashflow live
- Estimated rent
- $1,627 high interval (Pro) →
- Mortgage (P&I)
- −$1,127
- Tax from tax record
- −$99 /mo · $1,189/yr
- Insurance
- −$90
- HOA
- −$0
- Vacancy / Maint / Mgmt
- −$342
- Net cashflow
- $-31
Break-even live
Sensitivity live
| Price | -10% $91 | -5% $30 | +0% $-31 | +5% $-92 | +10% $-153 |
|---|---|---|---|---|---|
| Rent | -10% $-160 | -5% $-95 | +0% $-31 | +5% $33 | +10% $98 |
| Rate | -1.0pp $77 | -0.5pp $24 | base $-31 | +0.5pp $-87 | +1.0pp $-143 |
UW: 25.0% down · 7.5% · 30yr · 1.5% tax · 5.0% vac · 8.0% maint · 8.0% mgmt
Financing live
Cash to close
- Down payment
- $53,750
- Closing costs
- $6,450
- Reserves months
- —
- Total cash needed
- —
Loan-product check · same deal, 3 products live
Conventional
25% down · 7.5% · 30yr
- Down + closing
- —
- Monthly P&I
- —
- Monthly cashflow
- —
- DSCR
- —
- Eligible?
- —
Personal DTI + credit; lowest rate.
DSCR
20% down · 8.5% · 30yr
- Down + closing
- —
- Monthly P&I
- —
- Monthly cashflow
- —
- DSCR
- —
- Eligible?
- —
No personal income docs; deal must DSCR.
Hard money
10% down · 12.0% · 12mo
- Down + closing
- —
- Monthly P&I
- —
- Monthly cashflow
- —
- DSCR
- —
- Eligible?
- —
Short-term bridge; refi at stabilization.
Rent comps 40 comps
| Address | Beds | Baths | Sqft | Rent | $/sqft | DOM | Units | Dist |
|---|---|---|---|---|---|---|---|---|
| 837 Virginia Ave Hagerstown, MD | 3.0 | 2.0 | 1400 | $2,000 | $1.43 | 15d | 1 | 0.11mi |
| 671 Highland Way Unit 5 Hagerstown, MD | 3.0 | 1.0 | 865 | $1,500 | $1.73 | 45d | 1 | 0.16mi |
| 39 W Wilson Blvd Hagerstown, MD | 3.0 | 2.0 | 1440 | $1,730 | $1.20 | 23d | 1 | 0.39mi |
| 909 Corbett St Hagerstown, MD | 3.0 | 2.5 | 1276 | $2,695 | $2.11 | 15d | 1 | 0.57mi |
| 825 Armstrong Ave Hagerstown, MD | 2.0 | 1.0 | 1000 | $1,700 | $1.70 | 15d | 1 | 0.63mi |
| 326 S Potomac St #2 Hagerstown, MD | 2.0 | 1.0 | 1350 | $1,500 | $1.11 | 45d | 1 | 0.78mi |
| 326 S Potomac St #1 Hagerstown, MD | 2.0 | 1.0 | 1050 | $1,400 | $1.33 | 45d | 1 | 0.78mi |
| 124 Ray St Hagerstown, MD | 3.0 | 1.0 | 960 | $1,500 | $1.56 | 23d | 1 | 0.78mi |
| 338 S Locust St Hagerstown, MD | 3.0 | 1.5 | 1320 | $1,600 | $1.21 | 23d | 1 | 0.78mi |
| 1527 Sherman Ave Unit 2 Hagerstown, MD | 3.0 | 2.5 | 1496 | $2,100 | $1.40 | 23d | 1 | 0.89mi |
| 1529 Sherman Ave Unit 1 Hagerstown, MD | 3.0 | 2.5 | 1496 | $2,100 | $1.40 | 23d | 1 | 0.89mi |
| 101 Doub Way Hagerstown, MD | 3.0 | 1.0 | 1048 | $1,635 | $1.56 | 23d | 1 | 0.91mi |
| 612 Frederick St Hagerstown, MD | 4.0 | 2.0 | 1422 | $1,875 | $1.32 | 23d | 1 | 0.96mi |
| 50 Rochester Pl Unit 23 Hagerstown, MD | 2.0 | 1.0 | 900 | $1,275 | $1.42 | 45d | 1 | 1.08mi |
| 92 W Washington St Unit 403 Hagerstown, MD | 2.0 | 1.5 | 924 | $1,550 | $1.68 | 45d | 1 | 1.16mi |
| 92 W Washington St Unit 410 Hagerstown, MD | 3.0 | 1.5 | 1415 | $1,795 | $1.27 | 45d | 1 | 1.16mi |
| 92 W Washington St Unit 206 Hagerstown, MD | 2.0 | 2.0 | 803 | $1,450 | $1.81 | 45d | 1 | 1.16mi |
| 92 W Washington St Unit 405 Hagerstown, MD | 2.0 | 1.0 | 1083 | $1,650 | $1.52 | 45d | 1 | 1.16mi |
| 17958 Hickory Ln Hagerstown, MD | 2.0 | 1.5 | 1132 | $1,650 | $1.46 | 45d | 1 | 1.17mi |
| 103 E Washington St Unit 1E Hagerstown, MD | 3.0 | 1.0 | 1200 | $1,200 | $1.00 | 15d | 1 | 1.18mi |
| 40 E Washington St Unit 2B Hagerstown, MD | 2.0 | 1.0 | 800 | $1,000 | $1.25 | 45d | 1 | 1.19mi |
| 60 E Washington St Apt 1E Hagerstown, MD | 3.0 | 1.5 | 1300 | $1,500 | $1.15 | 23d | 1 | 1.20mi |
| 104 Buena Vista Ave Unit 104 Hagerstown, MD | 3.0 | 1.0 | 1100 | $1,400 | $1.27 | 45d | 1 | 1.24mi |
| 382 S Cleveland Ave Unit 4 Hagerstown, MD | 2.0 | 1.0 | 900 | $1,200 | $1.33 | 15d | 1 | 1.25mi |
| 1160-A Kenly Ave Hagerstown, MD | 2.0 | 1.0–2.0 | 980 | $1,722 | $1.76 | 15d | 8 | 1.26mi |
| 1160 Kenly Ave Hagerstown, MD | 2.0 | 2.0 | 1000 | $1,779 | $1.78 | 45d | 1 | 1.26mi |
| 834 W Washington St Unit 2 Hagerstown, MD | 2.0 | 1.0 | 950 | $955 | $1.01 | 45d | 1 | 1.27mi |
| 42 E Franklin St Hagerstown, MD | 3.0 | 1.5 | 1200 | $1,350 | $1.12 | 45d | 1 | 1.29mi |
| 115 N Potomac St Unit 2 Hagerstown, MD | 2.0 | 1.0 | 1200 | $1,250 | $1.04 | 23d | 1 | 1.30mi |
| 17940 Garden Ln Hagerstown, MD | 1.0–3.0 | 1.0–2.0 | 1020 | $1,706 | $1.67 | 15d | 19 | 1.30mi |
| 149 E Franklin St Hagerstown, MD | 2.0 | 1.0 | 850 | $1,250 | $1.47 | 45d | 1 | 1.31mi |
| 812 Dale St Hagerstown, MD | 3.0 | 1.0 | 1064 | $1,730 | $1.63 | 45d | 1 | 1.31mi |
| 821 Washington Ave Unit 1W Hagerstown, MD | 2.0 | 1.0 | 800 | $1,100 | $1.38 | 23d | 1 | 1.34mi |
| 115 East Ave Unit 2 Hagerstown, MD | 2.0 | 1.0 | 1200 | $1,400 | $1.17 | 45d | 1 | 1.39mi |
| 616 George St Hagerstown, MD | 3.0 | 1.0 | 1034 | $1,600 | $1.55 | 45d | 1 | 1.40mi |
| 421 Salem Ave Hagerstown, MD | 3.0 | 1.0 | 1256 | $1,550 | $1.23 | 23d | 1 | 1.40mi |
| 505 W Church St Unit 1W 1W Hagerstown, MD | 2.0 | 1.0 | 700 | $1,140 | $1.63 | 23d | 1 | 1.40mi |
| 210 N Locust St Hagerstown, MD | 3.0 | 1.0 | 1476 | $1,275 | $0.86 | 23d | 1 | 1.42mi |
| 235 East Ave Hagerstown, MD | 2.0 | 1.0 | 1200 | $1,200 | $1.00 | 15d | 1 | 1.43mi |
| 207 N Mulberry St Unit 3 Hagerstown, MD | 2.0 | 1.0 | 940 | $1,130 | $1.20 | 23d | 1 | 1.43mi |
Listing history 3 events
-
2026-05-15$215,000 Active 214-char remark
-
1991-07-15soldstatus $75,000
-
1989-10-13soldstatus $67,500
ⓘ Source: listings_history table (triggers on properties + properties_extension) + one-shot
backfill from property_details.listing_events for pre-trigger history.
Tax reassessment forecast MD · Partial reset (capped growth)
- Current annual tax
- $1,189 · $99/mo
- Projected year-2 tax
- $1,766 · $147/mo
- Expected delta
- +$577/yr (+$48/mo · 48.6%)
ⓘ Screening estimate from a state-policy table — verify with the county assessor before closing.
Climate risk First Street
- Flood 6/10 Major FEMA zone X (unshaded) · 71% chance over 30 yrs
- Wildfire 1/10 Low
- Heat 5/10 Major 7 d/yr ≥101°F today · 17 d/yr by 30 yrs out
- Wind 2/10 Low 2% chance of damaging wind over 30 yrs
- Air quality 2/10 Low 1 unhealthy d/yr today · 2 by 30 yrs out
Nearby sold comps map
Loading sold comps map…
Walkable amenities ~0.75 mi
Loading nearby amenities…
Taxation est. · year 1
- Rental income
- $19,521
- − Mortgage interest
- −$12,043
- − Property taxes
- −$1,189
- − Insurance
- −$1,075
- − Repairs & maintenance
- −$1,562
- − Management
- −$1,562
- − Depreciation
- −$6,255
- Taxable loss
- −$4,164
- Est. tax savings @ 24.0%
- +$999
- After-tax cash flow
- $627/yr
For passive investors: Depreciation is non-cash, so a rental often shows a tax loss while cash-flowing — sheltering income. Rental losses are passive: they offset passive income freely, and up to $25,000/yr can offset ordinary (W-2) income if you actively participate and your MAGI is under $100k (phasing out to $0 by $150k); unused losses carry forward. On sale, claimed depreciation is recaptured at up to 25%, and gains may owe capital-gains tax (a 1031 exchange can defer both). Figures are a year-1 estimate at your 24.0% rate — not tax advice; consult a CPA.
Schools (NCES district)
- District
- Washingtion County Public Schools
- NCES district ID
- 2400660
- Math proficiency
- 18% ▼ -20.00%
- Reading proficiency
- 33% ▼ -17.00%
- Median HH income
- $54,784
- Composite
- 22.87/100
- National rank
- #8007
- State rank
- #13 of 24 in MD
Livability — Hagerstown
- Score
- 77/100
- State rank
- #83
- US rank
- #3170
Category grades
Schools grade is shown separately in the Schools card above.
Census & demographics
- Census place
- Hagerstown, MD
- County
- Washington County · 98,861 people
- City population
- 64,792
- Metro
- Hagerstown-Martinsburg, MD-WV
- Population (ZIP)
- 64,792
- Household income
- $62,873
- Rent vs Own
- Severe rent burden
- 2832.0
Population outlook (Washington County) Hauer SSP2
- Today (2025)
- 151,614 people
- By 2030
- 151,455 · -0.1%
- By 2040
- 150,097 · -1.0%
- By 2050
- 148,193 · -2.3%
- By 2075
- 146,581 · -3.3%
- By 2100
- 138,025 · -9.0%
Race, ethnicity, and origin ACS 2023
- Neighborhood character
- Majority White (64%)
- Race & ethnicity
- White 64% Black 18% Two or more races 10% Hispanic / Latino 10% Asian 2%
- Hispanic origin (detail)
- Mexican 2% Puerto Rican 2% Dominican 2%
- Common ancestry
- Romanian 2% Lithuanian 1% Slovak 1%
- Foreign-born
- 9% · Canada, China
- Languages at home
- 86% English-only · Spanish 9% French/Haitian/Cajun 1% Chinese 1%
Political lean MEDSL · Washington
- 2024 margin
- Strong R (+23.0) · D 37.3% · R 60.4% · Other 2.3%
- 2008→2024 swing
- -10.2pp toward R · 2008: -12.9pp · 2024: -23.0pp
- All cycles
- 2024: R+23.0 2020: R+20.9 2016: R+32.4 2012: R+18.5 2008: R+12.9
Not yet ingested
- Civics
- —
Market trends
- HPI YoY
- ▼ -248.38%
- Current HPI
- 264.8018
- Rent YoY
- ▲ 4.00%
- Metro
- Hagerstown-Martinsburg, MD-WV
- State GDP YoY
- ▲ 2.97%
- F500 in state
- 12
Industry mix (Fortune 500 HQ in MD)
| Industry | F500 HQs | Revenue |
|---|---|---|
| Aerospace / Defense | 1 | $71B |
|
||
| Utilities | 1 | $25B |
|
||
| Hotels | 1 | $24B |
|
||
| Consumer Goods | 1 | $7B |
|
||
| Real Estate | 1 | $6B |
|
||
| Chemicals | 1 | $2B |
|
||
Price history
+181.5% since first listed6 events — show timeline
- 2026-06-01 Sold (Public Records) $190,000 Public Records
- 2026-06-01 Sold (MLS) $190,000 BRIGHT MLS
- 2026-05-19 Pending — BRIGHT MLS
- 2026-05-15 Listed $215,000 BRIGHT MLS
- 1991-07-15 Sold (Public Records) $75,000 Public Records
- 1989-10-13 Sold (Public Records) $67,500 Public Records
Property tax history
-3.0%/yrLatest (2025): $1,189 · +10.3% YoY. Source: county tax records.
Cash-flow waterfall
monthlySold comps — $/sqft
last 12 mo · ≤1 miLoading sold comps…