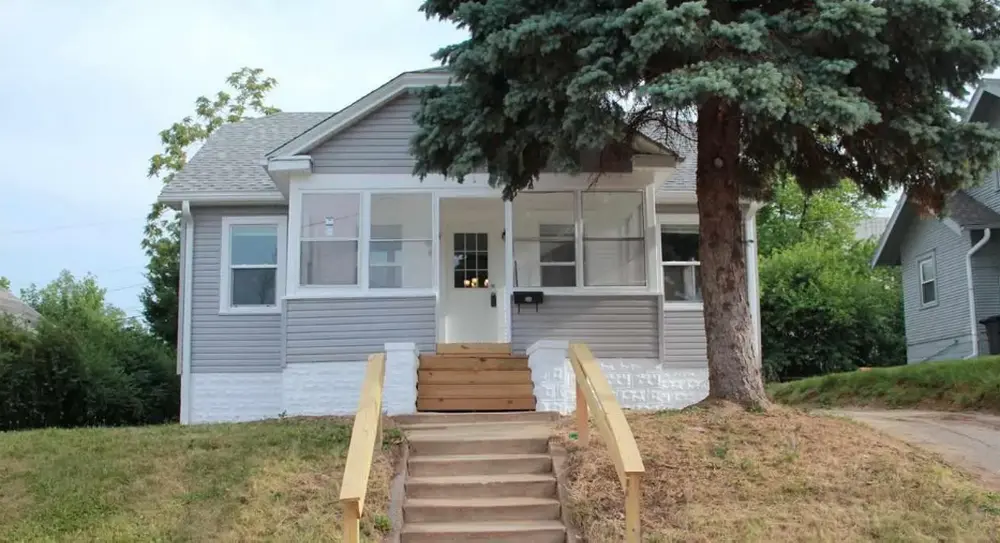
4307 Binney St · Omaha, NE
Flood risk 1/10 · Minimal
- FEMA flood zone
- X (unshaded)
- Chance of flooding over 30 yrs
- 0.0%
- Est. flood insurance / yr
- $473 – $860
Fire risk 1/10 · Minimal
- Est. fire insurance / yr
- $1,161 – $2,155
Heat risk 3/10 · Minor
- Hot days now (above 104°F)
- 7 days/yr
- Hot days in 30 yrs
- 15 days/yr
Wind risk 2/10 · Minimal
- Chance of severe wind over 30 yrs
- —
Air-quality risk 2/10 · Minimal
- Unhealthy air days now
- 0 days/yr
- Unhealthy air days in 30 yrs
- 1 days/yr
Risk factors via First Street. Map © Google.
Why this score? — see what drove the C grade
The composite is a weighted blend of 9 inputs, each scored 0–100. Each bar is that input's sub-score; the figure is the points it added to the 100-point composite (weight × sub-score).
- Cash flow +18.5/30.0
- Appreciation +10.0/10.0
- ARV discount +7.5/15.0
- DSCR +5.8/10.0
- 1% rule +5.0/10.0
- Livability +4.2/5.0
- Rent growth +3.3/5.0
- Condition / age +2.5/5.0
- Schools +2.1/10.0
$149,999
🖨 Deal sheet 📄 Offer letter ✓ Due diligence
Listing remarks MLS
Available now! Charming bungalow near popular Benson area. Great updated home with bonus room on second floor and extra space in semi finished basement. Make this home yours today!
Key facts
- 4,550 sq ft lot
- Built 1924
- Listed 249 days
Neighborhood map
What this means for you Summary
Snapshot
- This is a 3-bed/1.0-bath other listed at $150k.
Deal economics
- At list price, monthly cash flow is $142 ($2k/yr) — positive.
- The deal already cash-flows at list — no discount required.
- To meet the 1% rule (rent ≥ 1% of price), the offer needs to be $150k (0.0% below list).
- Recommended offer: $132k (12.0% below list) — sets the bar for market timing.
- Cap rate 7.4% vs local median 3.6% in Omaha — top-decile yield for the area; either an underpriced asset or a hidden risk that comps aren't pricing in. Stress-test before assuming the spread holds.
Location & tenants
- Location reads 84/100 on livability (#7 in NE, #663 nationally) — a professional / high-income tenant draw. Strengths: amenities A+, commute A+, cost of living A+; Watch: crime F.
- Omaha Public Schools (urban): math 20% / reading 28% proficiency, ranked #110 of 111 in NE (top 99%) — low school quality limits family demand, transient renter base, plan for 1-2y turnover; 62% free/reduced lunch — lower-income household profile, screen leases tightly.
- Market conditions: Rents rising (+3.2%/yr); 139 active listings in the ZIP; 40 comparable units currently listed for rent nearby; rentals at typical pace (median 24d on market — plan ~3-4 weeks tenant-placement turnaround); lower-income renter base — watch delinquency; 4,539 units permitted in Douglas County in 2024 (2,583 in 5+ unit buildings).
- This rent runs 43% of the median local income ($42k/yr) — at the standard rent-burdened threshold; future hikes will face affordability resistance.
Forward outlook
- In year one you build about $16k of equity ($1k loan paydown + $15k appreciation (10.0% local appreciation)).
- Douglas County population projected at +28% by 2050 — long-run rental-demand tailwind backs the buy-and-hold thesis.
- At projected returns (10.0% appreciation + 3.2% rent growth), your $42k cash investment doubles in ~3 years — after that, you're playing with house money.
- By year 3, paydown + projected appreciation supports a ~$41k cash-out refi (75% LTV) — recoverable capital for the next deal without selling this one.
Negotiation context
- It's been on market 249 days — a 12% lower offer ($132k) is reasonable based on typical stale-listing flexibility.
- 6 sale attempts since 24y ago; this cycle's ask is 9900% above the opening price — seller raised mid-cycle; expect resistance to lowballs.
Risks & watch-outs
- Watch-outs: built in 1924 — expect roof / HVAC / electrical / plumbing capex.
Questions for the listing agent
- It's been on market 249 days. Have you received any prior offers? Is the seller open to a 12% concession, seller financing, or rate buy-down credit?
- Built in 1924 — when were the roof, HVAC, electrical panel, plumbing, and water heater last replaced?
- Why hasn't it sold? Are there any deal-killer items the seller is aware of (foundation, flood, title, zoning, code violations)?
- Is there a deadline driving the sale (1031 exchange, divorce, estate, relocation)? That informs how much negotiation room exists.
- Crime grade is F in this area — have there been break-ins, vandalism, or insurance claims at this property in the last 3 years? What carrier currently insures it and at what premium?
- What's the average days-on-market for RENTAL listings here right now (not sales)? A rising rental-DOM trend means longer vacancies and softer asking-rent achievability than the comps imply.
- What's the recent tenant-quality profile in this submarket — average credit score on applications, eviction rate, late-payment / NSF rate, and stable-employment percentage? A property-management company in the area should have these aggregated.
- How much new for-sale + rental construction is in the pipeline within 1–3 miles? Heavy new supply typically softens prices + rents 12–24 months out; constrained supply supports both.
Investment metrics
- 1% rule
- 1.00% ✗
- Cap rate
- 7.43%
- Cash-on-cash
- 4.07%
- DSCR
- 1.18
- GRM
- 8.3
CMA / ARV
No comps found within radius.
Projected returns pro-forma
10.0% appreciation · 3.22% rent growth · sell at horizon
- IRR
- 27.3%
- Equity multiple
- 3.17×
- Total profit
- $91,127
- Equity at exit
- $135,131
- IRR
- 23.9%
- Equity multiple
- 7.24×
- Total profit
- $261,951
- Equity at exit
- $291,415
Cash invested: $42,000 (down + closing). Projections, not guarantees.
Landlord ↔ Tenant lean methodology
- Overall (STATE)
- 83 Strongly Landlord-Friendly
- State Nebraska
- 83 Strongly Landlord-Friendly · R+13
- County
- — inherits STATE
- City
- — inherits STATE
ZIP-level market 68111
- Home prices YoY
- 4.0%
- Rents YoY
- 3.2%
- Active inventory
- 139
- Price-to-rent
- 8.3×
Monthly cashflow live
- Estimated rent
- $1,499 high interval (Pro) →
- Mortgage (P&I)
- −$787
- Tax from tax record
- −$193 /mo · $2,316/yr
- Insurance
- −$62
- HOA
- −$0
- Vacancy / Maint / Mgmt
- −$315
- Net cashflow
- $142
Break-even live
UW: 25.0% down · 7.5% · 30yr · 1.5% tax · 5.0% vac · 8.0% maint · 8.0% mgmt
Financing live
Cash to close
- Down payment
- $37,500
- Closing costs
- $4,500
- Reserves months
- —
- Total cash needed
- —
Loan-product check · same deal, 3 products live
Conventional
25% down · 7.5% · 30yr
- Down + closing
- —
- Monthly P&I
- —
- Monthly cashflow
- —
- DSCR
- —
- Eligible?
- —
Personal DTI + credit; lowest rate.
DSCR
20% down · 8.5% · 30yr
- Down + closing
- —
- Monthly P&I
- —
- Monthly cashflow
- —
- DSCR
- —
- Eligible?
- —
No personal income docs; deal must DSCR.
Hard money
10% down · 12.0% · 12mo
- Down + closing
- —
- Monthly P&I
- —
- Monthly cashflow
- —
- DSCR
- —
- Eligible?
- —
Short-term bridge; refi at stabilization.
Rent comps 40 comps
| Address | Beds | Baths | Sqft | Rent | $/sqft | DOM | Units | Dist |
|---|---|---|---|---|---|---|---|---|
| 4276 Binney St Omaha, NE | 4.0 | 1.0 | 1358 | $1,495 | $1.10 | 43d | 1 | 0.06mi |
| 3425 N 45th St Omaha, NE | 2.0 | 1.0 | 872 | $1,500 | $1.72 | 14d | 1 | 0.37mi |
| 3002 N 48th Ave Omaha, NE | 4.0 | 2.0 | 1205 | $1,550 | $1.29 | 23d | 1 | 0.42mi |
| 3356 N 41st St Omaha, NE | 2.0 | 1.0 | 720 | $1,295 | $1.80 | 23d | 1 | 0.42mi |
| 4874 Maple St Omaha, NE | 3.0 | 1.0 | 1098 | $1,545 | $1.41 | 43d | 1 | 0.45mi |
| 3323 N 40th St Omaha, NE | 2.0 | 1.0 | 1000 | $1,575 | $1.57 | 2d | 1 | 0.48mi |
| 3535 N 45th Ave Omaha, NE | 3.0 | 1.0 | 1325 | $1,800 | $1.36 | 43d | 1 | 0.48mi |
| 3508 N 47th Ave Omaha, NE | 3.0 | 1.0 | 1425 | $1,600 | $1.12 | 19d | 1 | 0.50mi |
| 2914 N 49th Ave Omaha, NE | 3.0 | 1.0 | 1375 | $1,615 | $1.17 | 23d | 1 | 0.54mi |
| 3674 Bedford Ave Omaha, NE | 3.0 | 1.0 | 864 | $1,275 | $1.48 | 23d | 1 | 0.62mi |
| 3808 N 48th St Omaha, NE | 3.0 | 2.0 | 1400 | $2,000 | $1.43 | 2d | 1 | 0.69mi |
| 3502 Lake St Omaha, NE | 2.0 | 1.0 | 974 | $995 | $1.02 | 2d | 1 | 0.75mi |
| 4112 N 48th St Omaha, NE | 2.0 | 1.0 | 825 | $899 | $1.09 | 10d | 2 | 0.86mi |
| 4112 N 48th St Unit 2 Omaha, NE | 2.0 | 1.0 | 800 | $899 | $1.12 | 23d | 1 | 0.86mi |
| 4112 N 48th St Unit 3 Omaha, NE | 2.0 | 1.0 | 800 | $850 | $1.06 | 23d | 1 | 0.86mi |
| 4102 Hamilton St Unit 014 Omaha, NE | 2.0 | 1.0 | 811 | $1,120 | $1.38 | 23d | 1 | 0.89mi |
| 4102 Hamilton St Omaha, NE | 2.0 | 1.0 | 811 | $1,120 | $1.38 | 2d | 1 | 0.89mi |
| 5119 Pratt St Omaha, NE | 3.0 | 1.0 | 1008 | $1,900 | $1.88 | 43d | 1 | 0.91mi |
| 4852 Boyd St Omaha, NE | 2.0 | 2.0 | 912 | $1,500 | $1.64 | 43d | 1 | 1.01mi |
| 1306 N 48th Ave Unit 1313258 Omaha, NE | 2.0 | 1.0 | 994 | $875 | $0.88 | 2d | 1 | 1.02mi |
| 4844 Taylor St Apt 4 Omaha, NE | 2.0 | 1.0 | 750 | $925 | $1.23 | 23d | 1 | 1.05mi |
| 3430 Seward St Omaha, NE | 3.0 | 1.0 | 1371 | $1,695 | $1.24 | 14d | 1 | 1.08mi |
| 4821 Nicholas St Apt 2 Omaha, NE | 2.0 | 1.0 | 720 | $1,100 | $1.53 | 43d | 1 | 1.10mi |
| 4821 Nicholas St Omaha, NE | 2.0 | 1.0 | 740 | $1,100 | $1.49 | 23d | 1 | 1.10mi |
| 1112 N 50th Ave Omaha, NE | 2.0 | 1.0 | 1200 | $1,450 | $1.21 | 14d | 1 | 1.13mi |
| 4918 Ames Ave Unit 17 Omaha, NE | 2.0 | 1.5 | 1074 | $850 | $0.79 | 23d | 1 | 1.16mi |
| 915 N 48th Ave Apt 15 Omaha, NE | 2.0 | 1.0 | 950 | $990 | $1.04 | 43d | 1 | 1.18mi |
| 4707 N 40th Ave Omaha, NE | 3.0 | 1.0 | 1337 | $1,500 | $1.12 | 21d | 1 | 1.20mi |
| 4201 Cuming St Omaha, NE | 2.0 | 1.0 | 1272 | $1,350 | $1.06 | 2d | 1 | 1.20mi |
| 1004 Glenwood Ave Unit 2 Omaha, NE | 3.0 | 1.5 | 1000 | $1,500 | $1.50 | 2d | 1 | 1.21mi |
| 828 N 41st Ave Omaha, NE | 2.0 | 1.0 | 1264 | $1,700 | $1.34 | 14d | 1 | 1.23mi |
| 4314 N 52nd St Omaha, NE | 3.0 | 1.0 | 780 | $945 | $1.21 | 14d | 1 | 1.24mi |
| 5633 Parker St Omaha, NE | 3.0 | 1.5 | 1200 | $1,695 | $1.41 | 43d | 1 | 1.30mi |
| 2817 N 60th St Unit 2821/02 Omaha, NE | 3.0 | 1.0 | 1188 | $1,045 | $0.88 | 23d | 1 | 1.32mi |
| 2817 N 60th St Unit 2817/02 Omaha, NE | 3.0 | 1.0 | 1188 | $1,500 | $1.26 | 2d | 1 | 1.33mi |
| 4824 Webster St Unit 4824/4824 Omaha, NE | 4.0 | 1.0 | 1317 | $1,050 | $0.80 | 43d | 1 | 1.37mi |
| 1407 N 31st St Omaha, NE | 2.0 | 1.0 | 1040 | $1,395 | $1.34 | 2d | 1 | 1.40mi |
| 4410 Cass St Omaha, NE | 2.0 | 1.0 | 864 | $1,500 | $1.74 | 23d | 1 | 1.44mi |
| 6010 Evans St Omaha, NE | 3.0 | 2.0 | 1196 | $1,850 | $1.55 | 23d | 1 | 1.44mi |
| 4657 Camden Ave Omaha, NE | 3.0 | 1.0 | 1250 | $1,500 | $1.20 | 43d | 1 | 1.46mi |
Listing history 21 events
-
2026-06-03days on market $149,999 Active 249 DOM
-
2026-06-03days on market $149,999 Active 248 DOM
-
2026-06-01days on market $149,999 Active 247 DOM
-
2026-06-01days on market $149,999 Active 246 DOM
-
2026-05-02historical $1,400
-
2026-04-16price $1,400
-
2026-04-11$1,500
-
2026-03-23historical $1,500
Show marketing remark (180 chars)
Available now! Charming bungalow near popular Benson area. Great updated home with bonus room on second floor and extra space in semi finished basement. Make this home yours today!
-
2026-03-23soldstatus $145,000 Sold 180-char remark
Show marketing remark (180 chars)
Available now! Charming bungalow near popular Benson area. Great updated home with bonus room on second floor and extra space in semi finished basement. Make this home yours today!
-
2026-03-12$1,500
-
2026-02-27status Pending 180-char remark
Show marketing remark (180 chars)
Available now! Charming bungalow near popular Benson area. Great updated home with bonus room on second floor and extra space in semi finished basement. Make this home yours today!
-
2026-01-04price $149,999 41-char remark
Show marketing remark (41 chars)
Formal listing coming soon (Mid-October).
-
2025-12-22$149,999 New 180-char remark
Show marketing remark (180 chars)
Available now! Charming bungalow near popular Benson area. Great updated home with bonus room on second floor and extra space in semi finished basement. Make this home yours today!
-
2025-09-27$160,000 Active 41-char remark
Show marketing remark (41 chars)
Formal listing coming soon (Mid-October).
-
2021-07-23soldstatus $128,000 Sold
-
2021-06-25status Pending
-
2021-06-19$135,000 Active - New
-
2002-03-01soldstatus $52,500
-
2002-03-01soldstatus $53,000
-
2002-02-13historical
-
2002-02-09$44,950
ⓘ Source: listings_history table (triggers on properties + properties_extension) + one-shot
backfill from property_details.listing_events for pre-trigger history.
Tax reassessment forecast NE · Resets to sale price
- Current annual tax
- $2,316 · $193/mo
- Projected year-2 tax
- $2,595 · $216/mo
- Expected delta
- +$279/yr (+$23/mo · 12.1%)
ⓘ Screening estimate from a state-policy table — verify with the county assessor before closing.
Climate risk First Street
- Flood 1/10 Low FEMA zone X (unshaded) · 0% chance over 30 yrs
- Wildfire 1/10 Low
- Heat 3/10 Moderate 7 d/yr ≥104°F today · 15 d/yr by 30 yrs out
- Wind 2/10 Low
- Air quality 2/10 Low 0 unhealthy d/yr today · 1 by 30 yrs out
Nearby sold comps map
Loading sold comps map…
Walkable amenities ~0.75 mi
Loading nearby amenities…
Taxation est. · year 1
- Rental income
- $17,994
- − Mortgage interest
- −$8,402
- − Property taxes
- −$2,316
- − Insurance
- −$750
- − Repairs & maintenance
- −$1,439
- − Management
- −$1,439
- − Depreciation
- −$4,364
- Taxable loss
- −$717
- Est. tax savings @ 24.0%
- +$172
- After-tax cash flow
- $1,882/yr
For passive investors: Depreciation is non-cash, so a rental often shows a tax loss while cash-flowing — sheltering income. Rental losses are passive: they offset passive income freely, and up to $25,000/yr can offset ordinary (W-2) income if you actively participate and your MAGI is under $100k (phasing out to $0 by $150k); unused losses carry forward. On sale, claimed depreciation is recaptured at up to 25%, and gains may owe capital-gains tax (a 1031 exchange can defer both). Figures are a year-1 estimate at your 24.0% rate — not tax advice; consult a CPA.
Schools (NCES district)
- District
- Omaha Public Schools
- NCES district ID
- 3174820
- Math proficiency
- 20% ▼ -10.00%
- Reading proficiency
- 28% ▼ -5.00%
- Median HH income
- $46,039
- Composite
- 20.83/100
- National rank
- #8502
- State rank
- #110 of 111 in NE
Livability — Omaha
- Score
- 84/100
- State rank
- #7
- US rank
- #663
Category grades
Schools grade is shown separately in the Schools card above.
Census & demographics
- Census place
- Omaha, NE
- County
- Douglas County · 538,646 people
- City population
- 552,986
- Metro
- Omaha-Council Bluffs, NE-IA
- Population (ZIP)
- 24,210
- Household income
- $42,185
- Rent vs Own
- Severe rent burden
- 1913.0
Population outlook (Douglas County) Hauer SSP2
- Today (2025)
- 625,245 people
- By 2030
- 661,613 · +5.8%
- By 2040
- 732,395 · +17.1%
- By 2050
- 801,988 · +28.3%
- By 2075
- 968,637 · +54.9%
- By 2100
- 1,101,871 · +76.2%
Race, ethnicity, and origin ACS 2023
- Neighborhood character
- Diverse neighborhood (Simpson 0.65)
- Race & ethnicity
- Black 52% Hispanic / Latino 21% White 17% Two or more races 15% Asian 3% Native American 1%
- Hispanic origin (detail)
- Mexican 14%
- Common ancestry
- Ukrainian 3% Lithuanian 0%
- Foreign-born
- 14% · Canada, Philippines
- Languages at home
- 75% English-only · Spanish 16% Other Asian/Pacific 3% French/Haitian/Cajun 1%
Political lean MEDSL · Douglas
- 2024 margin
- D (+10.2) · D 54.4% · R 44.2% · Other 1.4%
- 2008→2024 swing
- +5.5pp toward D · 2008: 4.6pp · 2024: 10.2pp
- All cycles
- 2024: D+10.2 2020: D+11.3 2016: D+1.4 2012: R+4.3 2008: D+4.6
Not yet ingested
- Civics
- —
Market trends
- HPI YoY
- ▲ 13.82%
- Current HPI
- 358.7174
- Rent YoY
- ▲ 3.22%
- Metro
- Omaha-Council Bluffs, NE-IA
- State GDP YoY
- ▲ 0.68%
- F500 in state
- 2
Industry mix (Fortune 500 HQ in NE)
| Industry | F500 HQs | Revenue |
|---|---|---|
| Conglomerate | 1 | $371B |
|
||
Price history
-96.9% since first listed17 events — show timeline
- 2026-05-02 Rental Removed $1,400 APPFOLIO
- 2026-04-16 Price Changed $1,400 APPFOLIO
- 2026-04-11 Listed for Rent $1,500 APPFOLIO
- 2026-03-23 Rental Removed $1,500 APPFOLIO
- 2026-03-23 Sold (MLS) $145,000 GPRMLS
- 2026-03-12 Listed for Rent $1,500 APPFOLIO
- 2026-02-27 Pending — GPRMLS
- 2026-01-04 Price Changed $149,999 ForSaleByOwner.com
- 2025-12-22 Listed $149,999 GPRMLS
- 2025-09-27 Listed $160,000 ForSaleByOwner.com
- 2021-07-23 Sold (MLS) $128,000 GPRMLS
- 2021-06-25 Pending — GPRMLS
- 2021-06-19 Listed $135,000 GPRMLS
- 2002-03-01 Sold (Public Records) $53,000 Public Records
- 2002-03-01 Sold (MLS) $52,500 GPRMLS
- 2002-02-13 Listing Removed — GPRMLS
- 2002-02-09 Listed $44,950 GPRMLS
Property tax history
+8.6%/yrLatest (2025): $2,316 · +1.3% YoY. Source: county tax records.
Cash-flow waterfall
monthlySold comps — $/sqft
last 12 mo · ≤1 miLoading sold comps…