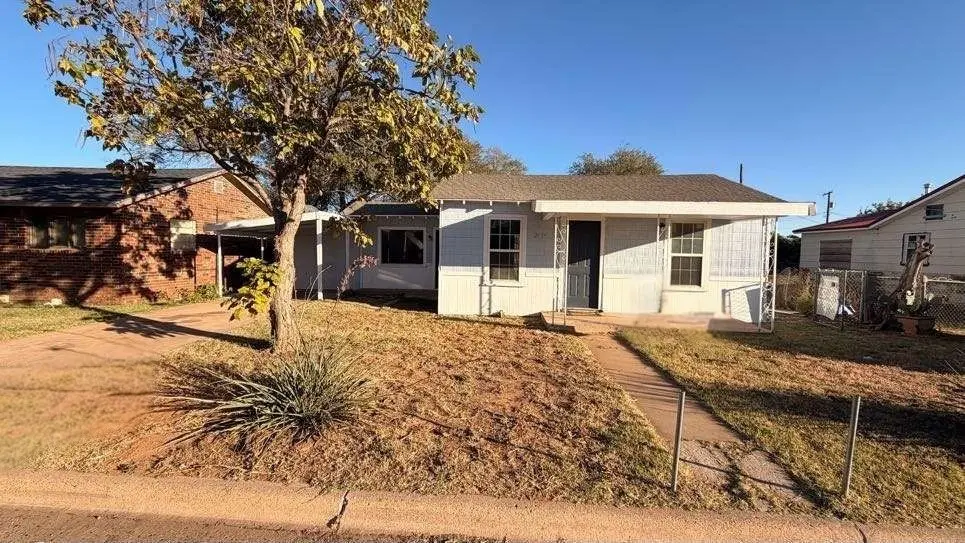
2414 Baylor St · Lubbock, TX
Flood risk 1/10 · Minimal
- FEMA flood zone
- X (shaded)
- Chance of flooding over 30 yrs
- 0.0%
- Est. flood insurance / yr
- $507 – $1,088
Fire risk 1/10 · Minimal
- Est. fire insurance / yr
- $1,222 – $2,270
Heat risk 5/10 · Moderate
- Hot days now (above 100°F)
- 7 days/yr
- Hot days in 30 yrs
- 21 days/yr
Wind risk 2/10 · Minimal
- Chance of severe wind over 30 yrs
- —
Air-quality risk 2/10 · Minimal
- Unhealthy air days now
- 1 days/yr
- Unhealthy air days in 30 yrs
- 1 days/yr
Risk factors via First Street. Map © Google.
Why this score? — see what drove the C grade
The composite is a weighted blend of 9 inputs, each scored 0–100. Each bar is that input's sub-score; the figure is the points it added to the 100-point composite (weight × sub-score).
- Cash flow +27.3/30.0
- DSCR +9.5/10.0
- 1% rule +6.9/10.0
- Livability +4.0/5.0
- Schools +3.1/10.0
- Rent growth +2.5/5.0
- Condition / age +2.5/5.0
- ARV discount +0.0/15.0
- Appreciation +0.0/10.0
$69,999
🖨 Deal sheet 📄 Offer letter ✓ Due diligence
Listing remarks MLS
JUST LISTED! This cozy 1-bedroom home sits on an expansive 8,100 sq ft lot offering plenty of space and potential. Comes with fresh paint, and an UPGRADED kitchen and bathroom. Enjoy being just minutes from Texas Tech University, Buddy Holly Center, and Mackenzie Park. With nearby access to historic landmarks, local dining, and shopping, this property offers a fantastic opportunity whether you're looking to invest or settle into the heart of Lubbock! WE MAKE IT EASY TO OWN. This is a great opportunity! Don't wait, call us today to get more information on the owner's easy terms and smooth process that may be able to put the deed in your name and make this your dream home.
Key facts
- Upgraded bathroom
- Upgraded kitchen
- Local shopping
Tags
Neighborhood map
What this means for you Summary
Snapshot
- This is a 2-bed/1.0-bath single-family listed at $70k.
Deal economics
- At list price, monthly cash flow is $202 ($2k/yr) — positive.
- The deal already cash-flows at list — no discount required.
- Meets the 1% rule at list price ($830 rent vs $70k).
- Recommended offer: $62k (12.0% below list) — sets the bar for market timing.
Location & tenants
- Location reads 80/100 on livability (#37 in TX, #1,749 nationally) — a professional / high-income tenant draw. Strengths: commute A+, cost of living A+, housing A+; Watch: employment C-, schools D+, crime F.
- Lubbock ISD (urban): math 36% / reading 39% proficiency, ranked #481 of 826 in TX (top 58%) — families likely to look elsewhere, expect single-tenant / working-renter base with shorter leases; 60% free/reduced lunch — lower-income household profile, screen leases tightly.
- Market conditions: 110 active listings in the ZIP; 36 comparable units currently listed for rent nearby; rentals at typical pace (median 21d on market — plan ~3-4 weeks tenant-placement turnaround); 47% of comp listings sitting > 30 days — soft ceiling on asking rent; lower-income renter base — watch delinquency; 2,219 units permitted in Lubbock County in 2024 (252 in 5+ unit buildings).
Forward outlook
- Local home prices are declining (-3.0%/yr); year-one equity from $484 of loan paydown is wiped out by about $2k of value loss. Plan a longer hold.
- Lubbock County population projected at +39% by 2050 — long-run rental-demand tailwind backs the buy-and-hold thesis.
- At projected returns (-3.0% appreciation + 3.0% rent growth), your $20k cash investment doubles in ~10 years — after that, you're playing with house money.
Negotiation context
- It's been on market 204 days — a 12% lower offer ($62k) is reasonable based on typical stale-listing flexibility.
- 2 sale attempts; this cycle's ask is 8661% above the opening price — seller raised mid-cycle; expect resistance to lowballs.
Risks & watch-outs
- Watch-outs: built in 1929 — expect roof / HVAC / electrical / plumbing capex.
- Climate carrying-cost: extreme-heat days projected 7→21/yr by 2055 (HVAC capex compounding) — expect insurance premiums to compound above CPI over the hold.
Questions for the listing agent
- It's been on market 204 days. Have you received any prior offers? Is the seller open to a 12% concession, seller financing, or rate buy-down credit?
- Built in 1929 — when were the roof, HVAC, electrical panel, plumbing, and water heater last replaced?
- Why hasn't it sold? Are there any deal-killer items the seller is aware of (foundation, flood, title, zoning, code violations)?
- Is there a deadline driving the sale (1031 exchange, divorce, estate, relocation)? That informs how much negotiation room exists.
- Schools are D-rated, which usually means shorter tenancies and higher turnover. Who's the typical renter profile here, and what's been the actual vacancy rate?
- Crime grade is F in this area — have there been break-ins, vandalism, or insurance claims at this property in the last 3 years? What carrier currently insures it and at what premium?
- What's the average days-on-market for RENTAL listings here right now (not sales)? A rising rental-DOM trend means longer vacancies and softer asking-rent achievability than the comps imply.
- What's the recent tenant-quality profile in this submarket — average credit score on applications, eviction rate, late-payment / NSF rate, and stable-employment percentage? A property-management company in the area should have these aggregated.
- How much new for-sale + rental construction is in the pipeline within 1–3 miles? Heavy new supply typically softens prices + rents 12–24 months out; constrained supply supports both.
Investment metrics
- 1% rule
- 1.19% ✓
- Cap rate
- 9.76%
- Cash-on-cash
- 12.37%
- DSCR
- 1.55
- GRM
- 7.0
CMA / ARV
- ARV (median comp)
- $49,078
- List price
- $69,999
- Delta
- 42.63%
- Verdict
- OVERPRICED
- Comps
- 1 within 2.0 mi
Projected returns pro-forma
-3.0% appreciation · 3.0% rent growth · sell at horizon
- IRR
- 2.0%
- Equity multiple
- 1.08×
- Total profit
- $1,518
- Equity at exit
- $10,437
- IRR
- 11.6%
- Equity multiple
- 1.91×
- Total profit
- $17,866
- Equity at exit
- $6,052
Cash invested: $19,600 (down + closing). Projections, not guarantees.
Landlord ↔ Tenant lean methodology
- Overall (STATE)
- 87 Strongly Landlord-Friendly
- State Texas
- 87 Strongly Landlord-Friendly · R+5
- County
- — inherits STATE
- City
- — inherits STATE
ZIP-level market 79415
- Home prices YoY
- -20.1%
- Active inventory
- 110
- Price-to-rent
- 7.0×
Monthly cashflow live
- Estimated rent
- $830 high interval (Pro) →
- Mortgage (P&I)
- −$367
- Tax from tax record
- −$57 /mo · $686/yr
- Insurance
- −$29
- HOA
- −$0
- Vacancy / Maint / Mgmt
- −$174
- Net cashflow
- $202
Break-even live
UW: 25.0% down · 7.5% · 30yr · 1.5% tax · 5.0% vac · 8.0% maint · 8.0% mgmt
Financing live
Cash to close
- Down payment
- $17,500
- Closing costs
- $2,100
- Reserves months
- —
- Total cash needed
- —
Loan-product check · same deal, 3 products live
Conventional
25% down · 7.5% · 30yr
- Down + closing
- —
- Monthly P&I
- —
- Monthly cashflow
- —
- DSCR
- —
- Eligible?
- —
Personal DTI + credit; lowest rate.
DSCR
20% down · 8.5% · 30yr
- Down + closing
- —
- Monthly P&I
- —
- Monthly cashflow
- —
- DSCR
- —
- Eligible?
- —
No personal income docs; deal must DSCR.
Hard money
10% down · 12.0% · 12mo
- Down + closing
- —
- Monthly P&I
- —
- Monthly cashflow
- —
- DSCR
- —
- Eligible?
- —
Short-term bridge; refi at stabilization.
Rent comps 36 comps
| Address | Beds | Baths | Sqft | Rent | $/sqft | DOM | Units | Dist |
|---|---|---|---|---|---|---|---|---|
| 2512 1st St Lubbock, TX | 2.0 | 1.0 | 1050 | $900 | $0.86 | 13d | 1 | 0.30mi |
| 2613 Auburn St Lubbock, TX | 2.0 | 1.0 | 978 | $875 | $0.89 | 43d | 1 | 0.33mi |
| 114 Avenue V Lubbock, TX | 2.0 | 1.0 | 728 | $750 | $1.03 | 43d | 1 | 0.44mi |
| 105 North Avenue U Unit U Lubbock, TX | 2.0 | 1.0 | 672 | $750 | $1.12 | 43d | 1 | 0.47mi |
| 2715 Fordham St Unit 7 Lubbock, TX | 2.0 | 2.0 | 1100 | $1,150 | $1.05 | 43d | 1 | 0.58mi |
| 124 Temple Ave Lubbock, TX | 1.0 | 1.0 | 600 | $600 | $1.00 | 21d | 1 | 0.61mi |
| 124 Temple Ave Lubbock, TX | 1.0 | 1.0 | 600 | $650 | $1.08 | 43d | 1 | 0.61mi |
| 2805 1st Pl Lubbock, TX | 2.0 | 1.0 | 730 | $895 | $1.23 | 21d | 1 | 0.61mi |
| 2906 Cornell St Lubbock, TX | 2.0 | 1.0 | 920 | $875 | $0.95 | 13d | 1 | 0.61mi |
| 2814 1st Pl Lubbock, TX | 2.0 | 1.0 | 676 | $695 | $1.03 | 43d | 1 | 0.63mi |
| 2814 1st Pl Lubbock, TX | 2.0 | 1.0 | 676 | $695 | $1.03 | 21d | 1 | 0.63mi |
| 218 Avenue U Unit A Lubbock, TX | 1.0 | 1.0 | 665 | $525 | $0.79 | 13d | 1 | 0.63mi |
| 2803 2nd St Lubbock, TX | 2.0 | 1.0 | 784 | $800 | $1.02 | 43d | 1 | 0.64mi |
| 301 Avenue U Lubbock, TX | 1.0–2.0 | 1.0 | 625 | $875 | $1.40 | 13d | 4 | 0.70mi |
| 226 S AVE Unit C Lubbock, TX | 1.0 | 1.0 | 665 | $525 | $0.79 | 43d | 1 | 0.83mi |
| 3207 Amherst St Lubbock, TX | 3.0 | 1.0 | 1020 | $1,200 | $1.18 | 43d | 1 | 0.91mi |
| 3207 Duke St Lubbock, TX | 2.0 | 1.0 | 647 | $695 | $1.07 | 43d | 1 | 0.93mi |
| 3207 Duke St Lubbock, TX | 2.0 | 1.0 | 647 | $595 | $0.92 | 21d | 1 | 0.93mi |
| 3315 Amherst St Lubbock, TX | 2.0 | 1.0 | 950 | $875 | $0.92 | 21d | 1 | 1.07mi |
| 3307 Erskine St Lubbock, TX | 3.0 | 1.0 | 1120 | $1,000 | $0.89 | 21d | 1 | 1.08mi |
| 3318 Itasca St Lubbock, TX | 3.0 | 1.5 | 1068 | $950 | $0.89 | 13d | 1 | 1.21mi |
| 701 N Indiana Ave Lubbock, TX | 1.0–2.0 | 1.0–2.0 | 675 | $850 | $1.26 | 21d | 1 | 1.23mi |
| 1710 9th St Unit 29 Lubbock, TX | 2.0 | 1.0 | 700 | $1,000 | $1.43 | 13d | 1 | 1.24mi |
| 2007 Main St Lubbock, TX | 1.0 | 1.5 | 900 | $1,000 | $1.11 | 13d | 7 | 1.26mi |
| 2007 Main St Unit 12 Lubbock, TX | 1.0 | 1.5 | 900 | $1,000 | $1.11 | 21d | 1 | 1.26mi |
| 2007 Main St Unit 22 Lubbock, TX | 1.0 | 1.5 | 900 | $1,000 | $1.11 | 43d | 1 | 1.26mi |
| 2315 13th St Lubbock, TX | 2.0 | 1.0 | 825 | $995 | $1.21 | 43d | 1 | 1.30mi |
| 2324 14th St Unit Rear B Lubbock, TX | 1.0 | 1.0 | 568 | $575 | $1.01 | 43d | 1 | 1.33mi |
| 2316 15th St Lubbock, TX | 2.0 | 1.0 | 960 | $795 | $0.83 | 21d | 1 | 1.39mi |
| 2117 14th St Unit A Lubbock, TX | 2.0 | 2.0 | 980 | $1,250 | $1.28 | 21d | 1 | 1.39mi |
| 2202 15th St Unit 5 Lubbock, TX | 1.0 | 1.0 | 600 | $600 | $1.00 | 43d | 1 | 1.41mi |
| 2101 14th St Lubbock, TX | 2.0 | 1.0 | 895 | $850 | $0.95 | 21d | 1 | 1.41mi |
| 2101 14th St Lubbock, TX | 2.0 | 1.0 | 895 | $850 | $0.95 | 43d | 1 | 1.41mi |
| 2317 15th St Lubbock, TX | 2.0 | 1.0 | 900 | $1,000 | $1.11 | 43d | 1 | 1.42mi |
| 1913 13th St Unit REAR Lubbock, TX | 1.0 | 1.0 | 743 | $700 | $0.94 | 43d | 1 | 1.42mi |
| 2117 15th St Unit C Lubbock, TX | 1.0 | 1.0 | 600 | $575 | $0.96 | 21d | 1 | 1.45mi |
Listing history 20 events
-
2026-06-18days on market $69,999 Active 204 DOM
-
2026-06-17days on market $69,999 Active 203 DOM
-
2026-06-16days on market $69,999 Active 202 DOM
-
2026-06-15days on market $69,999 Active 201 DOM
-
2026-06-14days on market $69,999 Active 199 DOM
-
2026-06-13days on market $69,999 Active 198 DOM
-
2026-06-10days on market $69,999 Active 196 DOM
-
2026-06-09days on market $69,999 Active 195 DOM
-
2026-06-08days on market $69,999 Active 194 DOM
-
2026-06-07days on market $69,999 Active 193 DOM
-
2026-06-05days on market $69,999 Active 190 DOM
-
2026-06-03days on market $69,999 Active 189 DOM
-
2026-06-02days on market $69,999 Active 188 DOM
-
2026-06-01days on market $69,999 Active 187 DOM
-
2026-05-31days on market $69,999 Active 186 DOM
-
2026-05-30days on market $69,999 Active 185 DOM
-
2025-11-27$799
-
2025-11-26$69,999 Active 679-char remark
Show marketing remark (679 chars)
JUST LISTED! This cozy 1-bedroom home sits on an expansive 8,100 sq ft lot offering plenty of space and potential. Comes with fresh paint, and an UPGRADED kitchen and bathroom. Enjoy being just minutes from Texas Tech University, Buddy Holly Center, and Mackenzie Park. With nearby access to historic landmarks, local dining, and shopping, this property offers a fantastic opportunity whether you're looking to invest or settle into the heart of Lubbock! WE MAKE IT EASY TO OWN. This is a great opportunity! Don't wait, call us today to get more information on the owner's easy terms and smooth process that may be able to put the deed in your name and make this your dream home.
-
2016-02-05soldstatus
-
2014-09-26soldstatus
ⓘ Source: listings_history table (triggers on properties + properties_extension) + one-shot
backfill from property_details.listing_events for pre-trigger history.
Tax reassessment forecast TX · Resets to sale price
- Current annual tax
- $686 · $57/mo
- Projected year-2 tax
- $1,281 · $107/mo
- Expected delta
- +$595/yr (+$50/mo · 86.7%)
ⓘ Screening estimate from a state-policy table — verify with the county assessor before closing.
Climate risk First Street
- Flood 1/10 Low FEMA zone X (shaded) · 0% chance over 30 yrs
- Wildfire 1/10 Low
- Heat 5/10 Major 7 d/yr ≥100°F today · 21 d/yr by 30 yrs out
- Wind 2/10 Low
- Air quality 2/10 Low 1 unhealthy d/yr today · 1 by 30 yrs out
Nearby sold comps map
Loading sold comps map…
Walkable amenities ~0.75 mi
Loading nearby amenities…
Taxation est. · year 1
- Rental income
- $9,956
- − Mortgage interest
- −$3,921
- − Property taxes
- −$686
- − Insurance
- −$350
- − Repairs & maintenance
- −$797
- − Management
- −$797
- − Depreciation
- −$2,036
- Taxable income
- $1,370
- Est. tax owed @ 24.0%
- −$329
- After-tax cash flow
- $2,096/yr
For passive investors: Depreciation is non-cash, so a rental often shows a tax loss while cash-flowing — sheltering income. Rental losses are passive: they offset passive income freely, and up to $25,000/yr can offset ordinary (W-2) income if you actively participate and your MAGI is under $100k (phasing out to $0 by $150k); unused losses carry forward. On sale, claimed depreciation is recaptured at up to 25%, and gains may owe capital-gains tax (a 1031 exchange can defer both). Figures are a year-1 estimate at your 24.0% rate — not tax advice; consult a CPA.
Schools (NCES district)
- District
- Lubbock ISD
- NCES district ID
- 4828500
- Math proficiency
- 36% ▼ -8.00%
- Reading proficiency
- 39% ▼ -1.00%
- Median HH income
- $39,820
- Composite
- 31.44/100
- National rank
- #5984
- State rank
- #481 of 826 in TX
Livability — Lubbock
- Score
- 80/100
- State rank
- #37
- US rank
- #1749
Category grades
Schools grade is shown separately in the Schools card above.
Census & demographics
- Census place
- Lubbock, TX
- County
- Lubbock County · 293,542 people
- City population
- 283,030
- Metro
- Lubbock, TX
- Population (ZIP)
- 15,794
- Household income
- $36,468
- Rent vs Own
- Severe rent burden
- 1287.0
Population outlook (Lubbock County) Hauer SSP2
- Today (2025)
- 345,960 people
- By 2030
- 371,449 · +7.4%
- By 2040
- 424,539 · +22.7%
- By 2050
- 481,150 · +39.1%
- By 2075
- 633,467 · +83.1%
- By 2100
- 746,853 · +115.9%
Race, ethnicity, and origin ACS 2023
- Neighborhood character
- Diverse neighborhood (Simpson 0.58)
- Race & ethnicity
- Hispanic / Latino 59% White 26% Two or more races 19% Black 7% Asian 5%
- Hispanic origin (detail)
- Mexican 49%
- Common ancestry
- Italian 1% Serbian 1% Estonian 1%
- Foreign-born
- 15% · Canada, China
- Languages at home
- 57% English-only · Spanish 36% Other Indo-European 4% Arabic 1%
Political lean MEDSL · Lubbock
- 2024 margin
- Solid R (+39.5) · D 29.7% · R 69.2% · Other 1.0%
- 2008→2024 swing
- -2.8pp toward R · 2008: -36.7pp · 2024: -39.5pp
- All cycles
- 2024: R+39.5 2020: R+32.2 2016: R+38.4 2012: R+40.9 2008: R+36.7
Not yet ingested
- Civics
- —
Market trends
- HPI YoY
- ▼ -41.79%
- Current HPI
- 165.7933
- Rent YoY
- —
- Metro
- Lubbock, TX
- State GDP YoY
- ▲ 3.95%
- F500 in state
- 110
Industry mix (Fortune 500 HQ in TX)
| Industry | F500 HQs | Revenue |
|---|---|---|
| Energy | 16 | $1,198B |
|
||
| Technology | 5 | $198B |
|
||
| Engineering / Construction | 4 | $72B |
|
||
| Energy Services | 3 | $60B |
|
||
| Utilities | 3 | $41B |
|
||
| Healthcare | 2 | $330B |
|
||
Price history
4 events — show timeline
- 2025-11-27 Listed for Rent $799 HARMLS
- 2025-11-26 Listed $69,999 HARMLS
- 2016-02-05 Sold (Public Records) — Public Records
- 2014-09-26 Sold (Public Records) — Public Records
Property tax history
+4.4%/yrLatest (2025): $686 · +10.6% YoY. Source: county tax records.
Cash-flow waterfall
monthlySold comps — $/sqft
last 12 mo · ≤1 miLoading sold comps…