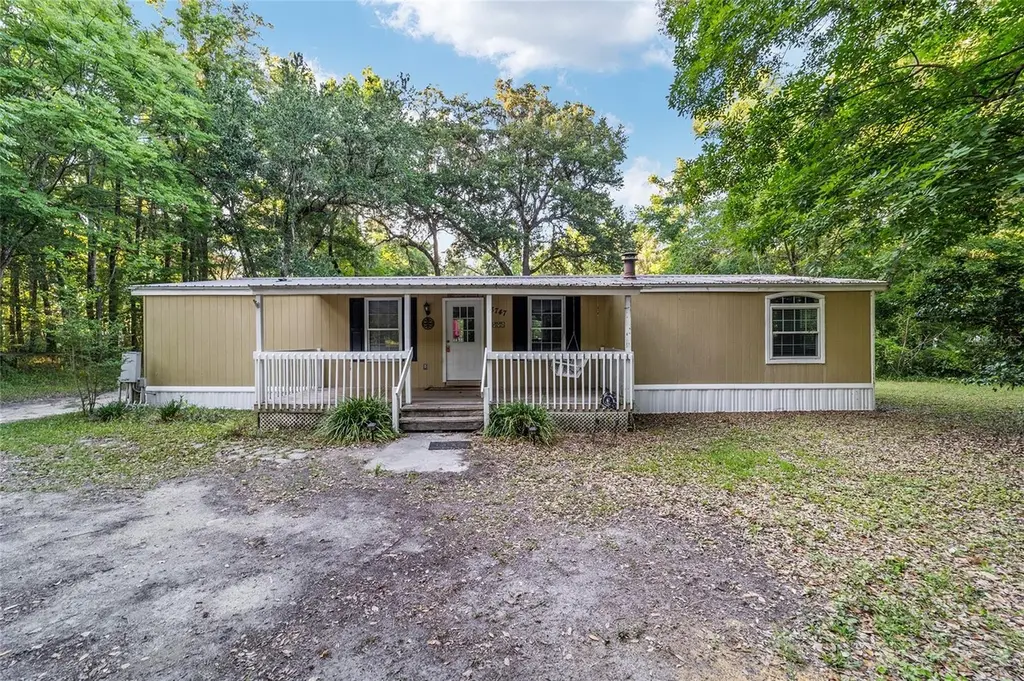
3747 SE 126th Pl · Belleview, FL
Flood risk 1/10 · Minimal
- FEMA flood zone
- X (unshaded)
- Chance of flooding over 30 yrs
- 0.0%
- Est. flood insurance / yr
- $507 – $1,088
Fire risk 6/10 · Moderate
- Est. fire insurance / yr
- $947 – $1,759
Heat risk 8/10 · Major
- Hot days now (above 108°F)
- 6 days/yr
- Hot days in 30 yrs
- 18 days/yr
Wind risk 9/10 · Severe
- Chance of severe wind over 30 yrs
- 99.0%
Air-quality risk 3/10 · Minor
- Unhealthy air days now
- 3 days/yr
- Unhealthy air days in 30 yrs
- 4 days/yr
Risk factors via First Street. Map © Google.
Why this score? — see what drove the D grade
The composite is a weighted blend of 9 inputs, each scored 0–100. Each bar is that input's sub-score; the figure is the points it added to the 100-point composite (weight × sub-score).
- Cash flow +13.8/30.0
- ARV discount +7.5/15.0
- DSCR +4.2/10.0
- Schools +3.6/10.0
- Livability +3.5/5.0
- 1% rule +2.8/10.0
- Rent growth +2.5/5.0
- Condition / age +2.5/5.0
- Appreciation +0.0/10.0
$224,900
🖨 Deal sheet (PDF) 📄 Offer letter ✓ Due diligence
Listing remarks MLS
BEAUTIFUL PROPERTY W/ CLEARED & SOME AREA WITH TREES. EXISTING HOME REQUIRES A NUMBER OF REPAIRS, IF YOU HAVE THE TIME & INCLINATION. IT'S A ''FIXER UPPER''. IF NOT, HAVE THE DW REMOVED AND YOU HAVE A GREAT BUILDABLE SITE. ENJOY THE PRIVACY OF THE 2.4 ACRES. WELL & SEPTIC NEW WITHIN THE LAST 6 OR 7 YRS.
Key facts
- Custom workshop
- Extra storage shed
- Detached workshop
Tags
Property features AI
Exterior
- Utilities: Well water; Septic system; Electricity connected
- Home design: Manufactured double-wide home; Single-story; Faces southeast; Entry level: 1
- Construction: Wood siding; Metal roof; Crawlspace foundation; Built as a manufactured home
- Exterior features: Dirt road access; 2.41-acre lot (approximately 166 x 633)
Interior
- Kitchen: Dishwasher; Microwave; Range; Refrigerator
- Bedrooms: 3 bedrooms
- Flooring: Carpet
- Bathrooms: 2 full bathrooms
- Heating & cooling: Central heating; Central air conditioning
- Interior features: Ceiling fans; Wood-burning fireplace
- Laundry & utility: Washer hookup; Electric dryer hookup
Neighborhood map
What this means for you Summary
Snapshot
- This is a 3-bed/2.0-bath manufactured listed at $225k.
Deal economics
- At list price, monthly cash flow is $22 ($259/yr) — positive.
- The deal already cash-flows at list — no discount required.
- To meet the 1% rule (rent ≥ 1% of price), the offer needs to be $174k (22.4% below list).
- Recommended offer: $174k (22.4% below list) — sets the bar for 1% rule.
- Cap rate 6.4% vs local median 4.5% in Belleview — top-decile yield for the area; either an underpriced asset or a hidden risk that comps aren't pricing in. Stress-test before assuming the spread holds.
Location & tenants
- Location reads 69/100 on livability (#458 in FL) — a middle-class / working-renter tenant base. Strengths: cost of living A+, housing A+, health & safety A+; Watch: crime F, amenities F, commute F.
- Marion (rural): math 42% / reading 43% proficiency, ranked #61 of 73 in FL (top 84%) — families likely to look elsewhere, expect single-tenant / working-renter base with shorter leases; 61% free/reduced lunch — lower-income household profile, screen leases tightly.
- Zoned schools: Belleview-Santos Elementary School (math 41% / reading 41%, grade F, #1,454 of 2,144 statewide, top 69%, 570 students, 66% FRL); Belleview Middle School (math 49% / reading 50%, grade C, #259 of 571 statewide, top 46%, 1,573 students, 60% FRL); Belleview High School (math 31% / reading 46%, grade F, #321 of 667 statewide, top 49%, 1,783 students, 56% FRL) — zoned schools at 61% FRL track the district average.
- Market conditions: 362 active listings in the ZIP; 2 comparable units currently listed for rent nearby; 7,071 units permitted in Marion County in 2024 (534 in 5+ unit buildings).
Forward outlook
- Local home prices are declining (-3.0%/yr); year-one equity from $2k of loan paydown is wiped out by about $7k of value loss. Plan a longer hold.
- Marion County population projected at +13% by 2050 — modest demand growth; plan on rents tracking national, not racing it.
Negotiation context
- It's been on market 37 days — a 3% lower offer ($218k) is reasonable based on typical stale-listing flexibility.
- 5 sale attempts since 17y ago with the ask held roughly flat each time — persistent listings suggest the price (not the market) is what's stuck; bring a comps-based counter.
Risks & watch-outs
- Climate carrying-cost: severe wind risk, 99% chance of damaging wind over 30y; major wildfire risk; extreme-heat days projected 6→18/yr by 2055 (HVAC capex compounding) — expect insurance premiums to compound above CPI over the hold.
Questions for the listing agent
- It's been on market 37 days. Have you received any prior offers? Is the seller open to a 22% concession, seller financing, or rate buy-down credit?
- Is there a deadline driving the sale (1031 exchange, divorce, estate, relocation)? That informs how much negotiation room exists.
- Schools are D-rated, which usually means shorter tenancies and higher turnover. Who's the typical renter profile here, and what's been the actual vacancy rate?
- Crime grade is F in this area — have there been break-ins, vandalism, or insurance claims at this property in the last 3 years? What carrier currently insures it and at what premium?
- The area grade is low — what's the realistic commute time and amenity access for the typical tenant pool here? Any planned neighborhood developments (good or bad) we should know about?
- What's the average days-on-market for RENTAL listings here right now (not sales)? A rising rental-DOM trend means longer vacancies and softer asking-rent achievability than the comps imply.
- What's the recent tenant-quality profile in this submarket — average credit score on applications, eviction rate, late-payment / NSF rate, and stable-employment percentage? A property-management company in the area should have these aggregated.
- How much new for-sale + rental construction is in the pipeline within 1–3 miles? Heavy new supply typically softens prices + rents 12–24 months out; constrained supply supports both.
Investment metrics
- 1% rule
- 0.78% ✗
- Cap rate
- 6.41%
- Cash-on-cash
- 0.41%
- DSCR
- 1.02
- GRM
- 10.7
CMA / ARV
No comps found within radius.
Projected returns pro-forma
-3.0% appreciation · 3.0% rent growth · sell at horizon
- IRR
- -15.7%
- Equity multiple
- 0.44×
- Total profit
- $-35,166
- Equity at exit
- $33,533
- IRR
- -7.3%
- Equity multiple
- 0.54×
- Total profit
- $-29,240
- Equity at exit
- $19,445
Cash invested: $62,972 (down + closing). Projections, not guarantees.
Landlord ↔ Tenant lean methodology
- Overall (STATE)
- 87 Strongly Landlord-Friendly
- State Florida
- 87 Strongly Landlord-Friendly · R+3
- County
- — inherits STATE
- City
- — inherits STATE
ZIP-level market 34420
- Home prices YoY
- -32.8%
- Active inventory
- 362
- Price-to-rent
- 10.7×
Monthly cashflow live
- Estimated rent
- $1,745 medium interval (Pro) →
- Mortgage (P&I)
- −$1,179
- Tax from tax record
- −$84 /mo · $1,007/yr
- Insurance
- −$94
- HOA
- −$0
- Vacancy / Maint / Mgmt
- −$366
- Net cashflow
- $22
Break-even live
Sensitivity live
| Price | -10% $149 | -5% $85 | +0% $22 | +5% $-42 | +10% $-106 |
|---|---|---|---|---|---|
| Rent | -10% $-116 | -5% $-47 | +0% $22 | +5% $90 | +10% $159 |
| Rate | -1.0pp $135 | -0.5pp $79 | base $22 | +0.5pp $-37 | +1.0pp $-96 |
UW: 25.0% down · 7.5% · 30yr · 1.5% tax · 5.0% vac · 8.0% maint · 8.0% mgmt
Financing live
Cash to close
- Down payment
- $56,225
- Closing costs
- $6,747
- Reserves months
- —
- Total cash needed
- —
Loan-product check · same deal, 3 products live
Conventional
25% down · 7.5% · 30yr
- Down + closing
- —
- Monthly P&I
- —
- Monthly cashflow
- —
- DSCR
- —
- Eligible?
- —
Personal DTI + credit; lowest rate.
DSCR
20% down · 8.5% · 30yr
- Down + closing
- —
- Monthly P&I
- —
- Monthly cashflow
- —
- DSCR
- —
- Eligible?
- —
No personal income docs; deal must DSCR.
Hard money
10% down · 12.0% · 12mo
- Down + closing
- —
- Monthly P&I
- —
- Monthly cashflow
- —
- DSCR
- —
- Eligible?
- —
Short-term bridge; refi at stabilization.
Rent comps 2 comps
| Address | Beds | Baths | Sqft | Rent | $/sqft | DOM | Units | Dist |
|---|---|---|---|---|---|---|---|---|
| 3820 SE 136th Pl Summerfield, FL | 3.0 | 2.0 | 1265 | $1,745 | $1.38 | 22d | 1 | 1.11mi |
| 3384 SE 138th St Summerfield, FL | 3.0 | 2.0 | 1265 | $1,745 | $1.38 | 22d | 1 | 1.32mi |
Listing history 28 events
-
2026-06-21days on market $224,900 Active 37 DOM
-
2026-06-18days on market $224,900 Active 34 DOM
-
2026-06-17days on market $224,900 Active 33 DOM
-
2026-06-16days on market $224,900 Active 32 DOM
-
2026-06-15days on market $224,900 Active 31 DOM
-
2026-06-14days on market $224,900 Active 29 DOM
-
2026-06-13days on market $224,900 Active 28 DOM
-
2026-06-10days on market $224,900 Active 26 DOM
-
2026-06-09days on market $224,900 Active 25 DOM
-
2026-06-08days on market $224,900 Active 24 DOM
-
2026-06-07days on market $224,900 Active 23 DOM
-
2026-06-03days on market $224,900 Active 19 DOM
-
2026-06-02days on market $224,900 Active 18 DOM
-
2026-06-01days on market $224,900 Active 17 DOM
-
2026-05-31days on market $224,900 Active 16 DOM
-
2026-05-30days on market $224,900 Active 15 DOM
-
2026-05-17status Active
-
2026-05-11status Pending
-
2026-05-09$224,900 Active
-
2025-09-03soldstatus $210,000
-
2010-08-02soldstatus $52,000
-
2010-07-30soldstatus $52,000 322-char remark
Show marketing remark (322 chars)
BEAUTIFUL PROPERTY W/ CLEARED & SOME AREA WITH TREES. EXISTING HOME REQUIRES A NUMBER OF REPAIRS, IF YOU HAVE THE TIME & INCLINATION. IT'S A ''FIXER UPPER''. IF NOT, HAVE THE DW REMOVED AND YOU HAVE A GREAT BUILDABLE SITE. ENJOY THE PRIVACY OF THE 2.4 ACRES. WELL & SEPTIC NEW WITHIN THE LAST 6 OR 7 YRS.
-
2010-06-14$54,900 322-char remark
Show marketing remark (322 chars)
BEAUTIFUL PROPERTY W/ CLEARED & SOME AREA WITH TREES. EXISTING HOME REQUIRES A NUMBER OF REPAIRS, IF YOU HAVE THE TIME & INCLINATION. IT'S A ''FIXER UPPER''. IF NOT, HAVE THE DW REMOVED AND YOU HAVE A GREAT BUILDABLE SITE. ENJOY THE PRIVACY OF THE 2.4 ACRES. WELL & SEPTIC NEW WITHIN THE LAST 6 OR 7 YRS.
-
2010-05-31historical
-
2010-05-31historical
-
2009-11-27$54,900
-
2009-11-27$54,900
-
1995-02-22soldstatus $14,900
ⓘ Source: listings_history table (triggers on properties + properties_extension) + one-shot
backfill from property_details.listing_events for pre-trigger history.
Tax reassessment forecast FL · Resets to sale price
- Current annual tax
- $1,007 · $84/mo
- Projected year-2 tax
- $1,867 · $156/mo
- Expected delta
- +$860/yr (+$72/mo · 85.4%)
ⓘ Screening estimate from a state-policy table — verify with the county assessor before closing.
Climate risk First Street
- Flood 1/10 Low FEMA zone X (unshaded) · 0% chance over 30 yrs
- Wildfire 6/10 Major
- Heat 8/10 Severe 6 d/yr ≥108°F today · 18 d/yr by 30 yrs out
- Wind 9/10 Extreme 99% chance of damaging wind over 30 yrs
- Air quality 3/10 Moderate 3 unhealthy d/yr today · 4 by 30 yrs out
Nearby sold comps map
Loading sold comps map…
Walkable amenities ~0.75 mi
Loading nearby amenities…
Taxation est. · year 1
- Rental income
- $20,940
- − Mortgage interest
- −$12,598
- − Property taxes
- −$1,007
- − Insurance
- −$1,124
- − Repairs & maintenance
- −$1,675
- − Management
- −$1,675
- − Depreciation
- −$6,543
- Taxable loss
- −$3,682
- Est. tax savings @ 24.0%
- +$884
- After-tax cash flow
- $1,142/yr
For passive investors: Depreciation is non-cash, so a rental often shows a tax loss while cash-flowing — sheltering income. Rental losses are passive: they offset passive income freely, and up to $25,000/yr can offset ordinary (W-2) income if you actively participate and your MAGI is under $100k (phasing out to $0 by $150k); unused losses carry forward. On sale, claimed depreciation is recaptured at up to 25%, and gains may owe capital-gains tax (a 1031 exchange can defer both). Figures are a year-1 estimate at your 24.0% rate — not tax advice; consult a CPA.
Schools (NCES district)
- District
- Marion
- NCES district ID
- 1201260
- Math proficiency
- 42% ▼ -7.00%
- Reading proficiency
- 43% ▼ -4.00%
- Median HH income
- $40,015
- Composite
- 35.61/100
- National rank
- #4890
- State rank
- #61 of 73 in FL
Livability — Belleview
- Score
- 69/100
- State rank
- #458
- US rank
- #8314
Category grades
Schools grade is shown separately in the Schools card above.
Census & demographics
- City population
- 19,167
- Population (ZIP)
- 19,167
Population outlook (Marion County) Hauer SSP2
- Today (2025)
- 365,905 people
- By 2030
- 376,768 · +3.0%
- By 2040
- 396,555 · +8.4%
- By 2050
- 412,723 · +12.8%
- By 2075
- 446,090 · +21.9%
- By 2100
- 436,193 · +19.2%
Race, ethnicity, and origin ACS 2023
- Neighborhood character
- Predominantly White (81%)
- Race & ethnicity
- White 81% Hispanic / Latino 12% Two or more races 10% Black 1%
- Hispanic origin (detail)
- Puerto Rican 7% Cuban 2%
- Common ancestry
- Lithuanian 4% Iranian 2% Romanian 2%
- Foreign-born
- 5% · Canada, Jamaica
- Languages at home
- 89% English-only · Spanish 7% Other Indo-European 2% German/W. Germanic 1%
Political lean MEDSL · Marion
- 2024 margin
- Solid R (+31.6) · D 33.8% · R 65.5%
- 2008→2024 swing
- -20.0pp toward R · 2008: -11.6pp · 2024: -31.6pp
- All cycles
- 2024: R+31.6 2020: R+25.9 2016: R+26.2 2012: R+16.2 2008: R+11.6
Not yet ingested
- Civics
- —
Market trends
- HPI YoY
- ▼ -120.90%
- Current HPI
- 247.3176
- Rent YoY
- —
- Metro
- —
- State GDP YoY
- ▲ 3.28%
- F500 in state
- 36
Industry mix (Fortune 500 HQ in FL)
| Industry | F500 HQs | Revenue |
|---|---|---|
| Industrial Technology | 2 | $29B |
|
||
| Insurance | 2 | $17B |
|
||
| Retail | 1 | $60B |
|
||
| Technology Distribution | 1 | $58B |
|
||
| Homebuilding | 1 | $35B |
|
||
| Technology Manufacturing | 1 | $35B |
|
||
Price history
+1409.4% since first listed12 events — show timeline
- 2026-05-17 Relisted — Stellar MLS as Distributed by MLS Grid
- 2026-05-11 Pending — Stellar MLS as Distributed by MLS Grid
- 2026-05-09 Listed $224,900 Stellar MLS as Distributed by MLS Grid
- 2025-09-03 Sold (Public Records) $210,000 Public Records
- 2010-08-02 Sold (Public Records) $52,000 Public Records
- 2010-07-30 Sold (MLS) $52,000 Stellar MLS as Distributed by MLS Grid
- 2010-06-14 Listed $54,900 Stellar MLS as Distributed by MLS Grid
- 2010-05-31 Listing Removed — Stellar MLS as Distributed by MLS Grid
- 2010-05-31 Listing Removed — Stellar MLS as Distributed by MLS Grid
- 2009-11-27 Listed $54,900 Stellar MLS as Distributed by MLS Grid
- 2009-11-27 Listed $54,900 Stellar MLS as Distributed by MLS Grid
- 1995-02-22 Sold (Public Records) $14,900 Public Records
Property tax history
+5.3%/yrLatest (2025): $1,007 · +27.4% YoY. Source: county tax records.
Cash-flow waterfall
monthlySold comps — $/sqft
last 12 mo · ≤1 miLoading sold comps…