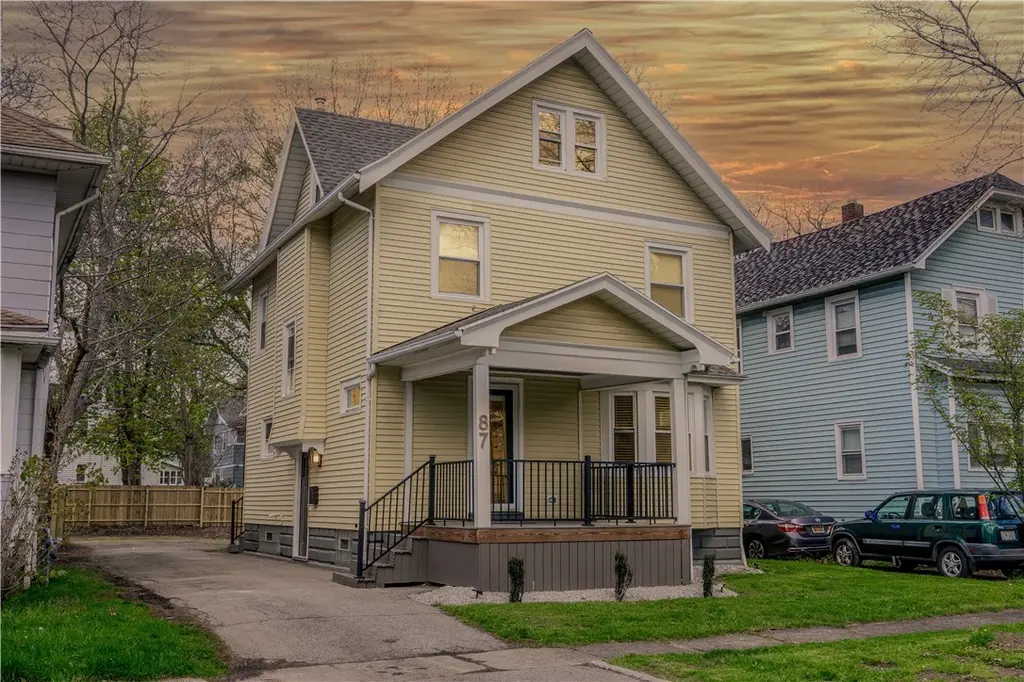
87 Paige St · Rochester, NY
Flood risk 5/10 · Moderate
- FEMA flood zone
- X (unshaded)
- Chance of flooding over 30 yrs
- 0.48%
- Est. flood insurance / yr
- $473 – $860
Fire risk 1/10 · Minimal
- Est. fire insurance / yr
- $691 – $1,283
Heat risk 2/10 · Minimal
- Hot days now (above 96°F)
- 7 days/yr
- Hot days in 30 yrs
- 15 days/yr
Wind risk 1/10 · Minimal
- Chance of severe wind over 30 yrs
- —
Air-quality risk 2/10 · Minimal
- Unhealthy air days now
- 1 days/yr
- Unhealthy air days in 30 yrs
- 1 days/yr
Risk factors via First Street. Map © Google.
Why this score? — see what drove the C+ grade
The composite is a weighted blend of 9 inputs, each scored 0–100. Each bar is that input's sub-score; the figure is the points it added to the 100-point composite (weight × sub-score).
- Cash flow +25.7/30.0
- ARV discount +13.5/15.0
- DSCR +8.6/10.0
- 1% rule +6.0/10.0
- Livability +3.8/5.0
- Rent growth +2.5/5.0
- Condition / age +2.5/5.0
- Schools +1.9/10.0
- Appreciation +0.0/10.0
$169,900
🖨 Deal sheet 📄 Offer letter ✓ Due diligence
Listing remarks
* * Stunning Remodeled Single-Family Home in Prime Location * * Welcome to your dream home nestled on a tranquil street! This beautifully remodeled single-family residence boasts four spacious bedrooms and two full bathrooms, making it perfect for families or those seeking extra space. Step inside to discover a grand foyer leading to a bright and inviting living room, ideal for entertaining. The dining room flows seamlessly into a stunning, fully remodeled kitchen, featuring elegant quartz countertops, brand-new cabinets, and modern light fixtures. The first floor showcases soaring 9-foot ceilings and fresh paint and flooring throughout, creating an airy and welcoming atmosphere. Vent
Key facts
- Finished third floor
- Charming front porch
- Remodeled kitchen
Tags
Property features AI
Exterior
- Parking: No garage
- Utilities: Public water connected; Sewer connected
- Home design: Two-story property; Existing/resale condition
- Construction: Aluminum siding; Vinyl siding; Block foundation
- Exterior features: Blacktop driveway; Rectangular residential lot; City street frontage; Lot dimensions approximately 40 x 132
Interior
- Kitchen: Dishwasher; Electric oven; Electric range; Microwave; Refrigerator; Quartz counters
- Bedrooms: Total rooms: 9 (includes living spaces and bedrooms)
- Flooring: Carpet; Hardwood; Luxury vinyl; Varied flooring types
- Bathrooms: 2 full bathrooms
- Heating & cooling: Gas heating; Forced air
- Interior features: Attic; Entrance foyer; Quartz counters
- Laundry & utility: Gas water heater
Neighborhood map
What this means for you Summary
Snapshot
- This is a 4-bed/1.0-bath single-family listed at $170k.
Deal economics
- At list price, monthly cash flow is $409 ($5k/yr) — positive.
- The deal already cash-flows at list — no discount required.
- Meets the 1% rule at list price ($2k rent vs $170k).
Location & tenants
- Location reads 76/100 on livability (#222 in NY, #3,482 nationally) — a middle-class / working-renter tenant base. Strengths: commute A+, cost of living A+, housing A+; Watch: schools D+, crime F, employment F.
- Rochester City School District (urban): math 21% / reading 26% proficiency, ranked #589 of 590 in NY (top 100%) — low school quality limits family demand, transient renter base, plan for 1-2y turnover; 82% free/reduced lunch — lower-income household profile, screen leases tightly.
- Market conditions: 48 active listings in the ZIP; 26 comparable units currently listed for rent nearby; rentals at typical pace (median 15d on market — plan ~3-4 weeks tenant-placement turnaround); 1,169 units permitted in Monroe County in 2024 (591 in 5+ unit buildings).
Forward outlook
- Local home prices are declining (-3.0%/yr); year-one equity from $1k of loan paydown is wiped out by about $5k of value loss. Plan a longer hold.
- Monroe County population projected to shrink 6% by 2050 — rents likely to lag national; underwrite the cash flow, not the appreciation.
Negotiation context
- Only 12 days on market — expect competitive offers; lowballing is unlikely to land.
- Current owner paid $51k; list at $170k implies a 233% gain — meaningful room to come down on a strong offer.
Risks & watch-outs
- Watch-outs: built in 1914 — expect roof / HVAC / electrical / plumbing capex.
- Climate carrying-cost: moderate flood risk — expect insurance premiums to compound above CPI over the hold.
Questions for the listing agent
- Built in 1914 — when were the roof, HVAC, electrical panel, plumbing, and water heater last replaced?
- Is there a deadline driving the sale (1031 exchange, divorce, estate, relocation)? That informs how much negotiation room exists.
- Schools are D-rated, which usually means shorter tenancies and higher turnover. Who's the typical renter profile here, and what's been the actual vacancy rate?
- Crime grade is F in this area — have there been break-ins, vandalism, or insurance claims at this property in the last 3 years? What carrier currently insures it and at what premium?
- What's the average days-on-market for RENTAL listings here right now (not sales)? A rising rental-DOM trend means longer vacancies and softer asking-rent achievability than the comps imply.
- What's the recent tenant-quality profile in this submarket — average credit score on applications, eviction rate, late-payment / NSF rate, and stable-employment percentage? A property-management company in the area should have these aggregated.
- How much new for-sale + rental construction is in the pipeline within 1–3 miles? Heavy new supply typically softens prices + rents 12–24 months out; constrained supply supports both.
Investment metrics
- 1% rule
- 1.10% ✓
- Cap rate
- 9.18%
- Cash-on-cash
- 10.32%
- DSCR
- 1.46
- GRM
- 7.6
CMA / ARV
- ARV (median comp)
- $196,148
- List price
- $169,900
- Delta
- -13.38%
- Verdict
- UNDERPRICED
- Comps
- 20 within 1.0 mi
Show comp detail 12 sales within ~0.75 mi
| Address | Dist | Beds/Ba | Sqft | Sold | Price | $/sf | Match |
|---|---|---|---|---|---|---|---|
| 88 Monica St | 0.07mi | 4/1.0 | 1,342 (-10%) | 2mo | $97,500 | $73 | 79 |
| 117 Millbank St | 0.07mi | 4/2.0 | 1,639 (+10%) | 1mo | $173,000 | $106 | 75 |
| 84 Ellicott St | 0.18mi | 3/3.5 (-1) | 1,504 (+1%) | 0mo | $223,000 | $148 | 75 |
| 53 Congress Ave | 0.27mi | 4/2.0 | 1,625 (+9%) | 2mo | $205,000 | $126 | 67 |
| 43 Stanfield Ter | 0.51mi | 3/1.0 (-1) | 1,526 (+2%) | 0mo | $170,000 | $111 | 67 |
| 1283 Plymouth Ave S | 0.37mi | 4/2.0 | 1,621 (+9%) | 1mo | $200,000 | $123 | 64 |
| 797 Seward St | 0.26mi | 3/1.5 (-1) | 1,336 (-10%) | 1mo | $170,000 | $127 | 63 |
| 15 Brookscrest Way | 0.43mi | 3/2.5 (-1) | 1,562 (+5%) | 1mo | $329,900 | $211 | 60 |
| 84 Stratford Park | 0.28mi | 3/1.0 (-1) | 1,275 (-14%) | 1mo | $83,000 | $65 | 57 |
| 18 Melrose St | 0.40mi | 4/1.5 | 1,286 (-14%) | 2mo | $180,000 | $140 | 55 |
| 90 Cottage St | 0.66mi | 3/1.0 (-1) | 1,303 (-13%) | 1mo | $145,000 | $111 | 43 |
| 65 Devon Rd | 0.64mi | 3/1.5 (-1) | 1,296 (-13%) | 2mo | $195,000 | $150 | 40 |
Match score weights: distance 35% · size 25% · config 20% · recency 20%. Top-matched comps best support the ARV.
Projected returns pro-forma
-3.0% appreciation · 3.0% rent growth · sell at horizon
- IRR
- -0.8%
- Equity multiple
- 0.97×
- Total profit
- $-1,503
- Equity at exit
- $25,333
- IRR
- 8.8%
- Equity multiple
- 1.67×
- Total profit
- $32,102
- Equity at exit
- $14,690
Cash invested: $47,572 (down + closing). Projections, not guarantees.
Landlord ↔ Tenant lean methodology
- Overall (STATE)
- 15 Strongly Tenant-Friendly
- State New York
- 15 Strongly Tenant-Friendly · D+10
- County
- — inherits STATE
- City
- — inherits STATE
ZIP-level market 14619
- Home prices YoY
- -10.0%
- Active inventory
- 48
- Price-to-rent
- 7.6×
Monthly cashflow live
- Estimated rent
- $1,869 high interval (Pro) →
- Mortgage (P&I)
- −$891
- Tax from tax record
- −$106 /mo · $1,268/yr
- Insurance
- −$71
- HOA
- −$0
- Vacancy / Maint / Mgmt
- −$393
- Net cashflow
- $409
Break-even live
UW: 25.0% down · 7.5% · 30yr · 1.5% tax · 5.0% vac · 8.0% maint · 8.0% mgmt
Financing live
Cash to close
- Down payment
- $42,475
- Closing costs
- $5,097
- Reserves months
- —
- Total cash needed
- —
Loan-product check · same deal, 3 products live
Conventional
25% down · 7.5% · 30yr
- Down + closing
- —
- Monthly P&I
- —
- Monthly cashflow
- —
- DSCR
- —
- Eligible?
- —
Personal DTI + credit; lowest rate.
DSCR
20% down · 8.5% · 30yr
- Down + closing
- —
- Monthly P&I
- —
- Monthly cashflow
- —
- DSCR
- —
- Eligible?
- —
No personal income docs; deal must DSCR.
Hard money
10% down · 12.0% · 12mo
- Down + closing
- —
- Monthly P&I
- —
- Monthly cashflow
- —
- DSCR
- —
- Eligible?
- —
Short-term bridge; refi at stabilization.
Rent comps 26 comps
| Address | Beds | Baths | Sqft | Rent | $/sqft | DOM | Units | Dist |
|---|---|---|---|---|---|---|---|---|
| 127 Congress Ave Rochester, NY | 3.0 | 1.0 | 1200 | $1,595 | $1.33 | 43d | 1 | 0.28mi |
| 793 Woodbine Ave Rochester, NY | 4.0 | 1.0 | 1700 | $2,200 | $1.29 | 2d | 1 | 0.37mi |
| 485 Sawyer St Unit 1 Rochester, NY | 3.0 | 1.0 | 1400 | $1,900 | $1.36 | 43d | 1 | 0.39mi |
| 485 Sawyer St Rochester, NY | 3.0 | 1.0 | 1400 | $1,900 | $1.36 | 2d | 1 | 0.39mi |
| 686 Seward St Rochester, NY | 3.0 | 1.5 | 1166 | $1,600 | $1.37 | 43d | 1 | 0.42mi |
| 30 Flanders St Rochester, NY | 3.0 | 1.5 | 1170 | $1,650 | $1.41 | 14d | 1 | 0.43mi |
| 444-450 Brooks Ave Unit 446 Rochester, NY | 4.0 | 2.0 | 1150 | $3,100 | $2.70 | 10d | 1 | 0.44mi |
| 102 Virginia Ave Rochester, NY | 4.0 | 1.5 | 1453 | $2,150 | $1.48 | 2d | 1 | 0.46mi |
| 1317 Genesee St Rochester, NY | 3.0 | 2.0 | 1720 | $2,550 | $1.48 | 2d | 1 | 0.57mi |
| 132 Anthony St Rochester, NY | 3.0 | 1.0 | 1260 | $1,500 | $1.19 | 3d | 1 | 0.59mi |
| 367 Hawley St Rochester, NY | 4.0 | 1.5 | 1210 | $1,395 | $1.15 | 43d | 1 | 0.65mi |
| 192 Bartlett St Unit 192 Rochester, NY | 3.0 | 1.0 | 1099 | $1,295 | $1.18 | 14d | 1 | 0.79mi |
| 190 Warwick Ave Rochester, NY | 3.0 | 1.5 | 1240 | $1,400 | $1.13 | 43d | 1 | 0.80mi |
| 249 1/2 Columbia Ave #249 Rochester, NY | 3.0 | 1.0 | 1600 | $1,300 | $0.81 | 14d | 1 | 0.84mi |
| 193 Reynolds St Rochester, NY | 3.0 | 1.5 | 1342 | $1,800 | $1.34 | 21d | 1 | 1.05mi |
| 161 Fillmore St Rochester, NY | 4.0 | 2.0 | 1612 | $1,400 | $0.87 | 14d | 1 | 1.09mi |
| 73 Somerset St Rochester, NY | 4.0 | 1.0 | 1000 | $1,750 | $1.75 | 43d | 1 | 1.11mi |
| 48 Thorndale Ter Rochester, NY | 4.0 | 1.5 | 1700 | $1,400 | $0.82 | 14d | 1 | 1.16mi |
| 478 Tremont St Rochester, NY | 3.0 | 2.0 | 1424 | $1,500 | $1.05 | 43d | 1 | 1.17mi |
| 175 Lattimore Rd Rochester, NY | 3.0 | 1.0 | 1480 | $2,265 | $1.53 | 14d | 1 | 1.23mi |
| 136 Garfield St Rochester, NY | 3.0 | 1.0 | 1152 | $1,200 | $1.04 | 19d | 1 | 1.24mi |
| 32 Stanton St Rochester, NY | 3.0 | 1.0 | 1390 | $1,500 | $1.08 | 10d | 1 | 1.27mi |
| 59 Gold St Rochester, NY | 3.0 | 1.5 | 1264 | $2,000 | $1.58 | 43d | 1 | 1.31mi |
| 839 Elmwood Ave Rochester, NY | 3.0 | 1.0 | 1500 | $2,600 | $1.73 | 23d | 1 | 1.31mi |
| 51 Elmerston Rd Rochester, NY | 3.0 | 2.0 | 1374 | $2,400 | $1.75 | 2d | 1 | 1.43mi |
| 54 Westmoreland Dr Rochester, NY | 4.0 | 1.0 | 1230 | $2,450 | $1.99 | 2d | 1 | 1.47mi |
Listing history 3 events
-
2026-05-08$169,900 Active 1295-char remark
-
2023-06-10historical
-
2020-05-22soldstatus $51,000
ⓘ Source: listings_history table (triggers on properties + properties_extension) + one-shot
backfill from property_details.listing_events for pre-trigger history.
Tax reassessment forecast NY · Partial reset (capped growth)
- Current annual tax
- $1,268 · $106/mo
- Projected year-2 tax
- $2,070 · $172/mo
- Expected delta
- +$801/yr (+$67/mo · 63.2%)
ⓘ Screening estimate from a state-policy table — verify with the county assessor before closing.
Climate risk First Street
- Flood 5/10 Major FEMA zone X (unshaded) · 48% chance over 30 yrs
- Wildfire 1/10 Low
- Heat 2/10 Low 7 d/yr ≥96°F today · 15 d/yr by 30 yrs out
- Wind 1/10 Low
- Air quality 2/10 Low 1 unhealthy d/yr today · 1 by 30 yrs out
Nearby sold comps map
Loading sold comps map…
Walkable amenities ~0.75 mi
Loading nearby amenities…
Taxation est. · year 1
- Rental income
- $22,431
- − Mortgage interest
- −$9,517
- − Property taxes
- −$1,268
- − Insurance
- −$850
- − Repairs & maintenance
- −$1,794
- − Management
- −$1,794
- − Depreciation
- −$4,943
- Taxable income
- $2,265
- Est. tax owed @ 24.0%
- −$544
- After-tax cash flow
- $4,367/yr
For passive investors: Depreciation is non-cash, so a rental often shows a tax loss while cash-flowing — sheltering income. Rental losses are passive: they offset passive income freely, and up to $25,000/yr can offset ordinary (W-2) income if you actively participate and your MAGI is under $100k (phasing out to $0 by $150k); unused losses carry forward. On sale, claimed depreciation is recaptured at up to 25%, and gains may owe capital-gains tax (a 1031 exchange can defer both). Figures are a year-1 estimate at your 24.0% rate — not tax advice; consult a CPA.
Schools (NCES district)
- District
- Rochester City School District
- NCES district ID
- 3624750
- Math proficiency
- 21% ▬ 0.00%
- Reading proficiency
- 26% ▲ 4.00%
- Median HH income
- $30,923
- Composite
- 18.98/100
- National rank
- #8850
- State rank
- #589 of 590 in NY
Livability — Rochester
- Score
- 76/100
- State rank
- #222
- US rank
- #3482
Category grades
Schools grade is shown separately in the Schools card above.
Census & demographics
- Census place
- Rochester, NY
- City population
- 432,803
- Population (ZIP)
- 14,223
Population outlook (Monroe County) Hauer SSP2
- Today (2025)
- 759,460 people
- By 2030
- 757,154 · -0.3%
- By 2040
- 740,644 · -2.5%
- By 2050
- 714,443 · -5.9%
- By 2075
- 645,883 · -15.0%
- By 2100
- 547,084 · -28.0%
Race, ethnicity, and origin ACS 2023
- Neighborhood character
- Predominantly Black (66%)
- Race & ethnicity
- Black 66% White 20% Two or more races 8% Hispanic / Latino 6% Asian 1%
- Hispanic origin (detail)
- Puerto Rican 5%
- Common ancestry
- Romanian 2% Swedish 1% Lithuanian 1%
- Foreign-born
- 8% · Canada
- Languages at home
- 92% English-only · Spanish 3% Arabic 1% French/Haitian/Cajun 1%
Political lean MEDSL · Monroe
- 2024 margin
- D (+19.1) · D 59.5% · R 40.5%
- 2008→2024 swing
- +1.4pp toward D · 2008: 17.7pp · 2024: 19.1pp
- All cycles
- 2024: D+19.1 2020: D+21.0 2016: D+14.1 2012: D+17.4 2008: D+17.7
Not yet ingested
- Civics
- —
Market trends
- HPI YoY
- ▼ -30.67%
- Current HPI
- 276.3851
- Rent YoY
- —
- Metro
- —
- State GDP YoY
- ▲ 2.60%
- F500 in state
- 92
Industry mix (Fortune 500 HQ in NY)
| Industry | F500 HQs | Revenue |
|---|---|---|
| Financial Services | 10 | $950B |
|
||
| Consumer Goods | 9 | $162B |
|
||
| Insurance | 4 | $225B |
|
||
| Telecommunications | 2 | $144B |
|
||
| Pharmaceuticals | 2 | $112B |
|
||
| Media / Entertainment | 2 | $69B |
|
||
Price history
+233.1% since first listed4 events — show timeline
- 2026-05-20 Pending — UNYREIS
- 2026-05-08 Listed $169,900 UNYREIS
- 2023-06-10 Rental Removed — RENT.
- 2020-05-22 Sold (Public Records) $51,000 Public Records
Property tax history
+5.1%/yrLatest (2025): $1,268 · -6.9% YoY. Source: county tax records.
Cash-flow waterfall
monthlySold comps — $/sqft
last 12 mo · ≤1 miLoading sold comps…