 Multi-family
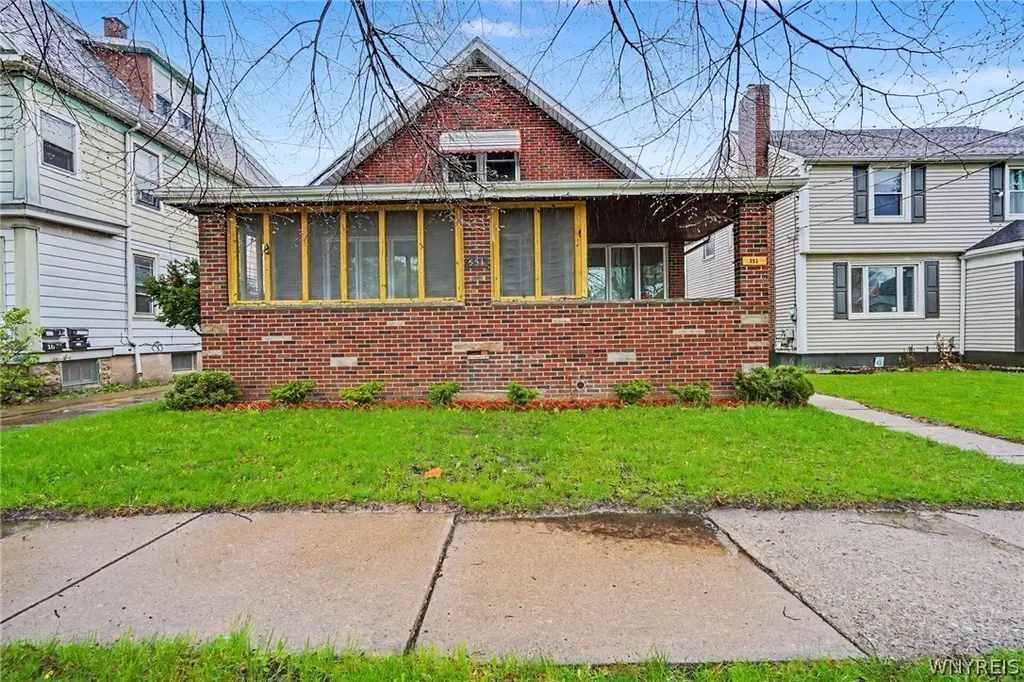
551 22nd St · Niagara Falls, NY
Flood risk 1/10 · Minimal
- FEMA flood zone
- X (unshaded)
- Chance of flooding over 30 yrs
- 0.0%
- Est. flood insurance / yr
- $473 – $860
Fire risk 1/10 · Minimal
- Est. fire insurance / yr
- $691 – $1,283
Heat risk 3/10 · Minor
- Hot days now (above 94°F)
- 7 days/yr
- Hot days in 30 yrs
- 15 days/yr
Wind risk 1/10 · Minimal
- Chance of severe wind over 30 yrs
- —
Air-quality risk 3/10 · Minor
- Unhealthy air days now
- 2 days/yr
- Unhealthy air days in 30 yrs
- 3 days/yr
Risk factors via First Street. Map © Google.
Why this score? — see what drove the B- grade
The composite is a weighted blend of 9 inputs, each scored 0–100. Each bar is that input's sub-score; the figure is the points it added to the 100-point composite (weight × sub-score).
- Cash flow +25.0/30.0
- Appreciation +10.0/10.0
- DSCR +8.2/10.0
- ARV discount +7.5/15.0
- 1% rule +6.4/10.0
- Rent growth +4.7/5.0
- Livability +3.0/5.0
- Schools +2.5/10.0
- Condition / age +2.5/5.0
$325,000
🖨 Deal sheet (PDF) 📄 Offer letter ✓ Due diligence
Multi-family units
County records classify this as Multi-Family (2-4 Unit). Listing-text estimate: 1 unit. estimate disagrees with records
Listing remarks
Fully renovated in 2020, this meticulously maintained home features brick siding, all-new wiring, furnace, hot water tank, windows, hardwood floors, and appliances—everything has been completely updated. Originally designed as a two-family property, it is currently used as a single-family home but offers easy conversion back to a multi-unit by completing the upstairs kitchen. The main level includes three bedrooms and one full bath, while the upper level offers three bedrooms (one bedroom doesn't have a closet) and an additional full bath, with a third full bathroom located in the basement. Enjoy a bright, open living and dining area, a beautifully updated kitchen, and modern finishes
Key facts
- Brick siding
- Hot water tank
- All-new wiring
Tags
Neighborhood map
What this means for you Summary
Snapshot
- This is a 6-bed/3.0-bath multifamily listed at $325k.
Deal economics
- At list price, monthly cash flow is $707 ($8k/yr) — positive.
- The deal already cash-flows at list — no discount required.
- Meets the 1% rule at list price ($4k rent vs $325k).
- Recommended offer: $315k (3.0% below list) — sets the bar for market timing.
Location & tenants
- Location reads 60/100 on livability (#956 in NY) — a middle-class / working-renter tenant base. Strengths: cost of living A+, housing A+; Watch: crime F, amenities F, commute F.
- Niagara Falls City School District (urban): math 26% / reading 34% proficiency, ranked #578 of 590 in NY (top 98%) — families likely to look elsewhere, expect single-tenant / working-renter base with shorter leases; 66% free/reduced lunch — lower-income household profile, screen leases tightly.
- Zoned schools: Bloneva Bond Primary School (math 2% / reading 17%, grade F, #2,075 of 2,108 statewide, top 99%, 403 students, 82% FRL); Gaskill Preparatory School (math 10% / reading 22%, grade F, #702 of 729 statewide, top 96%, 500 students, 78% FRL); Niagara Falls High School (math 75% / reading 92%, grade A, #409 of 1,100 statewide, top 39%, 2,139 students, 71% FRL).
- Market conditions: Rents rising fast (+8.8%/yr); 164 active listings in the ZIP; lower-income renter base — watch delinquency; 167 units permitted in Niagara County in 2024 (0 in 5+ unit buildings).
- At $3,694/mo this rent would consume 128% of the median local household income ($35k/yr) (locally 954% of renters already pay >50% of income on rent) — very limited rent-growth headroom before tenants either downsize or default.
Forward outlook
- In year one you build about $35k of equity ($2k loan paydown + $32k appreciation (10.0% local appreciation)).
- Niagara County population projected at -19% by 2050 — secular population decline; favor cash flow + early exit over multi-decade hold.
- At projected returns (10.0% appreciation + 8.0% rent growth), your $91k cash investment doubles in ~2 years — after that, you're playing with house money.
- By year 2, paydown + projected appreciation supports a ~$56k cash-out refi (75% LTV) — recoverable capital for the next deal without selling this one.
Negotiation context
- It's been on market 35 days — a 3% lower offer ($315k) is reasonable based on typical stale-listing flexibility.
- Current owner paid $60k; list at $325k implies a 442% gain — meaningful room to come down on a strong offer.
Risks & watch-outs
- Watch-outs: built in 1950 — expect roof / HVAC / electrical / plumbing capex.
Questions for the listing agent
- It's been on market 35 days. Have you received any prior offers? Is the seller open to a 3% concession, seller financing, or rate buy-down credit?
- Built in 1950 — when were the roof, HVAC, electrical panel, plumbing, and water heater last replaced?
- Is there a deadline driving the sale (1031 exchange, divorce, estate, relocation)? That informs how much negotiation room exists.
- Schools are F-rated, which usually means shorter tenancies and higher turnover. Who's the typical renter profile here, and what's been the actual vacancy rate?
- Crime grade is F in this area — have there been break-ins, vandalism, or insurance claims at this property in the last 3 years? What carrier currently insures it and at what premium?
- What's the average days-on-market for RENTAL listings here right now (not sales)? A rising rental-DOM trend means longer vacancies and softer asking-rent achievability than the comps imply.
- What's the recent tenant-quality profile in this submarket — average credit score on applications, eviction rate, late-payment / NSF rate, and stable-employment percentage? A property-management company in the area should have these aggregated.
- How much new apartment / multifamily construction is in the pipeline within 1–3 miles? Heavy new supply (>2% of stock underway) typically softens rents 12–24 months out; light construction supports rent growth.
Investment metrics
- 1% rule
- 1.14% ✓
- Cap rate
- 8.90%
- Cash-on-cash
- 9.33%
- DSCR
- 1.42
- GRM
- 7.3
CMA / ARV
- ARV (median comp)
- $183,830
- List price
- $325,000
- Delta
- 76.79%
- Verdict
- OVERPRICED
- Comps
- 20 within 1.0 mi
Show comp detail 12 sales within ~0.75 mi
| Address | Dist | Beds/Ba | Sqft | Sold | Price | $/sf | Match |
|---|---|---|---|---|---|---|---|
| 559 22nd St | 0.01mi | 7/3.0 (+1) | 2,520 (+3%) | 10mo | $38,000 | $15 | 81 |
| 626 23rd St | 0.10mi | 5/3.0 (-1) | 2,600 (+6%) | 6mo | $125,000 | $48 | 75 |
| 444 20th St | 0.25mi | 5/3.0 (-1) | 2,385 (-2%) | 6mo | $25,000 | $10 | 74 |
| 2230 Grand Ave | 0.23mi | 6/3.0 | 2,348 (-4%) | 11mo | $165,000 | $70 | 73 |
| 2460 Grand Ave | 0.31mi | 6/2.0 | 2,162 (-12%) | 0mo | $175,000 | $81 | 62 |
| 2225 Whitney Ave | 0.52mi | 6/2.0 | 2,200 (-10%) | 3mo | $125,000 | $57 | 52 |
| 2401 Whitney Ave | 0.53mi | 6/2.0 | 2,168 (-11%) | 2mo | $40,000 | $18 | 51 |
| 1023 15th St | 0.60mi | 5/4.0 (-1) | 2,304 (-6%) | 5mo | $190,000 | $82 | 50 |
| 412 19th St | 0.34mi | 5/2.0 (-1) | 2,208 (-10%) | 12mo | $80,000 | $36 | 49 |
| 1825 Pierce Ave | 0.61mi | 6/2.0 | 2,288 (-6%) | 10mo | $110,000 | $48 | 48 |
| 1000 19th St | 0.42mi | 6/2.5 | 2,804 (+15%) | 7mo | $65,000 | $23 | 48 |
| 417 18th St | 0.35mi | 6/2.0 | 2,080 (-15%) | 10mo | $166,000 | $80 | 46 |
Match score weights: distance 35% · size 25% · config 20% · recency 20%. Top-matched comps best support the ARV.
Projected returns pro-forma
10.0% appreciation · 8.0% rent growth · sell at horizon
- IRR
- 33.3%
- Equity multiple
- 3.66×
- Total profit
- $241,615
- Equity at exit
- $292,786
- IRR
- 30.4%
- Equity multiple
- 8.96×
- Total profit
- $724,516
- Equity at exit
- $631,404
Cash invested: $91,000 (down + closing). Projections, not guarantees.
Landlord ↔ Tenant lean methodology
- Overall (STATE)
- 15 Strongly Tenant-Friendly
- State New York
- 15 Strongly Tenant-Friendly · D+10
- County
- — inherits STATE
- City
- — inherits STATE
ZIP-level market 14301
- Home prices YoY
- 6.2%
- Rents YoY
- 8.8%
- Active inventory
- 164
- Price-to-rent
- 21.1×
Monthly cashflow live
- Estimated rent
- $3,694 high interval (Pro) →
- Mortgage (P&I)
- −$1,704
- Tax from tax record
- −$371 /mo · $4,453/yr
- Insurance
- −$135
- HOA
- −$0
- Vacancy / Maint / Mgmt
- −$776
- Net cashflow
- $707
Break-even live
Sensitivity live
| Price | -10% $891 | -5% $799 | +0% $707 | +5% $615 | +10% $523 |
|---|---|---|---|---|---|
| Rent | -10% $416 | -5% $562 | +0% $707 | +5% $853 | +10% $999 |
| Rate | -1.0pp $871 | -0.5pp $790 | base $707 | +0.5pp $623 | +1.0pp $538 |
3-unit breakdown (identical units grouped — click to expand)
| Units | Beds | Baths | Est. rent |
|---|---|---|---|
| 2× units | 3 | 1 | $2,564 |
| #1 | 3 | 1 | $1,282 |
| #2 | 3 | 1 | $1,282 |
| 1× unit | 1 | 1 | $1,130 |
| Total (3 units) | $3,694 | ||
UW: 25.0% down · 7.5% · 30yr · 1.5% tax · 5.0% vac · 8.0% maint · 8.0% mgmt
Financing live
Cash to close
- Down payment
- $81,250
- Closing costs
- $9,750
- Reserves months
- —
- Total cash needed
- —
Loan-product check · same deal, 3 products live
Conventional
25% down · 7.5% · 30yr
- Down + closing
- —
- Monthly P&I
- —
- Monthly cashflow
- —
- DSCR
- —
- Eligible?
- —
Personal DTI + credit; lowest rate.
DSCR
20% down · 8.5% · 30yr
- Down + closing
- —
- Monthly P&I
- —
- Monthly cashflow
- —
- DSCR
- —
- Eligible?
- —
No personal income docs; deal must DSCR.
Hard money
10% down · 12.0% · 12mo
- Down + closing
- —
- Monthly P&I
- —
- Monthly cashflow
- —
- DSCR
- —
- Eligible?
- —
Short-term bridge; refi at stabilization.
Listing history 12 events
-
2026-06-10days on market $325,000 Active 35 DOM
-
2026-06-09days on market $325,000 Active 34 DOM
-
2026-06-08days on market $325,000 Active 33 DOM
-
2026-06-07days on market $325,000 Active 32 DOM
-
2026-06-03days on market $325,000 Active 28 DOM
-
2026-06-02days on market $325,000 Active 27 DOM
-
2026-06-01days on market $325,000 Active 26 DOM
-
2026-05-31days on market $325,000 Active 25 DOM
-
2026-05-12historical
-
2026-05-05$325,000 Active
-
2026-05-05$325,000 Active 1009-char remark
-
2008-03-26soldstatus $60,000
ⓘ Source: listings_history table (triggers on properties + properties_extension) + one-shot
backfill from property_details.listing_events for pre-trigger history.
Tax reassessment forecast NY · Partial reset (capped growth)
- Current annual tax
- $4,453 · $371/mo
- Projected year-2 tax
- $4,973 · $414/mo
- Expected delta
- +$520/yr (+$43/mo · 11.7%)
ⓘ Screening estimate from a state-policy table — verify with the county assessor before closing.
Climate risk First Street
- Flood 1/10 Low FEMA zone X (unshaded) · 0% chance over 30 yrs
- Wildfire 1/10 Low
- Heat 3/10 Moderate 7 d/yr ≥94°F today · 15 d/yr by 30 yrs out
- Wind 1/10 Low
- Air quality 3/10 Moderate 2 unhealthy d/yr today · 3 by 30 yrs out
Nearby sold comps map
Loading sold comps map…
Walkable amenities ~0.75 mi
Loading nearby amenities…
Taxation est. · year 1
- Rental income
- $44,328
- − Mortgage interest
- −$18,205
- − Property taxes
- −$4,453
- − Insurance
- −$1,625
- − Repairs & maintenance
- −$3,546
- − Management
- −$3,546
- − Depreciation
- −$9,455
- Taxable income
- $3,498
- Est. tax owed @ 24.0%
- −$839
- After-tax cash flow
- $7,650/yr
For passive investors: Depreciation is non-cash, so a rental often shows a tax loss while cash-flowing — sheltering income. Rental losses are passive: they offset passive income freely, and up to $25,000/yr can offset ordinary (W-2) income if you actively participate and your MAGI is under $100k (phasing out to $0 by $150k); unused losses carry forward. On sale, claimed depreciation is recaptured at up to 25%, and gains may owe capital-gains tax (a 1031 exchange can defer both). Figures are a year-1 estimate at your 24.0% rate — not tax advice; consult a CPA.
Schools (NCES district)
- District
- Niagara Falls City School District
- NCES district ID
- 3620820
- Math proficiency
- 26% ▼ -10.00%
- Reading proficiency
- 34% ▲ 3.00%
- Median HH income
- $32,488
- Composite
- 24.5/100
- National rank
- #7655
- State rank
- #578 of 590 in NY
Livability — Niagara Falls
- Score
- 60/100
- State rank
- #956
- US rank
- #18749
Category grades
Schools grade is shown separately in the Schools card above.
Census & demographics
- Census place
- Niagara Falls, NY
- County
- Niagara County · 157,377 people
- City population
- 62,983
- Metro
- Buffalo-Cheektowaga, NY
- Population (ZIP)
- 10,923
- Household income
- $34,549
- Rent vs Own
- Severe rent burden
- 954.0
Population outlook (Niagara County) Hauer SSP2
- Today (2025)
- 204,149 people
- By 2030
- 197,900 · -3.1%
- By 2040
- 182,239 · -10.7%
- By 2050
- 165,198 · -19.1%
- By 2075
- 129,416 · -36.6%
- By 2100
- 96,222 · -52.9%
Race, ethnicity, and origin ACS 2023
- Neighborhood character
- Diverse neighborhood (Simpson 0.58)
- Race & ethnicity
- White 59% Black 25% Two or more races 8% Hispanic / Latino 8% Asian 2%
- Hispanic origin (detail)
- Puerto Rican 3% Cuban 2%
- Common ancestry
- Romanian 6% Slovak 2% Lithuanian 1%
- Foreign-born
- 5% · Canada, China, Dominican Republic
- Languages at home
- 90% English-only · Spanish 6% Other Indo-European 3% Chinese 1%
Political lean MEDSL · Niagara
- 2024 margin
- R (+14.9) · D 42.5% · R 57.5%
- 2008→2024 swing
- -15.9pp toward R · 2008: 1.0pp · 2024: -14.9pp
- All cycles
- 2024: R+14.9 2020: R+9.7 2016: R+19.0 2012: D+0.6 2008: D+1.0
Not yet ingested
- Civics
- —
Market trends
- HPI YoY
- ▲ 15.41%
- Current HPI
- 266.1457
- Rent YoY
- ▲ 8.79%
- Metro
- Buffalo-Cheektowaga, NY
- State GDP YoY
- ▲ 2.60%
- F500 in state
- 92
Industry mix (Fortune 500 HQ in NY)
| Industry | F500 HQs | Revenue |
|---|---|---|
| Financial Services | 10 | $950B |
|
||
| Consumer Goods | 9 | $162B |
|
||
| Insurance | 4 | $225B |
|
||
| Telecommunications | 2 | $144B |
|
||
| Pharmaceuticals | 2 | $112B |
|
||
| Media / Entertainment | 2 | $69B |
|
||
Price history
+441.7% since first listed3 events — show timeline
- 2026-05-12 Listing Removed — WNYREIS
- 2026-05-05 Listed $325,000 WNYREIS
- 2008-03-26 Sold (Public Records) $60,000 Public Records
Property tax history
+19.4%/yrLatest (2025): $4,453 · +19.3% YoY. Source: county tax records.
Cash-flow waterfall
monthlySold comps — $/sqft
last 12 mo · ≤1 miLoading sold comps…