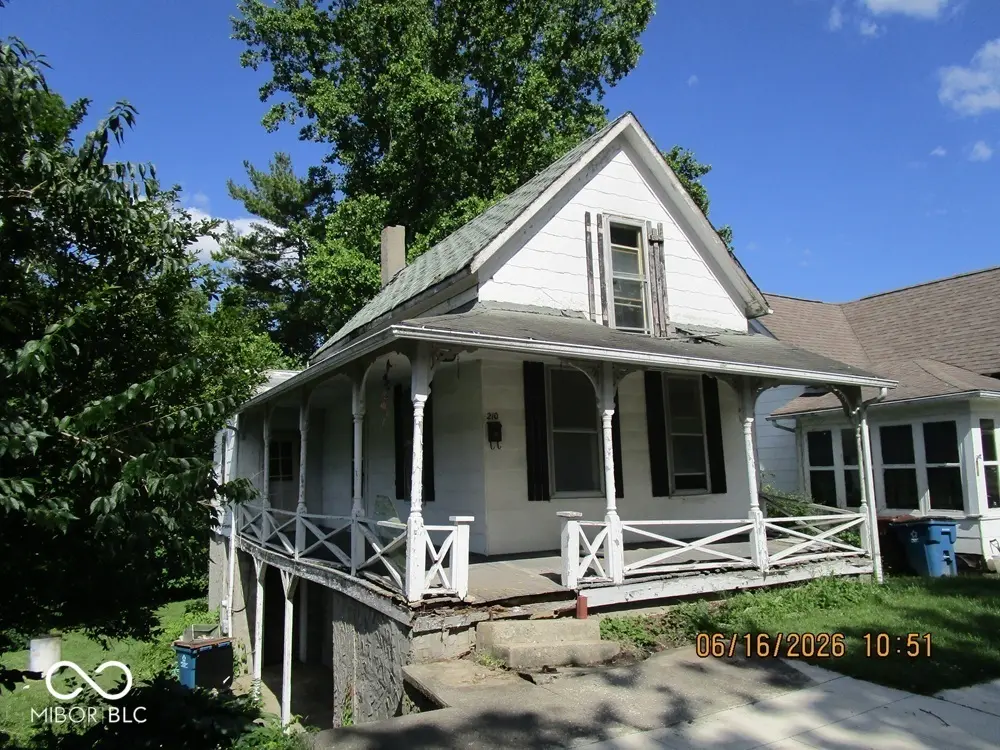
210 S Main St · Jonesboro, IN
Flood risk 1/10 · Minimal
- FEMA flood zone
- X (unshaded)
- Chance of flooding over 30 yrs
- 0.0%
- Est. flood insurance / yr
- $473 – $860
Fire risk 1/10 · Minimal
- Est. fire insurance / yr
- $717 – $1,331
Heat risk 3/10 · Minor
- Hot days now (above 100°F)
- 7 days/yr
- Hot days in 30 yrs
- 18 days/yr
Wind risk 2/10 · Minimal
- Chance of severe wind over 30 yrs
- —
Air-quality risk 2/10 · Minimal
- Unhealthy air days now
- 1 days/yr
- Unhealthy air days in 30 yrs
- 2 days/yr
Risk factors via First Street. Map © Google.
Why this score? — see what drove the D grade
The composite is a weighted blend of 9 inputs, each scored 0–100. Each bar is that input's sub-score; the figure is the points it added to the 100-point composite (weight × sub-score).
- Cash flow +15.0/30.0
- ARV discount +7.5/15.0
- 1% rule +5.0/10.0
- DSCR +5.0/10.0
- Livability +3.5/5.0
- Schools +2.7/10.0
- Rent growth +2.5/5.0
- Condition / age +2.5/5.0
- Appreciation +1.2/10.0
$1
🖨 Deal sheet (PDF) 📄 Offer letter ✓ Due diligence
Key facts
- 5,412 sq ft lot
- Garage
- Built 1910
Property features AI
Finance
- Other: Lot under 1/4 acre (approx. 0.12 acres)
Exterior
- Parking: On-street parking
- Utilities: Public water; Municipal sewer connected; Electricity connected (fuse panel); Natural gas connected
- Home design: Single-family residence; One and one-half story; Property listed as fixer
- Construction: Wood siding; Partial block and brick/mortar foundation
- Exterior features: Covered, wrap-around porch; Sidewalks; Mature trees; Access from lot
Interior
- Kitchen: Kitchen on main level
- Bedrooms: One bedroom on the upper level
- Bathrooms: One full bathroom with a full tub (main level)
- Heating & cooling: Forced air heating (natural gas); No central air
- Interior features: Partially finished basement with walk-out access; Utility room in basement; Family room in basement; Loft on upper level; Main-level living room
- Laundry & utility: Washer and dryer (laundry in basement); Water heater
Neighborhood map
What this means for you Summary
Snapshot
- This is a 3-bed/1.0-bath single-family listed at $1.
Deal economics
- At list price, monthly cash flow is $731 ($9k/yr) — positive.
- The deal already cash-flows at list — no discount required.
- Meets the 1% rule at list price ($925 rent vs $1).
Location & tenants
- Location reads 69/100 on livability (#197 in IN) — a middle-class / working-renter tenant base. Strengths: crime A+, cost of living A+, housing A-; Watch: health & safety D, amenities F, commute F.
- Mississinewa Community School Corporation (town): math 29% / reading 34% proficiency, ranked #233 of 301 in IN (top 77%) — families likely to look elsewhere, expect single-tenant / working-renter base with shorter leases.
- Zoned schools: Mississinewa High School (math 22% / reading 57%, grade F, #221 of 369 statewide, top 63%, 796 students, 61% FRL).
- Market conditions: 9 active listings in the ZIP; 3 comparable units currently listed for rent nearby; rentals lingering (median 44d on market — plan ~5-8 weeks vacancy on turnover, expect pricing pressure); 100% of comp listings sitting > 30 days — soft ceiling on asking rent; 52 units permitted in Grant County in 2024 (8 in 5+ unit buildings).
Forward outlook
- Local home prices are declining (-3.0%/yr); year-one equity from $0 of loan paydown is wiped out by about $0 of value loss. Plan a longer hold.
- Grant County population projected at -18% by 2050 — secular population decline; favor cash flow + early exit over multi-decade hold.
- At projected returns (-3.0% appreciation + 3.0% rent growth), your $0 cash investment doubles in ~1 year — after that, you're playing with house money.
Negotiation context
- Only 2 days on market — expect competitive offers; lowballing is unlikely to land.
Risks & watch-outs
- Watch-outs: built in 1910 — expect roof / HVAC / electrical / plumbing capex.
Questions for the listing agent
- Built in 1910 — when were the roof, HVAC, electrical panel, plumbing, and water heater last replaced?
- Is there a deadline driving the sale (1031 exchange, divorce, estate, relocation)? That informs how much negotiation room exists.
- Schools are D-rated, which usually means shorter tenancies and higher turnover. Who's the typical renter profile here, and what's been the actual vacancy rate?
- The area grade is low — what's the realistic commute time and amenity access for the typical tenant pool here? Any planned neighborhood developments (good or bad) we should know about?
- What's the average days-on-market for RENTAL listings here right now (not sales)? A rising rental-DOM trend means longer vacancies and softer asking-rent achievability than the comps imply.
- What's the recent tenant-quality profile in this submarket — average credit score on applications, eviction rate, late-payment / NSF rate, and stable-employment percentage? A property-management company in the area should have these aggregated.
- How much new for-sale + rental construction is in the pipeline within 1–3 miles? Heavy new supply typically softens prices + rents 12–24 months out; constrained supply supports both.
Investment metrics
- 1% rule
- 92487.00% ✓
- Cap rate
- 876774.76%
- Cash-on-cash
- 3131315.95%
- DSCR
- 139326.94
- GRM
- 0.0
CMA / ARV
- ARV (on-the-fly)
- $149,072
- Comps found
- 12
Show comp detail 12 sales within ~0.75 mi
| Address | Dist | Beds/Ba | Sqft | Sold | Price | $/sf | Match |
|---|---|---|---|---|---|---|---|
| 206 S Main St | 0.02mi | 3/1.0 | 1,068 (-13%) | 2mo | $156,250 | $146 | 75 |
| 204 W 8th St | 0.41mi | 3/1.5 | 1,224 (-1%) | 4mo | $163,500 | $134 | 74 |
| 303 S Main St | 0.06mi | 3/1.0 | 1,392 (+13%) | 5mo | $23,500 | $17 | 72 |
| 517 S Main St | 0.25mi | 2/1.0 (-1) | 1,083 (-12%) | 5mo | $55,000 | $51 | 59 |
| 207 S 3rd Ave | 0.25mi | 3/1.5 | 1,409 (+14%) | 10mo | $175,000 | $124 | 54 |
| 6109 S Jay St | 0.66mi | 2/1.0 (-1) | 1,260 (+2%) | 9mo | $25,000 | $20 | 53 |
| 604 W 10th St | 0.67mi | 3/2.0 | 1,212 (-2%) | 11mo | $135,000 | $111 | 53 |
| 602 Guilick St | 0.47mi | 3/1.0 | 1,058 (-14%) | 2mo | $128,000 | $121 | 53 |
| 605 W 10th St | 0.69mi | 2/1.0 (-1) | 1,164 (-6%) | 2mo | $60,100 | $52 | 52 |
| 202 W South I St | 0.68mi | 3/2.0 | 1,300 (+6%) | 5mo | $176,000 | $135 | 51 |
| 803 S Water St | 0.44mi | 2/1.0 (-1) | 1,388 (+13%) | 5mo | $28,500 | $21 | 50 |
| 612 W 9th St | 0.65mi | 3/1.0 | 1,070 (-13%) | 14mo | $132,000 | $123 | 36 |
Match score weights: distance 35% · size 25% · config 20% · recency 20%. Top-matched comps best support the ARV.
Projected returns pro-forma
-3.0% appreciation · 3.0% rent growth · sell at horizon
- IRR
- —
- Equity multiple
- 166246.24×
- Total profit
- $46,549
- Equity at exit
- $0
- IRR
- —
- Equity multiple
- 358970.78×
- Total profit
- $100,512
- Equity at exit
- $0
Cash invested: $0 (down + closing). Projections, not guarantees.
Landlord ↔ Tenant lean methodology
- Overall (STATE)
- 90 Strongly Landlord-Friendly
- State Indiana
- 90 Strongly Landlord-Friendly · R+11
- County
- — inherits STATE
- City
- — inherits STATE
ZIP-level market 46938
- Home prices YoY
- -3.5%
- Active inventory
- 9
Monthly cashflow live
- Estimated rent
- $925 medium interval (Pro) →
- Mortgage (P&I)
- −$0
- Tax est. 1.5%
- −$0 /mo · $0/yr
- Insurance
- −$0
- HOA
- −$0
- Vacancy / Maint / Mgmt
- −$194
- Net cashflow
- $731
Break-even live
Sensitivity live
| Price | -10% $731 | -5% $731 | +0% $731 | +5% $731 | +10% $731 |
|---|---|---|---|---|---|
| Rent | -10% $658 | -5% $694 | +0% $731 | +5% $767 | +10% $804 |
| Rate | -1.0pp $731 | -0.5pp $731 | base $731 | +0.5pp $731 | +1.0pp $731 |
UW: 25.0% down · 7.5% · 30yr · 1.5% tax · 5.0% vac · 8.0% maint · 8.0% mgmt
Financing live
Cash to close
- Down payment
- $0
- Closing costs
- $0
- Reserves months
- —
- Total cash needed
- —
Loan-product check · same deal, 3 products live
Conventional
25% down · 7.5% · 30yr
- Down + closing
- —
- Monthly P&I
- —
- Monthly cashflow
- —
- DSCR
- —
- Eligible?
- —
Personal DTI + credit; lowest rate.
DSCR
20% down · 8.5% · 30yr
- Down + closing
- —
- Monthly P&I
- —
- Monthly cashflow
- —
- DSCR
- —
- Eligible?
- —
No personal income docs; deal must DSCR.
Hard money
10% down · 12.0% · 12mo
- Down + closing
- —
- Monthly P&I
- —
- Monthly cashflow
- —
- DSCR
- —
- Eligible?
- —
Short-term bridge; refi at stabilization.
Rent comps 3 comps
| Address | Beds | Baths | Sqft | Rent | $/sqft | DOM | Units | Dist |
|---|---|---|---|---|---|---|---|---|
| 400 E South a St Gas City, IN | 2.0 | 1.0 | 888 | $725 | $0.82 | 44d | 1 | 1.05mi |
| 7145 S Meridian St Unit 161 Marion, IN | 3.0 | 2.0 | 1180 | $1,195 | $1.01 | 44d | 1 | 1.22mi |
| 800 E South B St Gas City, IN | 1.0–2.0 | 1.0–2.0 | 818 | $760 | $0.93 | 44d | 1 | 1.46mi |
Listing history 2 events
-
2026-06-19days on market $1 Active 2 DOM
-
2026-06-17$1 Active 1 DOM
ⓘ Source: listings_history table (triggers on properties + properties_extension) + one-shot
backfill from property_details.listing_events for pre-trigger history.
Climate risk First Street
- Flood 1/10 Low FEMA zone X (unshaded) · 0% chance over 30 yrs
- Wildfire 1/10 Low
- Heat 3/10 Moderate 7 d/yr ≥100°F today · 18 d/yr by 30 yrs out
- Wind 2/10 Low
- Air quality 2/10 Low 1 unhealthy d/yr today · 2 by 30 yrs out
Nearby sold comps map
Loading sold comps map…
Walkable amenities ~0.75 mi
Loading nearby amenities…
Taxation est. · year 1
- Rental income
- $11,098
- − Mortgage interest
- −$0
- − Property taxes
- −$0
- − Insurance
- −$0
- − Repairs & maintenance
- −$888
- − Management
- −$888
- − Depreciation
- −$0
- Taxable income
- $9,323
- Est. tax owed @ 24.0%
- −$2,237
- After-tax cash flow
- $6,530/yr
For passive investors: Depreciation is non-cash, so a rental often shows a tax loss while cash-flowing — sheltering income. Rental losses are passive: they offset passive income freely, and up to $25,000/yr can offset ordinary (W-2) income if you actively participate and your MAGI is under $100k (phasing out to $0 by $150k); unused losses carry forward. On sale, claimed depreciation is recaptured at up to 25%, and gains may owe capital-gains tax (a 1031 exchange can defer both). Figures are a year-1 estimate at your 24.0% rate — not tax advice; consult a CPA.
Schools (NCES district)
- District
- Mississinewa Community School Corporation
- NCES district ID
- 1806870
- Math proficiency
- 29% ▼ -10.00%
- Reading proficiency
- 34% ▼ -10.00%
- Median HH income
- $41,555
- Composite
- 26.62/100
- National rank
- #7175
- State rank
- #233 of 301 in IN
Livability — Jonesboro
- Score
- 69/100
- State rank
- #197
- US rank
- #8836
Category grades
Schools grade is shown separately in the Schools card above.
Census & demographics
- Census place
- Jonesboro, IN
- Population (ZIP)
- 2,576
Population outlook (Grant County) Hauer SSP2
- Today (2025)
- 64,394 people
- By 2030
- 62,145 · -3.5%
- By 2040
- 57,252 · -11.1%
- By 2050
- 52,968 · -17.7%
- By 2075
- 45,986 · -28.6%
- By 2100
- 39,400 · -38.8%
Race, ethnicity, and origin ACS 2023
- Neighborhood character
- Predominantly White (95%)
- Race & ethnicity
- White 95% Two or more races 3% Hispanic / Latino 3%
- Common ancestry
- Russian 1% Iranian 1% Lithuanian 1%
- Foreign-born
- 1% · Canada
- Languages at home
- 98% English-only · Spanish 2%
Political lean MEDSL · Grant
- 2024 margin
- Solid R (+41.8) · D 28.2% · R 70.0% · Other 1.9%
- 2008→2024 swing
- -28.7pp toward R · 2008: -13.1pp · 2024: -41.8pp
- All cycles
- 2024: R+41.8 2020: R+38.8 2016: R+39.5 2012: R+22.0 2008: R+13.1
Not yet ingested
- Civics
- —
Market trends
- HPI YoY
- ▼ -7.69%
- Current HPI
- 212.8427
- Rent YoY
- —
- Metro
- —
- State GDP YoY
- ▲ 2.90%
- F500 in state
- 18
Industry mix (Fortune 500 HQ in IN)
| Industry | F500 HQs | Revenue |
|---|---|---|
| Industrial Machinery | 2 | $37B |
|
||
| Healthcare | 1 | $177B |
|
||
| Pharmaceuticals | 1 | $45B |
|
||
| Metals / Steel | 1 | $18B |
|
||
| Agriculture | 1 | $17B |
|
||
| Packaging | 1 | $12B |
|
||
Property tax history
-3.5%/yrLatest (2024): $297 · -26.7% YoY. Source: county tax records.
Cash-flow waterfall
monthlySold comps — $/sqft
last 12 mo · ≤1 miLoading sold comps…