3514 Bridgeport Dr · Farmersville, TX
Flood risk 1/10 · Minimal
- FEMA flood zone
- X (unshaded)
- Chance of flooding over 30 yrs
- 0.0%
- Est. flood insurance / yr
- $507 – $1,088
Fire risk 3/10 · Minor
- Est. fire insurance / yr
- $1,222 – $2,270
Heat risk 8/10 · Major
- Hot days now (above 111°F)
- 7 days/yr
- Hot days in 30 yrs
- 24 days/yr
Wind risk 6/10 · Moderate
- Chance of severe wind over 30 yrs
- 27.0%
Air-quality risk 2/10 · Minimal
- Unhealthy air days now
- 2 days/yr
- Unhealthy air days in 30 yrs
- 2 days/yr
Risk factors via First Street. Map © Google.
Why this score? — see what drove the D grade
The composite is a weighted blend of 9 inputs, each scored 0–100. Each bar is that input's sub-score; the figure is the points it added to the 100-point composite (weight × sub-score).
- ARV discount +11.1/15.0
- Cash flow +9.6/30.0
- Condition / age +4.8/5.0
- Schools +3.7/10.0
- Livability +3.5/5.0
- 1% rule +3.2/10.0
- DSCR +2.7/10.0
- Rent growth +2.5/5.0
- Appreciation +0.0/10.0
$259,889
🖨 Deal sheet (PDF) 📄 Offer letter ✓ Due diligence
Listing remarks
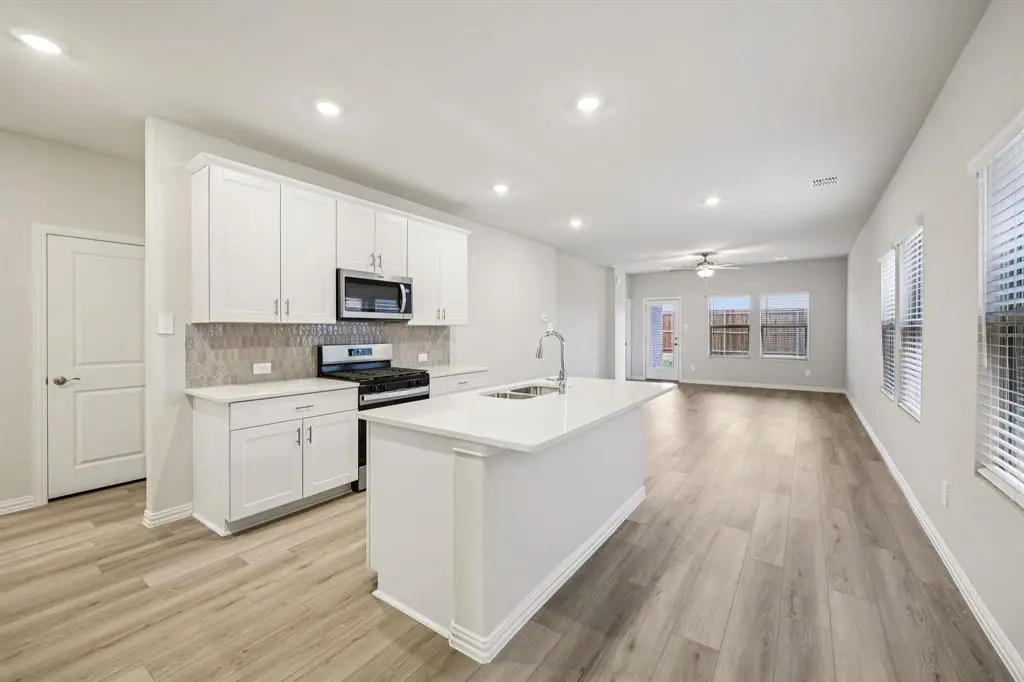
BRAND NEW energy - efficient home Jul 2026! With four bedrooms in the Carlsbad plan, you can customize the needs of your family. White cabinets with veined white quartz countertops, muted beige EVP flooring with light taupe carpet. Lakehaven is a master-planned community located at the edge of Lavon Lake, featuring all of the modern amenities. Family time will turn into lake time during the warm Texas summers. The Spring Series will boast six floorplans from our National Park Collection that range in size from approximately 1,270 sq. ft. to 2,255 sq. ft. Each of our homes is built with innovative, energy-efficient features designed to help you enjoy more savings, better health, real comfort
Key facts
- Modern amenities
- 5,227 sq ft lot
- 2 garage spots
Tags
Property features AI
Finance
- Other: Community amenities include clubhouse, community pool, jogging/bike path, playground, tennis courts, and other community features
- Financial info: Accepts Cash, Conventional, FHA, VA Loan, and 1031 Exchange
- HOA & community: Mandatory HOA; Annual association fee; Association fee includes full use of facilities and grounds maintenance; HOA managed by Neighborhood Management Inc.
Exterior
- Parking: Attached 2-car garage with garage door opener; 2 covered parking spaces
- Utilities: City water; City sewer; Property in a municipal utility district
- Home design: Single-family residence; Attached property; One story; New construction (incomplete as of 2026)
- Construction: Built in 2026; Fiber cement siding; Composition roof; Slab foundation
- Exterior features: Covered porch(es); Landscaped yard; Metal and wood fencing
Interior
- Kitchen: Dishwasher; Gas cooktop; Gas oven; Microwave; Vented exhaust fan
- Bedrooms: Primary bedroom on level 1 with walk-in closet (approx. 14 x 12); Bedroom on level 1 (approx. 11 x 11); Bedroom on level 1 (approx. 10 x 12); Bedroom on level 1 (approx. 10 x 10)
- Flooring: Carpet; Ceramic tile; Luxury vinyl plank
- Bathrooms: Two full bathrooms
- Heating & cooling: Central heating (electric); Central air conditioning (electric); Ceiling fans; ENERGY STAR qualified equipment
- Interior features: High-speed internet available; Smart home system; Seven total rooms; One living area; One dining area; One-level floor plan
- Laundry & utility: Dedicated laundry room on level 1 (approx. 8 x 5)
Neighborhood map
What this means for you Summary
Snapshot
- This is a 4-bed/2.0-bath single-family listed at $260k. Condition is rated excellent.
Deal economics
- At list price, monthly cash flow is $-174 ($-2k/yr) — negative.
- To cash-flow at today's rent, offer at most $235k (9.7% below list).
- To meet the 1% rule (rent ≥ 1% of price), the offer needs to be $213k (17.9% below list).
- Recommended offer: $213k (17.9% below list) — sets the bar for 1% rule.
- Cap rate 5.5% vs local median 4.0% in Farmersville — top-decile yield for the area; either an underpriced asset or a hidden risk that comps aren't pricing in. Stress-test before assuming the spread holds.
Location & tenants
- Location reads 69/100 on livability (#425 in TX) — a middle-class / working-renter tenant base. Strengths: cost of living A+, housing A+, crime A-; Watch: employment D, amenities F, commute F.
- Farmersville ISD (town): math 38% / reading 47% proficiency, ranked #298 of 826 in TX (top 36%) — families likely to look elsewhere, expect single-tenant / working-renter base with shorter leases.
- Zoned schools: Tatum El (519 students, 64% FRL) — zoned schools average 64% FRL vs 42% district-wide (22 pts higher); higher-poverty schools than district average — tighter screening recommended.
- Market conditions: 418 active listings in the ZIP; 9 comparable units currently listed for rent nearby; rentals at typical pace (median 20d on market — plan ~3-4 weeks tenant-placement turnaround); solid renter incomes; 19,194 units permitted in Collin County in 2024 (3,988 in 5+ unit buildings).
Forward outlook
- Local home prices are declining (-3.0%/yr); year-one equity from $2k of loan paydown is wiped out by about $8k of value loss. Plan a longer hold.
- Collin County population projected at +60% by 2050 — long-run rental-demand tailwind backs the buy-and-hold thesis.
Negotiation context
- Only 7 days on market — expect competitive offers; lowballing is unlikely to land.
Risks & watch-outs
- Climate carrying-cost: major wind risk, 27% chance of damaging wind over 30y; extreme-heat days projected 7→24/yr by 2055 (HVAC capex compounding) — expect insurance premiums to compound above CPI over the hold.
Questions for the listing agent
- What do current leases actually rent for vs. the listed asking? Can we see a recent rent roll and the last 12 months of T-12 income?
- What does the HOA fee cover, when was the last increase, and are there any pending special assessments or reserve-fund shortfalls?
- Is there a deadline driving the sale (1031 exchange, divorce, estate, relocation)? That informs how much negotiation room exists.
- The area grade is low — what's the realistic commute time and amenity access for the typical tenant pool here? Any planned neighborhood developments (good or bad) we should know about?
- What's the average days-on-market for RENTAL listings here right now (not sales)? A rising rental-DOM trend means longer vacancies and softer asking-rent achievability than the comps imply.
- What's the recent tenant-quality profile in this submarket — average credit score on applications, eviction rate, late-payment / NSF rate, and stable-employment percentage? A property-management company in the area should have these aggregated.
- How much new for-sale + rental construction is in the pipeline within 1–3 miles? Heavy new supply typically softens prices + rents 12–24 months out; constrained supply supports both.
Investment metrics
- 1% rule
- 0.82% ✗
- Cap rate
- 5.49%
- Cash-on-cash
- -2.86%
- DSCR
- 0.87
- GRM
- 10.2
CMA / ARV
- ARV (median comp)
- $282,374
- List price
- $259,889
- Delta
- -7.96%
- Verdict
- FAIR
- Comps
- 20 within 1.0 mi
Show comp detail 12 sales within ~0.75 mi
| Address | Dist | Beds/Ba | Sqft | Sold | Price | $/sf | Match |
|---|---|---|---|---|---|---|---|
| 3605 Bridgeport Dr | 0.07mi | 4/2.0 | 1,550 (0%) | 2mo | $253,389 | $163 | 95 |
| 3611 Bridgeport Dr | 0.09mi | 4/2.0 | 1,550 (0%) | 1mo | $264,889 | $171 | 95 |
| 4012 Bass Dr | 0.10mi | 4/2.0 | 1,550 (0%) | 1mo | $262,889 | $170 | 94 |
| 3607 Bonham Dr | 0.11mi | 4/2.0 | 1,550 (0%) | 1mo | $261,889 | $169 | 94 |
| 3607 Bridgeport Dr | 0.08mi | 3/2.0 (-1) | 1,498 (-3%) | 2mo | $234,435 | $156 | 84 |
| 4014 Bass Dr | 0.09mi | 3/2.0 (-1) | 1,498 (-3%) | 3mo | $250,435 | $167 | 83 |
| 3150 Texoma Blvd | 0.37mi | 4/2.0 | 1,550 (0%) | 2mo | $250,889 | $162 | 81 |
| 4013 Worth Dr | 0.37mi | 4/2.0 | 1,550 (0%) | 2mo | $244,389 | $158 | 81 |
| 4127 Lavon Dr | 0.41mi | 4/2.0 | 1,550 (0%) | 1mo | $248,889 | $161 | 80 |
| 4009 Joe Pool Dr | 0.28mi | 3/2.0 (-1) | 1,659 (+7%) | 1mo | $265,644 | $160 | 70 |
| 3110 Texoma Blvd | 0.44mi | 3/2.0 (-1) | 1,478 (-5%) | 1mo | $242,190 | $164 | 66 |
| 3904 Falcon Dr | 0.59mi | 3/2.0 (-1) | 1,628 (+5%) | 2mo | $269,990 | $166 | 58 |
Match score weights: distance 35% · size 25% · config 20% · recency 20%. Top-matched comps best support the ARV.
Projected returns pro-forma
-3.0% appreciation · 3.0% rent growth · sell at horizon
- IRR
- -21.0%
- Equity multiple
- 0.27×
- Total profit
- $-53,100
- Equity at exit
- $38,750
- IRR
- -14.4%
- Equity multiple
- 0.17×
- Total profit
- $-60,189
- Equity at exit
- $22,470
Cash invested: $72,769 (down + closing). Projections, not guarantees.
Landlord ↔ Tenant lean methodology
- Overall (STATE)
- 87 Strongly Landlord-Friendly
- State Texas
- 87 Strongly Landlord-Friendly · R+5
- County
- — inherits STATE
- City
- — inherits STATE
ZIP-level market 75442
- Home prices YoY
- -8.3%
- Active inventory
- 418
- Price-to-rent
- 10.2×
Monthly cashflow live
- Estimated rent
- $2,133 high interval (Pro) →
- Mortgage (P&I)
- −$1,363
- Tax est. 1.5%
- −$325 /mo · $3,898/yr
- Insurance
- −$108
- HOA
- −$63
- Vacancy / Maint / Mgmt
- −$448
- Net cashflow
- $-174
Break-even live
Sensitivity live
| Price | -10% $6 | -5% $-84 | +0% $-174 | +5% $-263 | +10% $-353 |
|---|---|---|---|---|---|
| Rent | -10% $-342 | -5% $-258 | +0% $-174 | +5% $-89 | +10% $-5 |
| Rate | -1.0pp $-43 | -0.5pp $-108 | base $-174 | +0.5pp $-241 | +1.0pp $-309 |
UW: 25.0% down · 7.5% · 30yr · 1.5% tax · 5.0% vac · 8.0% maint · 8.0% mgmt
Financing live
Cash to close
- Down payment
- $64,972
- Closing costs
- $7,797
- Reserves months
- —
- Total cash needed
- —
Loan-product check · same deal, 3 products live
Conventional
25% down · 7.5% · 30yr
- Down + closing
- —
- Monthly P&I
- —
- Monthly cashflow
- —
- DSCR
- —
- Eligible?
- —
Personal DTI + credit; lowest rate.
DSCR
20% down · 8.5% · 30yr
- Down + closing
- —
- Monthly P&I
- —
- Monthly cashflow
- —
- DSCR
- —
- Eligible?
- —
No personal income docs; deal must DSCR.
Hard money
10% down · 12.0% · 12mo
- Down + closing
- —
- Monthly P&I
- —
- Monthly cashflow
- —
- DSCR
- —
- Eligible?
- —
Short-term bridge; refi at stabilization.
Rent comps 9 comps
| Address | Beds | Baths | Sqft | Rent | $/sqft | DOM | Units | Dist |
|---|---|---|---|---|---|---|---|---|
| 3720 Canyon Dr Farmersville, TX | 4.0 | 3.0 | 2059 | $2,150 | $1.04 | 19d | 1 | 0.27mi |
| 3713 Canyon Dr Farmersville, TX | 4.0 | 3.0 | 2059 | $2,150 | $1.04 | 12d | 1 | 0.27mi |
| 3138 Texoma Blvd Farmersville, TX | 4.0 | 2.0 | 1550 | $1,850 | $1.19 | 25d | 1 | 0.36mi |
| 3815 Cisco Dr Farmersville, TX | 3.0 | 2.5 | 1589 | $2,000 | $1.26 | 19d | 1 | 0.37mi |
| 3705 Ray Roberts Dr Farmersville, TX | 4.0 | 2.0 | 1803 | $2,195 | $1.22 | 19d | 1 | 0.38mi |
| 3619 Chambers Dr Farmersville, TX | 3.0 | 2.0 | 1311 | $1,750 | $1.33 | 8d | 1 | 0.43mi |
| 3906 Mill Creek Dr Farmersville, TX | 4.0 | 3.0 | 2059 | $2,095 | $1.02 | 44d | 1 | 0.44mi |
| 3916 White Rock Dr Unit NA Farmersville, TX | 3.0 | 2.5 | 1585 | $1,996 | $1.26 | 44d | 1 | 0.45mi |
| 3916 Nasworthy Dr Farmersville, TX | 4.0 | 2.5 | 2071 | $2,400 | $1.16 | 0d | 1 | 0.67mi |
HOA detail
- Monthly dues
- $63 · $756/yr
Listing history 2 events
-
2026-05-11status Pending 718-char remark
-
2026-05-04$259,889 Active 718-char remark
ⓘ Source: listings_history table (triggers on properties + properties_extension) + one-shot
backfill from property_details.listing_events for pre-trigger history.
Climate risk First Street
- Flood 1/10 Low FEMA zone X (unshaded) · 0% chance over 30 yrs
- Wildfire 3/10 Moderate
- Heat 8/10 Severe 7 d/yr ≥111°F today · 24 d/yr by 30 yrs out
- Wind 6/10 Major 27% chance of damaging wind over 30 yrs
- Air quality 2/10 Low 2 unhealthy d/yr today · 2 by 30 yrs out
Nearby sold comps map
Loading sold comps map…
Walkable amenities ~0.75 mi
Loading nearby amenities…
Taxation est. · year 1
- Rental income
- $25,601
- − Mortgage interest
- −$14,558
- − Property taxes
- −$3,898
- − Insurance
- −$1,299
- − Repairs & maintenance
- −$2,048
- − Management
- −$2,048
- − HOA
- −$756
- − Depreciation
- −$7,560
- Taxable loss
- −$6,567
- Est. tax savings @ 24.0%
- +$1,576
- After-tax cash flow
- $-507/yr
For passive investors: Depreciation is non-cash, so a rental often shows a tax loss while cash-flowing — sheltering income. Rental losses are passive: they offset passive income freely, and up to $25,000/yr can offset ordinary (W-2) income if you actively participate and your MAGI is under $100k (phasing out to $0 by $150k); unused losses carry forward. On sale, claimed depreciation is recaptured at up to 25%, and gains may owe capital-gains tax (a 1031 exchange can defer both). Figures are a year-1 estimate at your 24.0% rate — not tax advice; consult a CPA.
Condition & rehab AI · 12 photos
This brand-new, energy-efficient home is move-in ready with excellent condition and no visible repairs needed. Potential buyers will appreciate the curb appeal and energy savings.
Value-add opportunities
- Resale Painting exterior siding — Enhances curb appeal
- Resale Landscaping improvements — Enhances curb appeal
- Both Add smart home features — Improves energy efficiency and convenience
Renovation cost estimate screening
Value-add ROI direction
- Resale Painting exterior siding — Enhances curb appeal ↑
- Resale Landscaping improvements — Enhances curb appeal ↑
- Both Add smart home features — Improves energy efficiency and convenience ↑
ⓘ Cost ranges are severity-bucket heuristics (US national rule-of-thumb). Get contractor quotes + a written scope before underwriting a rehab budget.
Schools (NCES district)
- District
- Farmersville ISD
- NCES district ID
- 4819080
- Math proficiency
- 38% ▼ -16.00%
- Reading proficiency
- 47% ▼ -7.00%
- Median HH income
- $56,626
- Composite
- 37.17/100
- National rank
- #4479
- State rank
- #298 of 826 in TX
Livability — Farmersville
- Score
- 69/100
- State rank
- #425
- US rank
- #8723
Category grades
Schools grade is shown separately in the Schools card above.
Census & demographics
- County
- Collin County · 1,159,394 people
- City population
- 10,805
- Metro
- Dallas-Fort Worth-Arlington, TX
- Population (ZIP)
- 10,805
- Household income
- $95,250
- Rent vs Own
- Severe rent burden
- 105.0
Population outlook (Collin County) Hauer SSP2
- Today (2025)
- 1,210,074 people
- By 2030
- 1,358,201 · +12.2%
- By 2040
- 1,654,061 · +36.7%
- By 2050
- 1,937,359 · +60.1%
- By 2075
- 2,567,039 · +112.1%
- By 2100
- 2,952,048 · +144.0%
Race, ethnicity, and origin ACS 2023
- Neighborhood character
- Predominantly White (65%)
- Race & ethnicity
- White 65% Hispanic / Latino 25% Two or more races 13% Black 5% Pacific Islander 2%
- Hispanic origin (detail)
- Mexican 20% Puerto Rican 5%
- Common ancestry
- Italian 3% Serbian 2% Romanian 2%
- Foreign-born
- 5% · Canada
- Languages at home
- 84% English-only · Spanish 14% German/W. Germanic 1%
Political lean MEDSL · Collin
- 2024 margin
- R (+11.1) · D 43.1% · R 54.3% · Other 2.6%
- 2008→2024 swing
- +14.4pp toward D · 2008: -25.6pp · 2024: -11.1pp
- All cycles
- 2024: R+11.1 2020: R+4.3 2016: R+17.0 2012: R+31.6 2008: R+25.6
Not yet ingested
- Civics
- —
Market trends
- HPI YoY
- ▼ -27.67%
- Current HPI
- 304.6738
- Rent YoY
- —
- Metro
- Dallas-Fort Worth-Arlington, TX
- State GDP YoY
- ▲ 3.95%
- F500 in state
- 110
Industry mix (Fortune 500 HQ in TX)
| Industry | F500 HQs | Revenue |
|---|---|---|
| Energy | 16 | $1,198B |
|
||
| Technology | 5 | $198B |
|
||
| Engineering / Construction | 4 | $72B |
|
||
| Energy Services | 3 | $60B |
|
||
| Utilities | 3 | $41B |
|
||
| Healthcare | 2 | $330B |
|
||
Price history
2 events — show timeline
- 2026-05-11 Pending — NTREIS
- 2026-05-04 Listed $259,889 NTREIS
Cash-flow waterfall
monthlySold comps — $/sqft
last 12 mo · ≤1 miLoading sold comps…