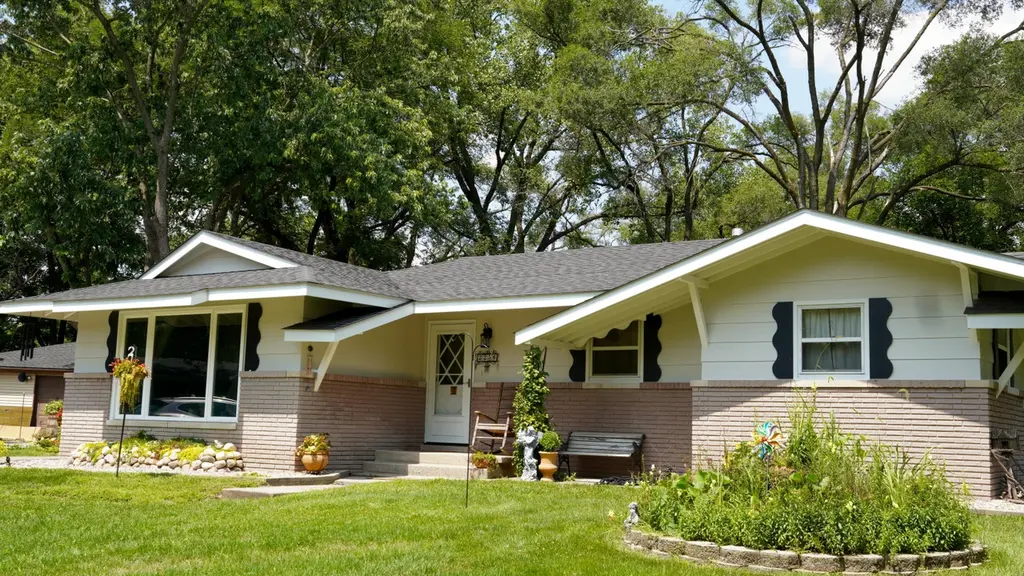
2256 W 57th Pl · Merrillville, IN
Flood risk 1/10 · Minimal
- FEMA flood zone
- X (unshaded)
- Chance of flooding over 30 yrs
- 0.0%
- Est. flood insurance / yr
- $473 – $860
Fire risk 1/10 · Minimal
- Est. fire insurance / yr
- $717 – $1,331
Heat risk 2/10 · Minimal
- Hot days now (above 101°F)
- 7 days/yr
- Hot days in 30 yrs
- 15 days/yr
Wind risk 2/10 · Minimal
- Chance of severe wind over 30 yrs
- 0.0%
Air-quality risk 3/10 · Minor
- Unhealthy air days now
- 2 days/yr
- Unhealthy air days in 30 yrs
- 3 days/yr
Risk factors via First Street. Map © Google.
Why this score? — see what drove the F grade
The composite is a weighted blend of 9 inputs, each scored 0–100. Each bar is that input's sub-score; the figure is the points it added to the 100-point composite (weight × sub-score).
- Cash flow +9.0/30.0
- Livability +3.8/5.0
- Rent growth +3.5/5.0
- Schools +2.6/10.0
- DSCR +2.5/10.0
- Condition / age +2.5/5.0
- 1% rule +1.6/10.0
- ARV discount +0.0/15.0
- Appreciation +0.0/10.0
$276,000
🖨 Deal sheet 📄 Offer letter ✓ Due diligence
Listing remarks
Come see what the heart of NW Indiana has to offer. This beautiful Merrillville home is located in the quiet neighborhood of Wright Manor. This family home has 3 bedrooms, 2 baths, large back yard, and full basement. Large 2.5 car garage. A dry bar in the basement, perfect for any get together with family or friends. Come visit this home and vision what is possible. This property is being sold AS-IS.
Key facts
- Dry bar
- Full basement
- Large back yard
Tags
Property features AI
Exterior
- Parking: Detached garage; Driveway parking; Concrete driveway; Approximately 2.5 garage spaces
- Utilities: Electricity connected with circuit breakers; Public water; Public sewer; Natural gas connected
- Home design: One-level home; Built in 1966
- Construction: Brick and wood siding exterior; Asphalt roof; Full basement with storage space
- Exterior features: Neighborhood view; Wood-frame windows; Exterior lighting; Shed(s)
Interior
- Kitchen: Electric cooktop; Microwave
- Bedrooms: Primary bedroom; At least two additional bedrooms (Bedroom 2, Bedroom 3); Bonus room
- Flooring: Hardwood floors; Concrete floors; Tile floors
- Bathrooms: 2 full bathrooms
- Heating & cooling: Central air conditioning; Forced air heating; Natural gas heating; Hot water heating
- Interior features: Other interior features; Lighting
- Laundry & utility: Laundry room with washer hookup; Gas dryer hookup; Laundry sink; Lower-level laundry
Neighborhood map
What this means for you Summary
Snapshot
- This is a 3-bed/2.0-bath single-family listed at $276k.
Deal economics
- At list price, monthly cash flow is $-219 ($-3k/yr) — negative.
- To cash-flow at today's rent, offer at most $237k (14.0% below list).
- To meet the 1% rule (rent ≥ 1% of price), the offer needs to be $183k (33.6% below list).
- Recommended offer: $183k (33.6% below list) — sets the bar for 1% rule.
Location & tenants
- Location reads 76/100 on livability (#50 in IN, #3,393 nationally) — a middle-class / working-renter tenant base. Strengths: commute A+, cost of living A+, housing A+; Watch: amenities F, health & safety D-.
- Merrillville Community School Corporation (suburban): math 22% / reading 36% proficiency, ranked #240 of 301 in IN (top 80%) — low school quality limits family demand, transient renter base, plan for 1-2y turnover.
- Zoned schools: Edgar L Miller Elementary School (math 17% / reading 12%, grade F, #862 of 994 statewide, top 88%, 351 students, 81% FRL); Merrillville Intermediate School (math 25% / reading 36%, grade F, #203 of 330 statewide, top 63%, 855 students, 71% FRL); Merrillville High School (math 19% / reading 55%, grade F, #247 of 369 statewide, top 70%, 2,042 students, 64% FRL) — zoned schools average 72% FRL vs 50% district-wide (22 pts higher); higher-poverty schools than district average — tighter screening recommended.
- Market conditions: Rents rising fast (+4.1%/yr); 264 active listings in the ZIP; 6 comparable units currently listed for rent nearby; rentals leasing fast (median 2d on market — plan ~1-2 weeks tenant-placement turnaround); 1,642 units permitted in Lake County in 2024 (14 in 5+ unit buildings).
- This rent runs 34% of the median local income ($64k/yr) — at the standard rent-burdened threshold; future hikes will face affordability resistance.
Forward outlook
- Local home prices are declining (-3.0%/yr); year-one equity from $2k of loan paydown is wiped out by about $8k of value loss. Plan a longer hold.
- Lake County population projected to shrink 7% by 2050 — rents likely to lag national; underwrite the cash flow, not the appreciation.
Negotiation context
- Only 2 days on market — expect competitive offers; lowballing is unlikely to land.
- 3 sale attempts since 28y ago with the ask held roughly flat each time — persistent listings suggest the price (not the market) is what's stuck; bring a comps-based counter.
Questions for the listing agent
- What do current leases actually rent for vs. the listed asking? Can we see a recent rent roll and the last 12 months of T-12 income?
- Built in 1966 — when were the roof, HVAC, electrical panel, plumbing, and water heater last replaced?
- Is there a deadline driving the sale (1031 exchange, divorce, estate, relocation)? That informs how much negotiation room exists.
- Schools are D-rated, which usually means shorter tenancies and higher turnover. Who's the typical renter profile here, and what's been the actual vacancy rate?
- The area grade is low — what's the realistic commute time and amenity access for the typical tenant pool here? Any planned neighborhood developments (good or bad) we should know about?
- What's the average days-on-market for RENTAL listings here right now (not sales)? A rising rental-DOM trend means longer vacancies and softer asking-rent achievability than the comps imply.
- What's the recent tenant-quality profile in this submarket — average credit score on applications, eviction rate, late-payment / NSF rate, and stable-employment percentage? A property-management company in the area should have these aggregated.
- How much new for-sale + rental construction is in the pipeline within 1–3 miles? Heavy new supply typically softens prices + rents 12–24 months out; constrained supply supports both.
Investment metrics
- 1% rule
- 0.66% ✗
- Cap rate
- 5.34%
- Cash-on-cash
- -3.41%
- DSCR
- 0.85
- GRM
- 12.5
CMA / ARV
- ARV (on-the-fly)
- $219,672
- Comps found
- 9
Show comp detail 9 sales within ~0.75 mi
| Address | Dist | Beds/Ba | Sqft | Sold | Price | $/sf | Match |
|---|---|---|---|---|---|---|---|
| 5847 Taft Pl | 0.18mi | 3/1.5 | 1,374 (+1%) | 10mo | $245,000 | $178 | 79 |
| 5910 Arthur St | 0.35mi | 3/2.0 | 1,352 (-0%) | 5mo | $155,000 | $115 | 79 |
| 1851 W 58th Pl | 0.34mi | 3/2.0 | 1,302 (-4%) | 13mo | $222,000 | $171 | 67 |
| 5845 Roosevelt St | 0.20mi | 3/1.0 | 1,232 (-9%) | 12mo | $220,000 | $179 | 61 |
| 1720 W 54th Ave | 0.58mi | 3/2.0 | 1,400 (+3%) | 8mo | $160,000 | $114 | 61 |
| 5951 Hayes Pl | 0.46mi | 3/1.0 | 1,487 (+10%) | 7mo | $260,000 | $175 | 53 |
| 1670 W 61st Pl | 0.58mi | 3/1.0 | 1,226 (-10%) | 2mo | $169,900 | $139 | 52 |
| 6201 Hayes St | 0.68mi | 2/1.0 (-1) | 1,390 (+2%) | 7mo | $220,800 | $159 | 49 |
| 5397 Cleveland St | 0.58mi | 3/1.5 | 1,538 (+13%) | 1mo | $249,000 | $162 | 48 |
Match score weights: distance 35% · size 25% · config 20% · recency 20%. Top-matched comps best support the ARV.
Projected returns pro-forma
-3.0% appreciation · 4.1% rent growth · sell at horizon
- IRR
- -21.0%
- Equity multiple
- 0.27×
- Total profit
- $-56,762
- Equity at exit
- $41,152
- IRR
- -12.5%
- Equity multiple
- 0.23×
- Total profit
- $-59,290
- Equity at exit
- $23,863
Cash invested: $77,280 (down + closing). Projections, not guarantees.
Landlord ↔ Tenant lean methodology
- Overall (STATE)
- 90 Strongly Landlord-Friendly
- State Indiana
- 90 Strongly Landlord-Friendly · R+11
- County
- — inherits STATE
- City
- — inherits STATE
ZIP-level market 46410
- Rents YoY
- 4.1%
- Active inventory
- 264
- Price-to-rent
- 12.5×
Monthly cashflow live
- Estimated rent
- $1,834 high interval (Pro) →
- Mortgage (P&I)
- −$1,447
- Tax from tax record
- −$106 /mo · $1,270/yr
- Insurance
- −$115
- HOA
- −$0
- Vacancy / Maint / Mgmt
- −$385
- Net cashflow
- $-219
Break-even live
UW: 25.0% down · 7.5% · 30yr · 1.5% tax · 5.0% vac · 8.0% maint · 8.0% mgmt
Financing live
Cash to close
- Down payment
- $69,000
- Closing costs
- $8,280
- Reserves months
- —
- Total cash needed
- —
Loan-product check · same deal, 3 products live
Conventional
25% down · 7.5% · 30yr
- Down + closing
- —
- Monthly P&I
- —
- Monthly cashflow
- —
- DSCR
- —
- Eligible?
- —
Personal DTI + credit; lowest rate.
DSCR
20% down · 8.5% · 30yr
- Down + closing
- —
- Monthly P&I
- —
- Monthly cashflow
- —
- DSCR
- —
- Eligible?
- —
No personal income docs; deal must DSCR.
Hard money
10% down · 12.0% · 12mo
- Down + closing
- —
- Monthly P&I
- —
- Monthly cashflow
- —
- DSCR
- —
- Eligible?
- —
Short-term bridge; refi at stabilization.
Rent comps 6 comps
| Address | Beds | Baths | Sqft | Rent | $/sqft | DOM | Units | Dist |
|---|---|---|---|---|---|---|---|---|
| 3190 W 63rd Ln Merrillville, IN | 3.0 | 2.0 | 1667 | $2,600 | $1.56 | 4d | 1 | 0.86mi |
| 910 W 56th Ave Merrillville, IN | 4.0 | 1.5 | 1431 | $1,825 | $1.28 | 1d | 1 | 0.95mi |
| 1240 W 52nd Dr Merrillville, IN | 2.0 | 1.0–2.0 | 957 | $1,349 | $1.41 | 1d | 9 | 1.05mi |
| 5719 Van Buren St Merrillville, IN | 3.0 | 2.0 | 950 | $1,500 | $1.58 | 22d | 1 | 1.07mi |
| 5005 Chase St Gary, IN | 3.0 | 2.0 | 1142 | $1,400 | $1.23 | 1d | 1 | 1.12mi |
| 505 W 53rd Ave Merrillville, IN | 4.0 | 2.0 | 1650 | $1,650 | $1.00 | 1d | 1 | 1.34mi |
Listing history 5 events
-
2026-05-10status Pending
-
2026-05-08$276,000 Active
-
2025-08-25historical
-
2025-08-19$276,400 Active
-
1998-10-06$99,900
ⓘ Source: listings_history table (triggers on properties + properties_extension) + one-shot
backfill from property_details.listing_events for pre-trigger history.
Tax reassessment forecast IN · Partial reset (capped growth)
- Current annual tax
- $1,270 · $106/mo
- Projected year-2 tax
- $1,808 · $151/mo
- Expected delta
- +$538/yr (+$45/mo · 42.3%)
ⓘ Screening estimate from a state-policy table — verify with the county assessor before closing.
Climate risk First Street
- Flood 1/10 Low FEMA zone X (unshaded) · 0% chance over 30 yrs
- Wildfire 1/10 Low
- Heat 2/10 Low 7 d/yr ≥101°F today · 15 d/yr by 30 yrs out
- Wind 2/10 Low 0% chance of damaging wind over 30 yrs
- Air quality 3/10 Moderate 2 unhealthy d/yr today · 3 by 30 yrs out
Nearby sold comps map
Loading sold comps map…
Walkable amenities ~0.75 mi
Loading nearby amenities…
Taxation est. · year 1
- Rental income
- $22,008
- − Mortgage interest
- −$15,460
- − Property taxes
- −$1,270
- − Insurance
- −$1,380
- − Repairs & maintenance
- −$1,761
- − Management
- −$1,761
- − Depreciation
- −$8,029
- Taxable loss
- −$7,653
- Est. tax savings @ 24.0%
- +$1,837
- After-tax cash flow
- $-796/yr
For passive investors: Depreciation is non-cash, so a rental often shows a tax loss while cash-flowing — sheltering income. Rental losses are passive: they offset passive income freely, and up to $25,000/yr can offset ordinary (W-2) income if you actively participate and your MAGI is under $100k (phasing out to $0 by $150k); unused losses carry forward. On sale, claimed depreciation is recaptured at up to 25%, and gains may owe capital-gains tax (a 1031 exchange can defer both). Figures are a year-1 estimate at your 24.0% rate — not tax advice; consult a CPA.
Schools (NCES district)
- District
- Merrillville Community School Corporation
- NCES district ID
- 1809690
- Math proficiency
- 22% ▼ -17.00%
- Reading proficiency
- 36% ▼ -8.00%
- Median HH income
- $54,401
- Composite
- 25.74/100
- National rank
- #7375
- State rank
- #240 of 301 in IN
Livability — Merrillville
- Score
- 76/100
- State rank
- #50
- US rank
- #3393
Category grades
Schools grade is shown separately in the Schools card above.
Census & demographics
- Census place
- Merrillville, IN
- County
- Lake County · 422,878 people
- City population
- 39,243
- Metro
- Chicago-Naperville-Elgin, IL-IN-WI
- Population (ZIP)
- 39,243
- Household income
- $64,127
- Rent vs Own
- Severe rent burden
- 1644.0
Population outlook (Lake County) Hauer SSP2
- Today (2025)
- 484,026 people
- By 2030
- 478,091 · -1.2%
- By 2040
- 462,974 · -4.3%
- By 2050
- 449,894 · -7.1%
- By 2075
- 436,169 · -9.9%
- By 2100
- 426,607 · -11.9%
Race, ethnicity, and origin ACS 2023
- Neighborhood character
- Diverse neighborhood (Simpson 0.66)
- Race & ethnicity
- Black 46% White 32% Hispanic / Latino 16% Two or more races 9% Asian 2%
- Hispanic origin (detail)
- Mexican 11% Puerto Rican 3%
- Common ancestry
- Romanian 4% Iranian 2% Italian 1%
- Foreign-born
- 7% · Canada
- Languages at home
- 88% English-only · Spanish 7% Other Indo-European 2%
Political lean MEDSL · Lake
- 2024 margin
- Lean D (+5.6) · D 52.1% · R 46.5% · Other 1.5%
- 2008→2024 swing
- -28.6pp toward R · 2008: 34.3pp · 2024: 5.6pp
- All cycles
- 2024: D+5.6 2020: D+15.1 2016: D+20.6 2012: D+31.0 2008: D+34.3
Not yet ingested
- Civics
- —
Market trends
- HPI YoY
- ▼ -180.11%
- Current HPI
- 240.8833
- Rent YoY
- ▲ 4.10%
- Metro
- Chicago-Naperville-Elgin, IL-IN-WI
- State GDP YoY
- ▲ 2.90%
- F500 in state
- 18
Industry mix (Fortune 500 HQ in IN)
| Industry | F500 HQs | Revenue |
|---|---|---|
| Industrial Machinery | 2 | $37B |
|
||
| Healthcare | 1 | $177B |
|
||
| Pharmaceuticals | 1 | $45B |
|
||
| Metals / Steel | 1 | $18B |
|
||
| Agriculture | 1 | $17B |
|
||
| Packaging | 1 | $12B |
|
||
Price history
+176.3% since first listed5 events — show timeline
- 2026-05-10 Pending — NIRA MLS as Distributed by MLS Grid
- 2026-05-08 Listed $276,000 NIRA MLS as Distributed by MLS Grid
- 2025-08-25 Listing Removed — NIRA MLS as Distributed by MLS Grid
- 2025-08-19 Listed $276,400 NIRA MLS as Distributed by MLS Grid
- 1998-10-06 Listed $99,900 NIRA MLS as Distributed by MLS Grid
Property tax history
+1.5%/yrLatest (2024): $1,270 · +7.6% YoY. Source: county tax records.
Cash-flow waterfall
monthlySold comps — $/sqft
last 12 mo · ≤1 miLoading sold comps…