 🏗️ New Construction
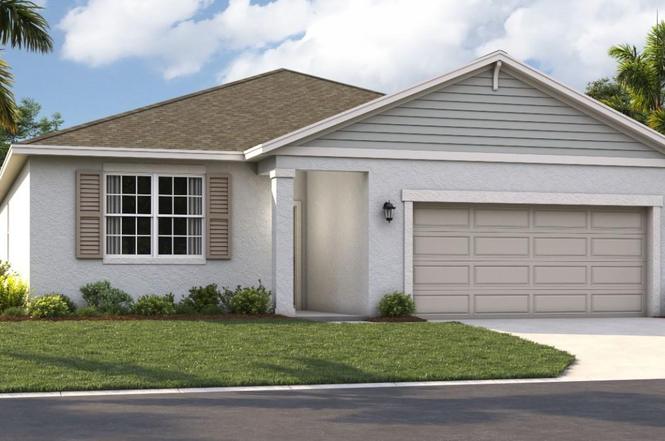
1739 Blue Lagoon Cir · Mascotte, FL
Flood risk No data
- FEMA flood zone
- —
- Chance of flooding over 30 yrs
- —
- Est. flood insurance / yr
- —
Fire risk No data
- Est. fire insurance / yr
- —
Heat risk No data
- Hot days now (above threshold)
- —
- Hot days in 30 yrs
- —
Wind risk No data
- Chance of severe wind over 30 yrs
- —
Air-quality risk No data
- Unhealthy air days now
- —
- Unhealthy air days in 30 yrs
- —
Risk factors via First Street. Map © Google.
Why this score? — see what drove the D+ grade
The composite is a weighted blend of 9 inputs, each scored 0–100. Each bar is that input's sub-score; the figure is the points it added to the 100-point composite (weight × sub-score).
- Cash flow +10.2/30.0
- Appreciation +10.0/10.0
- ARV discount +7.5/15.0
- Schools +4.2/10.0
- Livability +3.6/5.0
- DSCR +2.9/10.0
- Rent growth +2.5/5.0
- Condition / age +2.5/5.0
- 1% rule +2.0/10.0
$356,490
🖨 Deal sheet 📄 Offer letter ✓ Due diligence
Listing remarks
One or more photo(s) has been virtually staged. Under Construction. * * FINAL OPPORTUNITY * * Conveniently located with easy access to SR 50 and SR 17, Sunset Lakes Estates is just a short drive from downtown Clermont and Mount Dora, where you can enjoy delicious restaurants, shopping, or fun on Lake Apopka with friends and family. If you're looking for big-city excitement and entertainment, you're only 45 minutes from downtown Orlando, Disney World, or Universal Studios. Your new home awaits in Lake County! Contact us today to schedule a showing! * * FINAL OPPORTUNITY * * The Seaton is the perfect single-family home for all homebuyers. Step out of your front door or two-car garag
Key facts
- Large covered patio
- Easy access to sr 50
- Easy access to sr 17
Tags
Property features AI
Finance
- Other: Home warranty provided; Builder-provided living area and building area measurements; Total lot size approximately 0.12 acre (110 x 50)
- Financial info: Lease restrictions apply
- HOA & community: HOA managed by EDISON ASSOCIATION MANAGEMENT; Monthly HOA fee $82.50 (includes grounds maintenance); Deed restrictions apply; Pets allowed
Exterior
- Parking: Covered driveway parking; Attached 2-car garage (20x20)
- Security: Smoke detectors
- Utilities: Public water; Public sewer; Cable connected; Electricity connected; Phone available; Water connected; Sewer connected
- Home design: Single family residence; Under construction (projected completion March 2026); One story; North-facing
- Construction: Block, stone, stucco and vinyl siding construction; Shingle roof; Slab foundation; New construction by Stanley Martin Homes (Seaton N model)
- Exterior features: Covered patio; Front porch; Patio; Outdoor lighting; Sidewalks; Sliding doors; Irrigation equipment; Cleared and landscaped lot; Paved road access
Interior
- Kitchen: Dishwasher; Disposal; Microwave; Range; Refrigerator; Eat-in kitchen
- Bedrooms: 4 bedrooms
- Flooring: Carpet; Ceramic tile
- Bathrooms: 3 full bathrooms
- Heating & cooling: Central heating; Electric heating; Natural gas heating; Central air conditioning
- Interior features: Eat-in kitchen; Kitchen/family room combo; Living room/dining room combo; Open floorplan; Thermostat; Walk-in closets; Double pane windows; ENERGY STAR qualified windows; Dishwasher; Disposal; Microwave; Range; Refrigerator
- Laundry & utility: Washer hookup; Electric dryer hookup; Laundry located inside; Inside utility / great room area
Neighborhood map
What this means for you Summary
Snapshot
- This is a 4-bed/3.0-bath land listed at $356k.
Deal economics
- At list price, monthly cash flow is $-204 ($-2k/yr) — negative.
- To cash-flow at today's rent, offer at most $320k (10.1% below list).
- To meet the 1% rule (rent ≥ 1% of price), the offer needs to be $248k (30.4% below list).
- Recommended offer: $248k (30.4% below list) — sets the bar for 1% rule.
Location & tenants
- Location reads 71/100 on livability (#405 in FL) — a middle-class / working-renter tenant base. Strengths: cost of living A+, housing A+, health & safety A+; Watch: amenities F, commute F.
- Lake (suburban): math 49% / reading 50% proficiency, ranked #37 of 73 in FL (top 51%) — families likely to look elsewhere, expect single-tenant / working-renter base with shorter leases.
- Zoned schools: Groveland Elementary School (math 30% / reading 32%, grade F, #1,854 of 2,144 statewide, top 87%, 744 students, 63% FRL); South Lake High School (math 36% / reading 39%, grade F, #336 of 667 statewide, top 51%, 2,169 students, 40% FRL) — zoned schools at 52% FRL track the district average.
- Zoned-school proficiency averages 34% at this address vs 50% district-wide (-15 pts) — the specific schools serving this property underperform the Lake average; the district grade overstates school quality for this exact location.
- Market conditions: 98 active listings in the ZIP; 11 comparable units currently listed for rent nearby; rentals at typical pace (median 24d on market — plan ~3-4 weeks tenant-placement turnaround); solid renter incomes; 4,799 units permitted in Lake County in 2024 (814 in 5+ unit buildings).
- This rent runs 36% of the median local income ($84k/yr) — at the standard rent-burdened threshold; future hikes will face affordability resistance.
Forward outlook
- In year one you build about $38k of equity ($2k loan paydown + $36k appreciation (10.0% local appreciation)).
- Lake County population projected at +37% by 2050 — long-run rental-demand tailwind backs the buy-and-hold thesis.
- By year 2, paydown + projected appreciation supports a ~$61k cash-out refi (75% LTV) — recoverable capital for the next deal without selling this one.
Negotiation context
- It's been on market 161 days — a 12% lower offer ($314k) is reasonable based on typical stale-listing flexibility.
Questions for the listing agent
- What do current leases actually rent for vs. the listed asking? Can we see a recent rent roll and the last 12 months of T-12 income?
- It's been on market 161 days. Have you received any prior offers? Is the seller open to a 30% concession, seller financing, or rate buy-down credit?
- What does the HOA fee cover, when was the last increase, and are there any pending special assessments or reserve-fund shortfalls?
- Why hasn't it sold? Are there any deal-killer items the seller is aware of (foundation, flood, title, zoning, code violations)?
- Is there a deadline driving the sale (1031 exchange, divorce, estate, relocation)? That informs how much negotiation room exists.
- Schools are D-rated, which usually means shorter tenancies and higher turnover. Who's the typical renter profile here, and what's been the actual vacancy rate?
- The area grade is low — what's the realistic commute time and amenity access for the typical tenant pool here? Any planned neighborhood developments (good or bad) we should know about?
- What's the average days-on-market for RENTAL listings here right now (not sales)? A rising rental-DOM trend means longer vacancies and softer asking-rent achievability than the comps imply.
- What's the recent tenant-quality profile in this submarket — average credit score on applications, eviction rate, late-payment / NSF rate, and stable-employment percentage? A property-management company in the area should have these aggregated.
- How much new for-sale + rental construction is in the pipeline within 1–3 miles? Heavy new supply typically softens prices + rents 12–24 months out; constrained supply supports both.
Investment metrics
- 1% rule
- 0.70% ✗
- Cap rate
- 5.61%
- Cash-on-cash
- -2.45%
- DSCR
- 0.89
- GRM
- 12.0
CMA / ARV
No comps found within radius.
Projected returns pro-forma
10.0% appreciation · 3.0% rent growth · sell at horizon
- IRR
- 22.5%
- Equity multiple
- 2.81×
- Total profit
- $181,019
- Equity at exit
- $321,154
- IRR
- 20.2%
- Equity multiple
- 6.44×
- Total profit
- $542,995
- Equity at exit
- $692,582
Cash invested: $99,817 (down + closing). Projections, not guarantees.
Landlord ↔ Tenant lean methodology
- Overall (STATE)
- 87 Strongly Landlord-Friendly
- State Florida
- 87 Strongly Landlord-Friendly · R+3
- County
- — inherits STATE
- City
- — inherits STATE
ZIP-level market 34753
- Home prices YoY
- 7.2%
- Active inventory
- 98
- Price-to-rent
- 12.0×
Monthly cashflow live
- Estimated rent
- $2,482 high interval (Pro) →
- Mortgage (P&I)
- −$1,869
- Tax from tax record
- −$65 /mo · $774/yr
- Insurance
- −$149
- HOA
- −$82
- Vacancy / Maint / Mgmt
- −$521
- Net cashflow
- $-204
Break-even live
UW: 25.0% down · 7.5% · 30yr · 1.5% tax · 5.0% vac · 8.0% maint · 8.0% mgmt
Financing live
Cash to close
- Down payment
- $89,122
- Closing costs
- $10,695
- Reserves months
- —
- Total cash needed
- —
Loan-product check · same deal, 3 products live
Conventional
25% down · 7.5% · 30yr
- Down + closing
- —
- Monthly P&I
- —
- Monthly cashflow
- —
- DSCR
- —
- Eligible?
- —
Personal DTI + credit; lowest rate.
DSCR
20% down · 8.5% · 30yr
- Down + closing
- —
- Monthly P&I
- —
- Monthly cashflow
- —
- DSCR
- —
- Eligible?
- —
No personal income docs; deal must DSCR.
Hard money
10% down · 12.0% · 12mo
- Down + closing
- —
- Monthly P&I
- —
- Monthly cashflow
- —
- DSCR
- —
- Eligible?
- —
Short-term bridge; refi at stabilization.
Rent comps 11 comps
| Address | Beds | Baths | Sqft | Rent | $/sqft | DOM | Units | Dist |
|---|---|---|---|---|---|---|---|---|
| 405 Eventide Ave Mascotte, FL | 4.0 | 3.0 | 2000 | $2,250 | $1.12 | 20d | 1 | 0.14mi |
| 1600 Mayaro Ct Mascotte, FL | 3.0 | 2.0 | 1503 | $2,000 | $1.33 | 17d | 1 | 0.75mi |
| 1864 Piedmont Ct Mascotte, FL | 5.0 | 3.0 | 1984 | $2,290 | $1.15 | 23d | 1 | 0.80mi |
| 1676 Gopher Tree St Mascotte, FL | 5.0 | 3.0 | 1984 | $2,285 | $1.15 | 4d | 1 | 0.93mi |
| 1665 Luft Ln Mascotte, FL | 3.0 | 2.0 | 1680 | $2,030 | $1.21 | 23d | 1 | 1.06mi |
| 1126 Union Ave Mascotte, FL | 5.0 | 3.0 | 1984 | $2,265 | $1.14 | 23d | 1 | 1.06mi |
| 614 Huey St Mascotte, FL | 3.0 | 2.0 | 1572 | $2,071 | $1.32 | 4d | 1 | 1.09mi |
| 6337 Chorus Dr Groveland, FL | 3.0 | 2.0 | 1772 | $2,250 | $1.27 | 23d | 1 | 1.22mi |
| 2425 Begonia St Mascotte, FL | 4.0 | 2.0 | 1983 | $2,350 | $1.19 | 23d | 1 | 1.44mi |
| 1063 Bluegrass Dr Groveland, FL | 4.0 | 2.0 | 2182 | $2,500 | $1.15 | 23d | 1 | 1.48mi |
| 6612 Tempo Way Mascotte, FL | 3.0 | 2.0 | 1990 | $2,600 | $1.31 | 4d | 1 | 1.49mi |
HOA detail
- Monthly dues
- $82 · $984/yr
Listing history 4 events
-
2026-05-19status Pending
-
2026-05-05price $356,490
-
2026-01-17price $358,490
-
2025-12-09$353,490 Active
ⓘ Source: listings_history table (triggers on properties + properties_extension) + one-shot
backfill from property_details.listing_events for pre-trigger history.
Tax reassessment forecast FL · Resets to sale price
- Current annual tax
- $774 · $65/mo
- Projected year-2 tax
- $2,959 · $247/mo
- Expected delta
- +$2,185/yr (+$182/mo · 282.2%)
ⓘ Screening estimate from a state-policy table — verify with the county assessor before closing.
Nearby sold comps map
Loading sold comps map…
Walkable amenities ~0.75 mi
Loading nearby amenities…
Taxation est. · year 1
- Rental income
- $29,781
- − Mortgage interest
- −$19,969
- − Property taxes
- −$774
- − Insurance
- −$1,782
- − Repairs & maintenance
- −$2,382
- − Management
- −$2,382
- − HOA
- −$984
- − Depreciation
- −$10,371
- Taxable loss
- −$8,864
- Est. tax savings @ 24.0%
- +$2,127
- After-tax cash flow
- $-320/yr
For passive investors: Depreciation is non-cash, so a rental often shows a tax loss while cash-flowing — sheltering income. Rental losses are passive: they offset passive income freely, and up to $25,000/yr can offset ordinary (W-2) income if you actively participate and your MAGI is under $100k (phasing out to $0 by $150k); unused losses carry forward. On sale, claimed depreciation is recaptured at up to 25%, and gains may owe capital-gains tax (a 1031 exchange can defer both). Figures are a year-1 estimate at your 24.0% rate — not tax advice; consult a CPA.
Schools (NCES district)
- District
- Lake
- NCES district ID
- 1201050
- Math proficiency
- 49% ▼ -7.00%
- Reading proficiency
- 50% ▼ -4.00%
- Median HH income
- $46,632
- Composite
- 42.05/100
- National rank
- #3327
- State rank
- #37 of 73 in FL
Livability — Mascotte
- Score
- 71/100
- State rank
- #405
- US rank
- #7156
Category grades
Schools grade is shown separately in the Schools card above.
Census & demographics
- Census place
- Mascotte, FL
- County
- Lake County · 364,602 people
- City population
- 33,565
- Metro
- Orlando-Kissimmee-Sanford, FL
- Population (ZIP)
- 7,985
- Household income
- $83,868
- Rent vs Own
- Severe rent burden
- 16.0
Population outlook (Lake County) Hauer SSP2
- Today (2025)
- 386,640 people
- By 2030
- 417,107 · +7.9%
- By 2040
- 476,676 · +23.3%
- By 2050
- 531,296 · +37.4%
- By 2075
- 648,303 · +67.7%
- By 2100
- 698,530 · +80.7%
Race, ethnicity, and origin ACS 2023
- Neighborhood character
- Diverse neighborhood (Simpson 0.69)
- Race & ethnicity
- White 38% Hispanic / Latino 35% Two or more races 25% Black 20% Asian 3%
- Hispanic origin (detail)
- Mexican 11% Puerto Rican 12% Dominican 2%
- Common ancestry
- Slovak 1% Serbian 1% Romanian 1%
- Foreign-born
- 10% · Canada, Jamaica
- Languages at home
- 67% English-only · Spanish 32%
Political lean MEDSL · Lake
- 2024 margin
- Strong R (+24.7) · D 37.3% · R 62.0%
- 2008→2024 swing
- -11.2pp toward R · 2008: -13.5pp · 2024: -24.7pp
- All cycles
- 2024: R+24.7 2020: R+20.0 2016: R+23.1 2012: R+17.1 2008: R+13.5
Not yet ingested
- Civics
- —
Market trends
- HPI YoY
- ▲ 19.01%
- Current HPI
- 281.96
- Rent YoY
- —
- Metro
- Orlando-Kissimmee-Sanford, FL
- State GDP YoY
- ▲ 3.28%
- F500 in state
- 36
Industry mix (Fortune 500 HQ in FL)
| Industry | F500 HQs | Revenue |
|---|---|---|
| Industrial Technology | 2 | $29B |
|
||
| Insurance | 2 | $17B |
|
||
| Retail | 1 | $60B |
|
||
| Technology Distribution | 1 | $58B |
|
||
| Homebuilding | 1 | $35B |
|
||
| Technology Manufacturing | 1 | $35B |
|
||
Price history
+0.8% since first listed4 events — show timeline
- 2026-05-19 Pending — Stellar MLS as Distributed by MLS Grid
- 2026-05-05 Price Changed $356,490 Stellar MLS as Distributed by MLS Grid
- 2026-01-17 Price Changed $358,490 Stellar MLS as Distributed by MLS Grid
- 2025-12-09 Listed $353,490 Stellar MLS as Distributed by MLS Grid
Property tax history
-1.2%/yrLatest (2025): $774 · -1.2% YoY. Source: county tax records.
Cash-flow waterfall
monthlySold comps — $/sqft
last 12 mo · ≤1 miLoading sold comps…