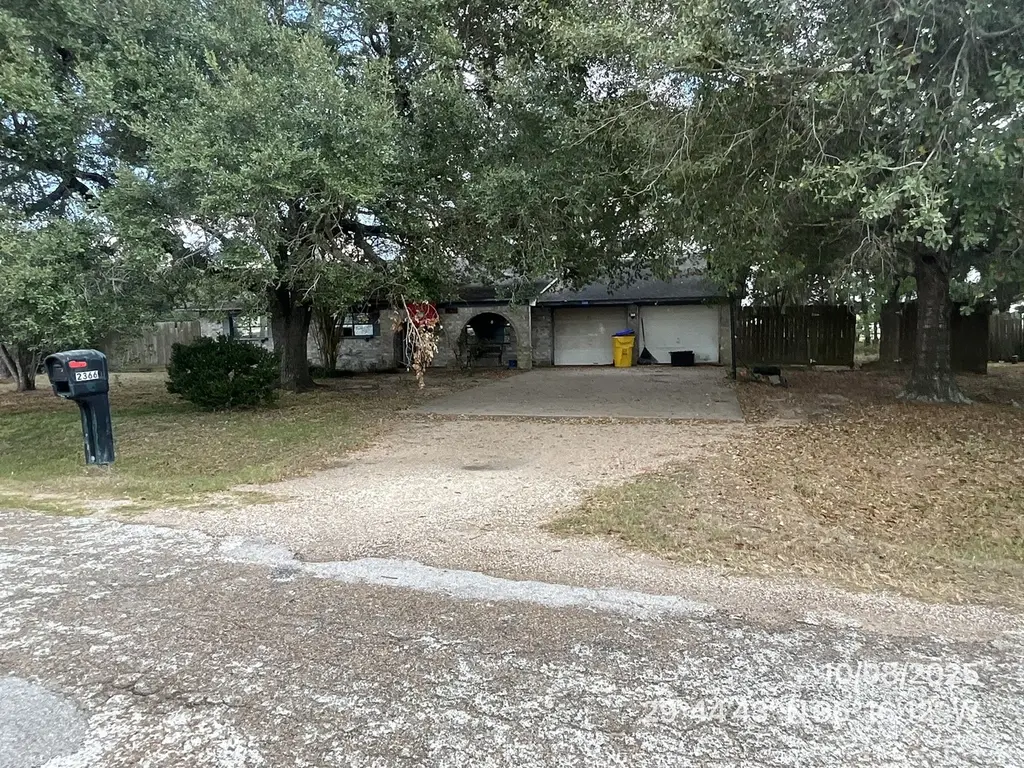
2366 Beckendorff · Sealy, TX
Flood risk 1/10 · Minimal
- FEMA flood zone
- X (unshaded)
- Chance of flooding over 30 yrs
- 0.0%
- Est. flood insurance / yr
- $507 – $1,088
Fire risk 5/10 · Moderate
- Est. fire insurance / yr
- $1,222 – $2,270
Heat risk 8/10 · Major
- Hot days now (above 112°F)
- 7 days/yr
- Hot days in 30 yrs
- 22 days/yr
Wind risk 9/10 · Severe
- Chance of severe wind over 30 yrs
- 99.0%
Air-quality risk 1/10 · Minimal
- Unhealthy air days now
- 0 days/yr
- Unhealthy air days in 30 yrs
- 0 days/yr
Risk factors via First Street. Map © Google.
Why this score? — see what drove the B- grade
The composite is a weighted blend of 9 inputs, each scored 0–100. Each bar is that input's sub-score; the figure is the points it added to the 100-point composite (weight × sub-score).
- Cash flow +30.0/30.0
- DSCR +10.0/10.0
- 1% rule +9.6/10.0
- ARV discount +7.5/15.0
- Livability +3.5/5.0
- Schools +3.4/10.0
- Rent growth +2.5/5.0
- Condition / age +1.0/5.0
- Appreciation +0.0/10.0
$112,000
🖨 Deal sheet 📄 Offer letter ✓ Due diligence
Listing remarks
* * * * * * SELLER HAS ACCEPTED AN OFFER; WAITING ON SIGNATURES * * * * * * Opportunity awaits on this spacious homesite in the growing Sealy area. This property offers tremendous potential for investors, renovators, builders, or buyers looking for a project. The existing home is in poor condition and will require significant repairs and improvements, making it best suited for buyers seeking a complete renovation opportunity. The value is primarily in the location, land, and future potential rather than the current improvements. Conveniently located with access to I-10 and within commuting distance of Houston, this property provides a rare chance to create value and customize to
Key facts
- Spacious homesite
- Access to i-10
- Built 1984
Tags
Property features AI
Finance
- Financial info: Lease not considered
Exterior
- Utilities: Water from a well
- Home design: Residential property; Single-story layout (all main rooms listed on the first floor)
- Construction: Brick construction; Built in 1984; Composition roof; Slab foundation
- Exterior features: Cleared lot
Interior
- Kitchen: Kitchen on the first floor (approx. 14x10)
- Bedrooms: Three bedrooms on the first floor (approx. 15x11, 11x10, 13x12)
- Bathrooms: Two full bathrooms
- Heating & cooling: Central heating (gas); Central electric air conditioning
- Interior features: One fireplace; Six total rooms
Neighborhood map
What this means for you Summary
Snapshot
- This is a 3-bed/2.0-bath single-family listed at $112k. Condition is rated poor.
Deal economics
- At list price, monthly cash flow is $520 ($6k/yr) — positive.
- The deal already cash-flows at list — no discount required.
- Meets the 1% rule at list price ($2k rent vs $112k).
- Recommended offer: $110k (1.5% below list) — sets the bar for market timing.
- Cap rate 11.9% vs local median 2.6% in Sealy — top-decile yield for the area; either an underpriced asset or a hidden risk that comps aren't pricing in. Stress-test before assuming the spread holds.
Location & tenants
- Location reads 70/100 on livability (#342 in TX) — a middle-class / working-renter tenant base. Strengths: cost of living A+, housing A+, crime A; Watch: schools D, amenities F, commute F.
- Sealy ISD (rural): math 39% / reading 39% proficiency, ranked #405 of 826 in TX (top 49%) — families likely to look elsewhere, expect single-tenant / working-renter base with shorter leases.
- Market conditions: 310 active listings in the ZIP; 410 units permitted in Austin County in 2024 (0 in 5+ unit buildings).
Forward outlook
- Local home prices are declining (-3.0%/yr); year-one equity from $774 of loan paydown is wiped out by about $3k of value loss. Plan a longer hold.
- Austin County population projected at +18% by 2050 — long-run rental-demand tailwind backs the buy-and-hold thesis.
- At projected returns (-3.0% appreciation + 3.0% rent growth), your $31k cash investment doubles in ~7 years — after that, you're playing with house money.
Negotiation context
- It's been on market 16 days — a 2% lower offer ($110k) is reasonable based on typical stale-listing flexibility.
Risks & watch-outs
- Climate carrying-cost: severe wind risk, 99% chance of damaging wind over 30y; moderate wildfire risk; extreme-heat days projected 7→22/yr by 2055 (HVAC capex compounding) — expect insurance premiums to compound above CPI over the hold.
Questions for the listing agent
- Have any recent inspections been done? Can we get a copy of the seller's disclosures and any deferred-maintenance estimates?
- Is there a deadline driving the sale (1031 exchange, divorce, estate, relocation)? That informs how much negotiation room exists.
- Schools are D-rated, which usually means shorter tenancies and higher turnover. Who's the typical renter profile here, and what's been the actual vacancy rate?
- What's the average days-on-market for RENTAL listings here right now (not sales)? A rising rental-DOM trend means longer vacancies and softer asking-rent achievability than the comps imply.
- What's the recent tenant-quality profile in this submarket — average credit score on applications, eviction rate, late-payment / NSF rate, and stable-employment percentage? A property-management company in the area should have these aggregated.
- How much new for-sale + rental construction is in the pipeline within 1–3 miles? Heavy new supply typically softens prices + rents 12–24 months out; constrained supply supports both.
Investment metrics
- 1% rule
- 1.46% ✓
- Cap rate
- 11.86%
- Cash-on-cash
- 19.88%
- DSCR
- 1.88
- GRM
- 5.7
CMA / ARV
No comps found within radius.
Projected returns pro-forma
-3.0% appreciation · 3.0% rent growth · sell at horizon
- IRR
- 12.0%
- Equity multiple
- 1.48×
- Total profit
- $14,969
- Equity at exit
- $16,700
- IRR
- 21.0%
- Equity multiple
- 2.78×
- Total profit
- $55,747
- Equity at exit
- $9,684
Cash invested: $31,360 (down + closing). Projections, not guarantees.
Landlord ↔ Tenant lean methodology
- Overall (STATE)
- 87 Strongly Landlord-Friendly
- State Texas
- 87 Strongly Landlord-Friendly · R+5
- County
- — inherits STATE
- City
- — inherits STATE
ZIP-level market 77474
- Active inventory
- 310
- Price-to-rent
- 5.7×
Monthly cashflow live
- Estimated rent
- $1,637 medium interval (Pro) →
- Mortgage (P&I)
- −$587
- Tax est. 1.5%
- −$140 /mo · $1,680/yr
- Insurance
- −$47
- HOA
- −$0
- Vacancy / Maint / Mgmt
- −$344
- Net cashflow
- $520
Break-even live
UW: 25.0% down · 7.5% · 30yr · 1.5% tax · 5.0% vac · 8.0% maint · 8.0% mgmt
Financing live
Cash to close
- Down payment
- $28,000
- Closing costs
- $3,360
- Reserves months
- —
- Total cash needed
- —
Loan-product check · same deal, 3 products live
Conventional
25% down · 7.5% · 30yr
- Down + closing
- —
- Monthly P&I
- —
- Monthly cashflow
- —
- DSCR
- —
- Eligible?
- —
Personal DTI + credit; lowest rate.
DSCR
20% down · 8.5% · 30yr
- Down + closing
- —
- Monthly P&I
- —
- Monthly cashflow
- —
- DSCR
- —
- Eligible?
- —
No personal income docs; deal must DSCR.
Hard money
10% down · 12.0% · 12mo
- Down + closing
- —
- Monthly P&I
- —
- Monthly cashflow
- —
- DSCR
- —
- Eligible?
- —
Short-term bridge; refi at stabilization.
Listing history 11 events
-
2026-06-18days on market $112,000 Active 16 DOM
-
2026-06-17days on market $112,000 Active 15 DOM
-
2026-06-16days on market $112,000 Active 14 DOM
-
2026-06-15days on market $112,000 Active 13 DOM
-
2026-06-13days on market $112,000 Active 11 DOM
-
2026-06-09remarks 699-char remark
-
2026-06-09days on market $112,000 Active 7 DOM
-
2026-06-08days on market $112,000 Active 6 DOM
-
2026-06-07days on market $112,000 Active 5 DOM
-
2026-06-04days on market $112,000 Active 2 DOM
-
2026-06-02$112,000 Active 1 DOM
ⓘ Source: listings_history table (triggers on properties + properties_extension) + one-shot
backfill from property_details.listing_events for pre-trigger history.
Climate risk First Street
- Flood 1/10 Low FEMA zone X (unshaded) · 0% chance over 30 yrs
- Wildfire 5/10 Major
- Heat 8/10 Severe 7 d/yr ≥112°F today · 22 d/yr by 30 yrs out
- Wind 9/10 Extreme 99% chance of damaging wind over 30 yrs
- Air quality 1/10 Low 0 unhealthy d/yr today · 0 by 30 yrs out
Nearby sold comps map
Loading sold comps map…
Walkable amenities ~0.75 mi
Loading nearby amenities…
Taxation est. · year 1
- Rental income
- $19,650
- − Mortgage interest
- −$6,274
- − Property taxes
- −$1,680
- − Insurance
- −$560
- − Repairs & maintenance
- −$1,572
- − Management
- −$1,572
- − Depreciation
- −$3,258
- Taxable income
- $4,734
- Est. tax owed @ 24.0%
- −$1,136
- After-tax cash flow
- $5,099/yr
For passive investors: Depreciation is non-cash, so a rental often shows a tax loss while cash-flowing — sheltering income. Rental losses are passive: they offset passive income freely, and up to $25,000/yr can offset ordinary (W-2) income if you actively participate and your MAGI is under $100k (phasing out to $0 by $150k); unused losses carry forward. On sale, claimed depreciation is recaptured at up to 25%, and gains may owe capital-gains tax (a 1031 exchange can defer both). Figures are a year-1 estimate at your 24.0% rate — not tax advice; consult a CPA.
Condition & rehab AI · 12 photos
This property requires extensive renovations, including new cabinets, countertops, fixtures, siding, flooring, and painting. The home's poor condition and lack of recent updates significantly reduce its value.
Repairs flagged
- Major Kitchen cabinets — Old and worn
- Major Kitchen countertops — Exposed subfloor
- Major Bathroom fixtures — Worn and peeling
- Major Exterior siding — Exposed subfloor
- Major Flooring — Worn tile
- Major Paint — Peeling
Value-add opportunities
- Resale New kitchen cabinets and countertops — Modernizing the kitchen would significantly increase its value
- Resale New bathroom fixtures — Upgrading the bathroom would improve the home's overall appeal
- Resale New exterior siding — A fresh exterior would enhance curb appeal and property value
- Resale New flooring — Fresh flooring would improve the home's overall appearance and functionality
- Resale Painting — Fresh paint would improve the home's overall appearance and functionality
Renovation cost estimate screening
| Repair item | Severity | Est. cost |
|---|---|---|
| Kitchen cabinets · Old and worn | Major | $15,000–50,000 |
| Kitchen countertops · Exposed subfloor | Major | $15,000–50,000 |
| Bathroom fixtures · Worn and peeling | Major | $15,000–50,000 |
| Exterior siding · Exposed subfloor | Major | $15,000–50,000 |
| Flooring · Worn tile | Major | $15,000–50,000 |
| Paint · Peeling | Major | $15,000–50,000 |
| Total estimated repair cost · 6 items | $90,000–300,000 |
Value-add ROI direction
- Resale New kitchen cabinets and countertops — Modernizing the kitchen would significantly increase its value ↑
- Resale New bathroom fixtures — Upgrading the bathroom would improve the home's overall appeal ↑
- Resale New exterior siding — A fresh exterior would enhance curb appeal and property value ↑
- Resale New flooring — Fresh flooring would improve the home's overall appearance and functionality ↑
- Resale Painting — Fresh paint would improve the home's overall appearance and functionality ↑
ⓘ Cost ranges are severity-bucket heuristics (US national rule-of-thumb). Get contractor quotes + a written scope before underwriting a rehab budget.
Schools (NCES district)
- District
- Sealy ISD
- NCES district ID
- 4839630
- Math proficiency
- 39% ▼ -6.00%
- Reading proficiency
- 39% ▼ -2.00%
- Median HH income
- $57,842
- Composite
- 34.42/100
- National rank
- #5200
- State rank
- #405 of 826 in TX
Livability — Sealy
- Score
- 70/100
- State rank
- #342
- US rank
- #7463
Category grades
Schools grade is shown separately in the Schools card above.
Census & demographics
- Population (ZIP)
- 14,846
Population outlook (Austin County) Hauer SSP2
- Today (2025)
- 32,206 people
- By 2030
- 33,459 · +3.9%
- By 2040
- 35,809 · +11.2%
- By 2050
- 37,933 · +17.8%
- By 2075
- 44,179 · +37.2%
- By 2100
- 47,870 · +48.6%
Race, ethnicity, and origin ACS 2023
- Neighborhood character
- Diverse neighborhood (Simpson 0.58)
- Race & ethnicity
- White 56% Hispanic / Latino 32% Black 9% Two or more races 8% Asian 1%
- Hispanic origin (detail)
- Mexican 28%
- Common ancestry
- Romanian 2% Lithuanian 1% Serbian 1%
- Foreign-born
- 12% · Canada
- Languages at home
- 73% English-only · Spanish 24% Russian/Polish/Slavic 1% Other Indo-European 1%
Political lean MEDSL · Austin
- 2024 margin
- Solid R (+62.7) · D 18.3% · R 81.0%
- 2008→2024 swing
- -11.8pp toward R · 2008: -50.9pp · 2024: -62.7pp
- All cycles
- 2024: R+62.7 2020: R+58.4 2016: R+59.7 2012: R+60.3 2008: R+50.9
Not yet ingested
- Civics
- —
Market trends
- HPI YoY
- ▼ -130.57%
- Current HPI
- 195.9491
- Rent YoY
- —
- Metro
- —
- State GDP YoY
- ▲ 3.95%
- F500 in state
- 110
Industry mix (Fortune 500 HQ in TX)
| Industry | F500 HQs | Revenue |
|---|---|---|
| Energy | 16 | $1,198B |
|
||
| Technology | 5 | $198B |
|
||
| Engineering / Construction | 4 | $72B |
|
||
| Energy Services | 3 | $60B |
|
||
| Utilities | 3 | $41B |
|
||
| Healthcare | 2 | $330B |
|
||
Price history
1 event — show timeline
- 2026-06-02 Listed $112,000 HARMLS
Cash-flow waterfall
monthlySold comps — $/sqft
last 12 mo · ≤1 miLoading sold comps…