 🏗️ New Construction
Cottonwood I 205 Plan · Rockford, MN
Flood risk 1/10 · Minimal
- FEMA flood zone
- X (unshaded)
- Chance of flooding over 30 yrs
- 0.0%
- Est. flood insurance / yr
- $507 – $1,088
Fire risk 1/10 · Minimal
- Est. fire insurance / yr
- $888 – $1,650
Heat risk 2/10 · Minimal
- Hot days now (above 99°F)
- 7 days/yr
- Hot days in 30 yrs
- 14 days/yr
Wind risk 2/10 · Minimal
- Chance of severe wind over 30 yrs
- —
Air-quality risk 2/10 · Minimal
- Unhealthy air days now
- 0 days/yr
- Unhealthy air days in 30 yrs
- 1 days/yr
Risk factors via First Street. Map © Google.
Why this score? — see what drove the B grade
The composite is a weighted blend of 9 inputs, each scored 0–100. Each bar is that input's sub-score; the figure is the points it added to the 100-point composite (weight × sub-score).
- Cash flow +30.0/30.0
- 1% rule +10.0/10.0
- DSCR +10.0/10.0
- ARV discount +7.5/15.0
- Schools +4.5/10.0
- Condition / age +4.0/5.0
- Livability +3.3/5.0
- Rent growth +2.5/5.0
- Appreciation +0.0/10.0
$86,900
🖨 Deal sheet 📄 Offer letter ✓ Due diligence
Listing remarks MLS
Tentatively available 6/15/2025. This home is currently occupied and cannot be shown. There's no place like home, and you should make your home in Rockford Riverview Estates, a well-maintained, professionally-managed manufactured home community. Right now, you could buy a 2019 model year, 1344.00 sq. ft. 3 bed/2 bath home for only $86,900.00 plus site fees! Call Rockford Riverview Estates today to schedule a viewing of this home.
Key facts
- Listed 386 days
Neighborhood map
What this means for you Summary
Snapshot
- This is a 3-bed/2.0-bath manufactured listed at $87k. Condition is rated good.
Deal economics
- At list price, monthly cash flow is $624 ($7k/yr) — positive.
- The deal already cash-flows at list — no discount required.
- Meets the 1% rule at list price ($2k rent vs $87k).
- Recommended offer: $76k (12.0% below list) — sets the bar for market timing.
- Cap rate 14.9% vs local median 2.7% in Rockford — top-decile yield for the area; either an underpriced asset or a hidden risk that comps aren't pricing in. Stress-test before assuming the spread holds.
Location & tenants
- Location reads 66/100 on livability (#487 in MN) — a middle-class / working-renter tenant base. Strengths: housing A+, crime A, employment A; Watch: amenities F, commute F, health & safety F.
- Rockford Public School District (rural): math 42% / reading 58% proficiency, ranked #88 of 301 in MN (top 29%) — acceptable for families but not a draw, mixed tenant base, ~2y average lease.
- Market conditions: 59 active listings in the ZIP; 1 comparable units currently listed for rent nearby; 1,260 units permitted in Wright County in 2024 (180 in 5+ unit buildings).
Forward outlook
- Local home prices are declining (-3.0%/yr); year-one equity from $601 of loan paydown is wiped out by about $3k of value loss. Plan a longer hold.
- Wright County population projected at +9% by 2050 — modest demand growth; plan on rents tracking national, not racing it.
- At projected returns (-3.0% appreciation + 3.0% rent growth), your $24k cash investment doubles in ~4 years — after that, you're playing with house money.
Negotiation context
- It's been on market 386 days — a 12% lower offer ($76k) is reasonable based on typical stale-listing flexibility.
Questions for the listing agent
- It's been on market 386 days. Have you received any prior offers? Is the seller open to a 12% concession, seller financing, or rate buy-down credit?
- Why hasn't it sold? Are there any deal-killer items the seller is aware of (foundation, flood, title, zoning, code violations)?
- Is there a deadline driving the sale (1031 exchange, divorce, estate, relocation)? That informs how much negotiation room exists.
- Schools are A-rated — typically a magnet for longer-tenancy family renters. What's the average tenant stay here, and is there a school-zone premium baked into asking?
- What's the average days-on-market for RENTAL listings here right now (not sales)? A rising rental-DOM trend means longer vacancies and softer asking-rent achievability than the comps imply.
- What's the recent tenant-quality profile in this submarket — average credit score on applications, eviction rate, late-payment / NSF rate, and stable-employment percentage? A property-management company in the area should have these aggregated.
- How much new for-sale + rental construction is in the pipeline within 1–3 miles? Heavy new supply typically softens prices + rents 12–24 months out; constrained supply supports both.
Investment metrics
- 1% rule
- 1.78% ✓
- Cap rate
- 14.91%
- Cash-on-cash
- 30.77%
- DSCR
- 2.37
- GRM
- 4.7
CMA / ARV
No comps found within radius.
Projected returns pro-forma
-3.0% appreciation · 3.0% rent growth · sell at horizon
- IRR
- 25.5%
- Equity multiple
- 2.06×
- Total profit
- $25,682
- Equity at exit
- $12,957
- IRR
- 33.2%
- Equity multiple
- 4.03×
- Total profit
- $73,630
- Equity at exit
- $7,514
Cash invested: $24,332 (down + closing). Projections, not guarantees.
Landlord ↔ Tenant lean methodology
- Overall (STATE)
- 46 Balanced
- State Minnesota
- 46 Balanced · D+2
- County
- — inherits STATE
- City
- — inherits STATE
ZIP-level market 55373
- Home prices YoY
- -25.3%
- Active inventory
- 59
- Price-to-rent
- 4.7×
Monthly cashflow live
- Estimated rent
- $1,550 medium interval (Pro) →
- Mortgage (P&I)
- −$456
- Tax est. 1.5%
- −$109 /mo · $1,304/yr
- Insurance
- −$36
- HOA
- −$0
- Vacancy / Maint / Mgmt
- −$326
- Net cashflow
- $624
Break-even live
UW: 25.0% down · 7.5% · 30yr · 1.5% tax · 5.0% vac · 8.0% maint · 8.0% mgmt
Financing live
Cash to close
- Down payment
- $21,725
- Closing costs
- $2,607
- Reserves months
- —
- Total cash needed
- —
Loan-product check · same deal, 3 products live
Conventional
25% down · 7.5% · 30yr
- Down + closing
- —
- Monthly P&I
- —
- Monthly cashflow
- —
- DSCR
- —
- Eligible?
- —
Personal DTI + credit; lowest rate.
DSCR
20% down · 8.5% · 30yr
- Down + closing
- —
- Monthly P&I
- —
- Monthly cashflow
- —
- DSCR
- —
- Eligible?
- —
No personal income docs; deal must DSCR.
Hard money
10% down · 12.0% · 12mo
- Down + closing
- —
- Monthly P&I
- —
- Monthly cashflow
- —
- DSCR
- —
- Eligible?
- —
Short-term bridge; refi at stabilization.
Rent comps 1 comps
| Address | Beds | Baths | Sqft | Rent | $/sqft | DOM | Units | Dist |
|---|---|---|---|---|---|---|---|---|
| 8627 Woodlawn Dr Rockford, MN | 2.0 | 1.0 | 1300 | $1,550 | $1.19 | 19d | 1 | 0.25mi |
Listing history 14 events
-
2026-06-18days on market $86,900 Active 386 DOM
-
2026-06-17days on market $86,900 Active 385 DOM
-
2026-06-16days on market $86,900 Active 384 DOM
-
2026-06-15days on market $86,900 Active 383 DOM
-
2026-06-13days on market $86,900 Active 381 DOM
-
2026-06-09days on market $86,900 Active 377 DOM
-
2026-06-08days on market $86,900 Active 376 DOM
-
2026-06-07days on market $86,900 Active 375 DOM
-
2026-06-04days on market $86,900 Active 372 DOM
-
2026-06-03days on market $86,900 Active 371 DOM
-
2026-06-02days on market $86,900 Active 370 DOM
-
2026-06-01days on market $86,900 Active 369 DOM
-
2026-05-31days on market $86,900 Active 368 DOM
-
2025-05-29$86,900 Active 433-char remark
Show marketing remark (433 chars)
Tentatively available 6/15/2025. This home is currently occupied and cannot be shown. There's no place like home, and you should make your home in Rockford Riverview Estates, a well-maintained, professionally-managed manufactured home community. Right now, you could buy a 2019 model year, 1344.00 sq. ft. 3 bed/2 bath home for only $86,900.00 plus site fees! Call Rockford Riverview Estates today to schedule a viewing of this home.
ⓘ Source: listings_history table (triggers on properties + properties_extension) + one-shot
backfill from property_details.listing_events for pre-trigger history.
Climate risk First Street
- Flood 1/10 Low FEMA zone X (unshaded) · 0% chance over 30 yrs
- Wildfire 1/10 Low
- Heat 2/10 Low 7 d/yr ≥99°F today · 14 d/yr by 30 yrs out
- Wind 2/10 Low
- Air quality 2/10 Low 0 unhealthy d/yr today · 1 by 30 yrs out
Nearby sold comps map
Loading sold comps map…
Walkable amenities ~0.75 mi
Loading nearby amenities…
Taxation est. · year 1
- Rental income
- $18,600
- − Mortgage interest
- −$4,868
- − Property taxes
- −$1,304
- − Insurance
- −$434
- − Repairs & maintenance
- −$1,488
- − Management
- −$1,488
- − Depreciation
- −$2,528
- Taxable income
- $6,490
- Est. tax owed @ 24.0%
- −$1,558
- After-tax cash flow
- $5,930/yr
For passive investors: Depreciation is non-cash, so a rental often shows a tax loss while cash-flowing — sheltering income. Rental losses are passive: they offset passive income freely, and up to $25,000/yr can offset ordinary (W-2) income if you actively participate and your MAGI is under $100k (phasing out to $0 by $150k); unused losses carry forward. On sale, claimed depreciation is recaptured at up to 25%, and gains may owe capital-gains tax (a 1031 exchange can defer both). Figures are a year-1 estimate at your 24.0% rate — not tax advice; consult a CPA.
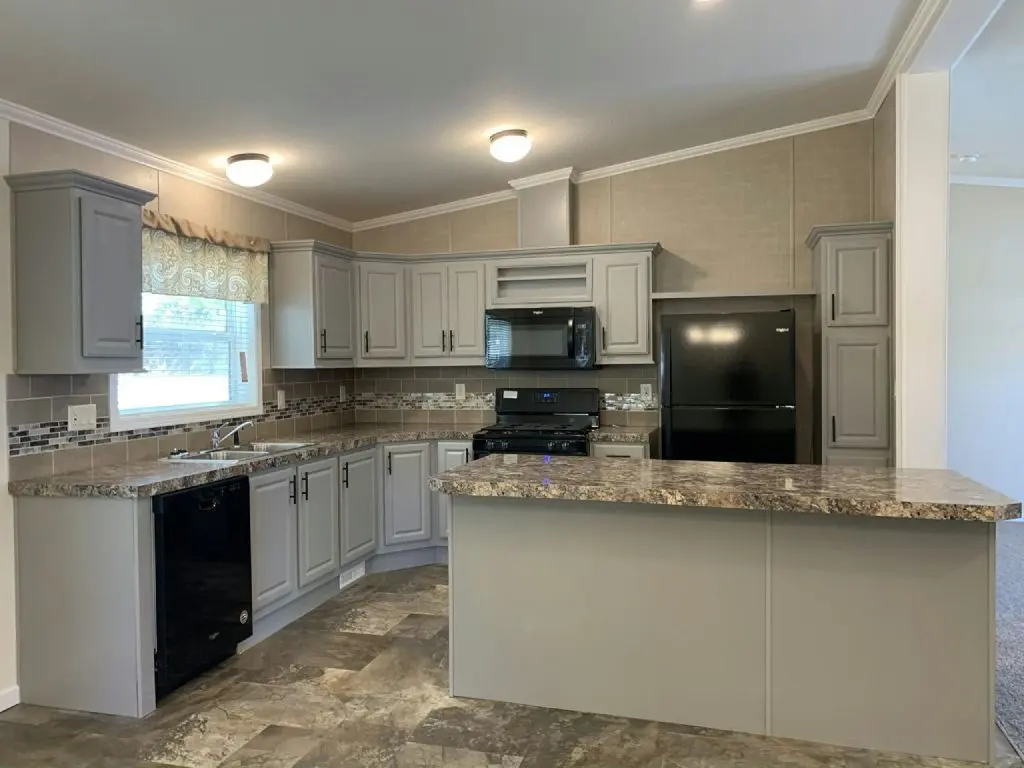
Condition & rehab AI · 1 photo
This manufactured home has a good condition with a modern kitchen and neutral paint. It has potential for further improvements in exterior and bathrooms to increase its resale and rental value.
Value-add opportunities
- Both Painting the exterior and landscaping — Enhances curb appeal and resale value.
- Both Upgrading the bathrooms — Improves functionality and adds value for both resale and rental.
- Both Adding smart home features — Enhances convenience and adds modern appeal for both buyers and renters.
Renovation cost estimate screening
Value-add ROI direction
- Both Painting the exterior and landscaping — Enhances curb appeal and resale value. ↑
- Both Upgrading the bathrooms — Improves functionality and adds value for both resale and rental. ↑
- Both Adding smart home features — Enhances convenience and adds modern appeal for both buyers and renters. ↑
ⓘ Cost ranges are severity-bucket heuristics (US national rule-of-thumb). Get contractor quotes + a written scope before underwriting a rehab budget.
Schools (NCES district)
- District
- Rockford Public School District
- NCES district ID
- 2732070
- Math proficiency
- 42% ▼ -21.00%
- Reading proficiency
- 58% ▼ -10.00%
- Median HH income
- $77,286
- Composite
- 45.33/100
- National rank
- #2641
- State rank
- #88 of 301 in MN
Livability — Rockford
- Score
- 66/100
- State rank
- #487
- US rank
- #11694
Category grades
Schools grade is shown separately in the Schools card above.
Census & demographics
- Census place
- Rockford, MN
- City population
- 5,725
- Population (ZIP)
- 5,725
Population outlook (Wright County) Hauer SSP2
- Today (2025)
- 142,526 people
- By 2030
- 146,915 · +3.1%
- By 2040
- 153,625 · +7.8%
- By 2050
- 155,416 · +9.0%
- By 2075
- 150,352 · +5.5%
- By 2100
- 130,631 · -8.3%
Race, ethnicity, and origin ACS 2023
- Neighborhood character
- Predominantly White (89%)
- Race & ethnicity
- White 89% Two or more races 4% Asian 3% Hispanic / Latino 2% Black 2%
- Common ancestry
- Portuguese 16% Romanian 4% Scottish 2%
- Foreign-born
- 4% · South Korea, Canada, Vietnam
- Languages at home
- 97% English-only · Spanish 1% Other Asian/Pacific 1%
Political lean MEDSL · Wright
- 2024 margin
- Strong R (+29.4) · D 34.4% · R 63.8% · Other 1.8%
- 2008→2024 swing
- -11.9pp toward R · 2008: -17.4pp · 2024: -29.4pp
- All cycles
- 2024: R+29.4 2020: R+28.6 2016: R+33.2 2012: R+21.4 2008: R+17.4
Not yet ingested
- Civics
- —
Market trends
- HPI YoY
- ▼ -73.98%
- Current HPI
- 218.0934
- Rent YoY
- —
- Metro
- —
- State GDP YoY
- ▲ 2.41%
- F500 in state
- 34
Industry mix (Fortune 500 HQ in MN)
| Industry | F500 HQs | Revenue |
|---|---|---|
| Healthcare | 2 | $407B |
|
||
| Retail | 2 | $150B |
|
||
| Consumer Goods | 2 | $32B |
|
||
| Industrial Machinery | 2 | $6B |
|
||
| Agriculture | 1 | $40B |
|
||
| Healthcare / Medical Devices | 1 | $32B |
|
||
Price history
1 event — show timeline
- 2025-05-29 Listed $86,900 Zillow
Cash-flow waterfall
monthlySold comps — $/sqft
last 12 mo · ≤1 miLoading sold comps…