 Multi-family
1100 Stonegate Dr · Auburn, AL
Flood risk 1/10 · Minimal
- FEMA flood zone
- X
- Chance of flooding over 30 yrs
- 0.0%
- Est. flood insurance / yr
- $435 – $905
Fire risk 2/10 · Minimal
- Est. fire insurance / yr
- $916 – $1,700
Heat risk 6/10 · Moderate
- Hot days now (above threshold)
- 7 days/yr
- Hot days in 30 yrs
- 20 days/yr
Wind risk No data
- Chance of severe wind over 30 yrs
- —
Air-quality risk 2/10 · Minimal
- Unhealthy air days now
- 1 days/yr
- Unhealthy air days in 30 yrs
- 1 days/yr
Risk factors via First Street. Map © Google.
Why this score? — see what drove the B grade
The composite is a weighted blend of 9 inputs, each scored 0–100. Each bar is that input's sub-score; the figure is the points it added to the 100-point composite (weight × sub-score).
- Cash flow +30.0/30.0
- 1% rule +10.0/10.0
- DSCR +10.0/10.0
- ARV discount +7.5/15.0
- Schools +5.0/10.0
- Rent growth +4.0/5.0
- Livability +4.0/5.0
- Condition / age +2.2/5.0
- Appreciation +0.0/10.0
$65,000
🖨 Deal sheet 📄 Offer letter ✓ Due diligence
Multi-family units
County records classify this as Multi-Family (5+ Unit). Listing-text estimate: 1 unit. estimate disagrees with records
5+ unit building — per-unit beds/baths from public records are typically unavailable; the breakdown below (if shown) is an estimate from the listing text.
Listing remarks
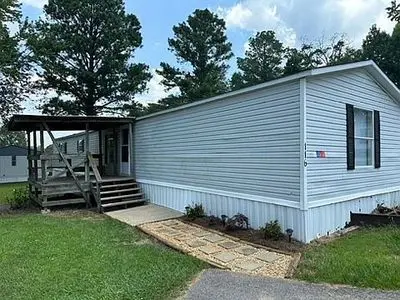
Mobile home for sale in Auburn, AL, located in a quiet and established mobile home community directly across from the Auburn University College of Veterinary Medicine. The community has a Tiger Transit bus stop, offering quick and convenient access to Auburn University & acirc; & euro; & trade; s campus. The community has many ammenities such as trash pickup, lawn care, and a pool. Please note: this sale is for the mobile home only. Land/lot is not included in the sale and is expected to be ~$540/month. Buyer is responsible for community approval.
Key facts
- Pool
- Lawn care
- Trash pickup
Tags
Neighborhood map
What this means for you Summary
Snapshot
- This is a 3-bed/2.0-bath multifamily listed at $65k. Condition is rated fair.
Deal economics
- At list price, monthly cash flow is $930 ($11k/yr) — positive.
- The deal already cash-flows at list — no discount required.
- Meets the 1% rule at list price ($2k rent vs $65k).
- Recommended offer: $64k (1.5% below list) — sets the bar for market timing.
- Cap rate 23.5% vs local median 2.7% in Auburn — top-decile yield for the area; either an underpriced asset or a hidden risk that comps aren't pricing in. Stress-test before assuming the spread holds.
Location & tenants
- Location reads 80/100 on livability (#6 in AL, #1,842 nationally) — a professional / high-income tenant draw. Strengths: crime A+, amenities A+, health & safety A+; Watch: commute F.
- Auburn City (urban): math 51% / reading 69% proficiency, ranked #7 of 129 in AL (top 5%) — acceptable for families but not a draw, mixed tenant base, ~2y average lease.
- Market conditions: Rents rising fast (+6.2%/yr); 359 active listings in the ZIP; 9 comparable units currently listed for rent nearby; rentals at typical pace (median 22d on market — plan ~3-4 weeks tenant-placement turnaround); lower-income renter base — watch delinquency; 1,858 units permitted in Lee County in 2024 (113 in 5+ unit buildings).
- At $1,746/mo this rent would consume 49% of the median local household income ($43k/yr) (locally 2503% of renters already pay >50% of income on rent) — very limited rent-growth headroom before tenants either downsize or default.
Forward outlook
- Local home prices are declining (-3.0%/yr); year-one equity from $449 of loan paydown is wiped out by about $2k of value loss. Plan a longer hold.
- Lee County population projected at +54% by 2050 — long-run rental-demand tailwind backs the buy-and-hold thesis.
- At projected returns (-3.0% appreciation + 6.2% rent growth), your $18k cash investment doubles in ~2 years — after that, you're playing with house money.
Negotiation context
- It's been on market 26 days — a 2% lower offer ($64k) is reasonable based on typical stale-listing flexibility.
- 3 sale attempts since 2y ago with the ask held roughly flat each time — persistent listings suggest the price (not the market) is what's stuck; bring a comps-based counter.
Risks & watch-outs
- Climate carrying-cost: extreme-heat days projected 7→20/yr by 2055 (HVAC capex compounding) — expect insurance premiums to compound above CPI over the hold.
Questions for the listing agent
- Have any recent inspections been done? Can we get a copy of the seller's disclosures and any deferred-maintenance estimates?
- Is there a deadline driving the sale (1031 exchange, divorce, estate, relocation)? That informs how much negotiation room exists.
- Schools are A-rated — typically a magnet for longer-tenancy family renters. What's the average tenant stay here, and is there a school-zone premium baked into asking?
- What's the average days-on-market for RENTAL listings here right now (not sales)? A rising rental-DOM trend means longer vacancies and softer asking-rent achievability than the comps imply.
- What's the recent tenant-quality profile in this submarket — average credit score on applications, eviction rate, late-payment / NSF rate, and stable-employment percentage? A property-management company in the area should have these aggregated.
- How much new apartment / multifamily construction is in the pipeline within 1–3 miles? Heavy new supply (>2% of stock underway) typically softens rents 12–24 months out; light construction supports rent growth.
Investment metrics
- 1% rule
- 2.69% ✓
- Cap rate
- 23.47%
- Cash-on-cash
- 61.34%
- DSCR
- 3.73
- GRM
- 3.1
CMA / ARV
No comps found within radius.
Projected returns pro-forma
-3.0% appreciation · 6.18% rent growth · sell at horizon
- IRR
- 63.8%
- Equity multiple
- 4.00×
- Total profit
- $54,510
- Equity at exit
- $9,692
- IRR
- 69.3%
- Equity multiple
- 9.19×
- Total profit
- $149,123
- Equity at exit
- $5,620
Cash invested: $18,200 (down + closing). Projections, not guarantees.
Landlord ↔ Tenant lean methodology
- Overall (STATE)
- 90 Strongly Landlord-Friendly
- State Alabama
- 90 Strongly Landlord-Friendly · R+15
- County
- — inherits STATE
- City
- — inherits STATE
ZIP-level market 36832
- Home prices YoY
- -23.3%
- Rents YoY
- 6.2%
- Active inventory
- 359
- Price-to-rent
- 3.1×
Monthly cashflow live
- Estimated rent
- $1,746 high interval (Pro) →
- Mortgage (P&I)
- −$341
- Tax est. 1.5%
- −$81 /mo · $975/yr
- Insurance
- −$27
- HOA
- −$0
- Vacancy / Maint / Mgmt
- −$367
- Net cashflow
- $930
Break-even live
UW: 25.0% down · 7.5% · 30yr · 1.5% tax · 5.0% vac · 8.0% maint · 8.0% mgmt
Financing live
Cash to close
- Down payment
- $16,250
- Closing costs
- $1,950
- Reserves months
- —
- Total cash needed
- —
Loan-product check · same deal, 3 products live
Conventional
25% down · 7.5% · 30yr
- Down + closing
- —
- Monthly P&I
- —
- Monthly cashflow
- —
- DSCR
- —
- Eligible?
- —
Personal DTI + credit; lowest rate.
DSCR
20% down · 8.5% · 30yr
- Down + closing
- —
- Monthly P&I
- —
- Monthly cashflow
- —
- DSCR
- —
- Eligible?
- —
No personal income docs; deal must DSCR.
Hard money
10% down · 12.0% · 12mo
- Down + closing
- —
- Monthly P&I
- —
- Monthly cashflow
- —
- DSCR
- —
- Eligible?
- —
Short-term bridge; refi at stabilization.
Rent comps 9 comps
| Address | Beds | Baths | Sqft | Rent | $/sqft | DOM | Units | Dist |
|---|---|---|---|---|---|---|---|---|
| 1761 Wire Rd Auburn, AL | 2.0 | 2.5 | 1117 | $1,400 | $1.25 | 21d | 1 | 0.09mi |
| 1761 Wire Rd Auburn, AL | 2.0 | 2.5 | 1084 | $1,375 | $1.27 | 44d | 2 | 0.09mi |
| 1007 Stonegate Dr Auburn, AL | 3.0 | 2.0 | 1440 | $1,900 | $1.32 | 44d | 1 | 0.22mi |
| 1233 Tigers Tail Trl Auburn, AL | 2.0 | 2.5 | 1400 | $2,200 | $1.57 | 13d | 1 | 0.43mi |
| 1276 Tigers Tail Trl Auburn, AL | 2.0 | 2.5 | 1400 | $2,500 | $1.79 | 13d | 1 | 0.44mi |
| 387 Webster Rd Unit 47 Auburn, AL | 2.0 | 2.0 | 952 | $975 | $1.02 | 13d | 1 | 0.95mi |
| 387 Webster Rd Unit 132 Auburn, AL | 2.0 | 2.0 | 980 | $975 | $0.99 | 44d | 1 | 0.95mi |
| 1114 S College St Apt 1-201 Auburn, AL | 4.0 | 4.0 | 1400 | $2,400 | $1.71 | 21d | 1 | 1.30mi |
| 1958 Sara St Auburn, AL | 3.0 | 2.0 | 1244 | $1,400 | $1.13 | 13d | 1 | 1.38mi |
Listing history 24 events
-
2026-06-18days on market $65,000 Active 26 DOM
-
2026-06-17days on market $65,000 Active 25 DOM
-
2026-06-16days on market $65,000 Active 24 DOM
-
2026-06-15days on market $65,000 Active 23 DOM
-
2026-06-14days on market $65,000 Active 21 DOM
-
2026-06-13days on market $65,000 Active 20 DOM
-
2026-06-10days on market $65,000 Active 18 DOM
-
2026-06-09days on market $65,000 Active 17 DOM
-
2026-06-08days on market $65,000 Active 16 DOM
-
2026-06-07days on market $65,000 Active 15 DOM
-
2026-06-05days on market $65,000 Active 12 DOM
-
2026-06-03days on market $65,000 Active 11 DOM
-
2026-06-02days on market $65,000 Active 10 DOM
-
2026-06-01days on market $65,000 Active 9 DOM
-
2026-05-31days on market $65,000 Active 8 DOM
-
2026-05-30days on market $65,000 Active 7 DOM
-
2026-05-24$65,000 Active
-
2025-05-11historical $625
-
2025-05-02price $625
-
2025-04-17$650
-
2024-07-20historical $1,650
-
2024-07-10price $1,650
-
2024-06-25$1,850
-
2023-07-24historical
ⓘ Source: listings_history table (triggers on properties + properties_extension) + one-shot
backfill from property_details.listing_events for pre-trigger history.
Climate risk First Street
- Flood 1/10 Low FEMA zone X · 0% chance over 30 yrs
- Wildfire 2/10 Low
- Heat 6/10 Major
- Air quality 2/10 Low 1 unhealthy d/yr today · 1 by 30 yrs out
Nearby sold comps map
Loading sold comps map…
Walkable amenities ~0.75 mi
Loading nearby amenities…
Taxation est. · year 1
- Rental income
- $20,954
- − Mortgage interest
- −$3,641
- − Property taxes
- −$975
- − Insurance
- −$325
- − Repairs & maintenance
- −$1,676
- − Management
- −$1,676
- − Depreciation
- −$1,891
- Taxable income
- $10,770
- Est. tax owed @ 24.0%
- −$2,585
- After-tax cash flow
- $8,579/yr
For passive investors: Depreciation is non-cash, so a rental often shows a tax loss while cash-flowing — sheltering income. Rental losses are passive: they offset passive income freely, and up to $25,000/yr can offset ordinary (W-2) income if you actively participate and your MAGI is under $100k (phasing out to $0 by $150k); unused losses carry forward. On sale, claimed depreciation is recaptured at up to 25%, and gains may owe capital-gains tax (a 1031 exchange can defer both). Figures are a year-1 estimate at your 24.0% rate — not tax advice; consult a CPA.
Condition & rehab AI · 1 photo
This mobile home requires moderate repairs and maintenance to improve its condition and value. Key areas needing attention include the exterior siding, flooring, and interior walls.
Repairs flagged
- Major siding — Significant wear and tear
- Major flooring — Worn and uneven
- Major interior walls — Painted walls show wear
Value-add opportunities
- Resale paint exterior — Enhances curb appeal
- Rental replace flooring — Improves tenant satisfaction
- Both repair walls — Restores structural integrity and aesthetic appeal
Renovation cost estimate screening
| Repair item | Severity | Est. cost |
|---|---|---|
| siding · Significant wear and tear | Major | $15,000–50,000 |
| flooring · Worn and uneven | Major | $15,000–50,000 |
| interior walls · Painted walls show wear | Major | $15,000–50,000 |
| Total estimated repair cost · 3 items | $45,000–150,000 |
Value-add ROI direction
- Resale paint exterior — Enhances curb appeal ↑
- Rental replace flooring — Improves tenant satisfaction ↑
- Both repair walls — Restores structural integrity and aesthetic appeal ↑
ⓘ Cost ranges are severity-bucket heuristics (US national rule-of-thumb). Get contractor quotes + a written scope before underwriting a rehab budget.
Schools (NCES district)
- District
- Auburn City
- NCES district ID
- 0100210
- Math proficiency
- 51% ▼ -21.00%
- Reading proficiency
- 69% ▲ 5.00%
- Median HH income
- $38,126
- Composite
- 49.87/100
- National rank
- #1944
- State rank
- #7 of 129 in AL
Livability — Auburn
- Score
- 80/100
- State rank
- #6
- US rank
- #1842
Category grades
Schools grade is shown separately in the Schools card above.
Census & demographics
- Census place
- Auburn, AL
- County
- Lee County · 144,175 people
- City population
- 80,251
- Metro
- Auburn-Opelika, AL
- Population (ZIP)
- 30,959
- Household income
- $42,717
- Rent vs Own
- Severe rent burden
- 2503.0
Population outlook (Lee County) Hauer SSP2
- Today (2025)
- 196,440 people
- By 2030
- 217,417 · +10.7%
- By 2040
- 259,467 · +32.1%
- By 2050
- 301,557 · +53.5%
- By 2075
- 402,186 · +104.7%
- By 2100
- 474,503 · +141.6%
Race, ethnicity, and origin ACS 2023
- Neighborhood character
- Diverse neighborhood (Simpson 0.58)
- Race & ethnicity
- White 59% Black 26% Asian 6% Hispanic / Latino 6% Two or more races 4%
- Hispanic origin (detail)
- Mexican 3%
- Common ancestry
- Italian 3% Slovak 2% Serbian 1%
- Foreign-born
- 8% · South Korea, Canada, China
- Languages at home
- 89% English-only · Spanish 4% Korean 2% Chinese 1%
Political lean MEDSL · Lee
- 2024 margin
- Strong R (+27.8) · D 35.5% · R 63.3% · Other 1.2%
- 2008→2024 swing
- -8.1pp toward R · 2008: -19.8pp · 2024: -27.8pp
- All cycles
- 2024: R+27.8 2020: R+20.1 2016: R+23.1 2012: R+19.9 2008: R+19.8
Not yet ingested
- Civics
- —
Market trends
- HPI YoY
- ▼ -75.65%
- Current HPI
- 248.9059
- Rent YoY
- ▲ 6.18%
- Metro
- Auburn-Opelika, AL
- State GDP YoY
- ▲ 2.94%
- F500 in state
- 4
Industry mix (Fortune 500 HQ in AL)
| Industry | F500 HQs | Revenue |
|---|---|---|
| Financial Services | 1 | $8B |
|
||
| Healthcare | 1 | $5B |
|
||
Price history
+3413.5% since first listed8 events — show timeline
- 2026-05-24 Listed $65,000 FSBO.com
- 2025-05-11 Rental Removed $625 APPFOLIO
- 2025-05-02 Price Changed $625 APPFOLIO
- 2025-04-17 Listed for Rent $650 APPFOLIO
- 2024-07-20 Rental Removed $1,650 RENT.
- 2024-07-10 Price Changed $1,650 RENT.
- 2024-06-25 Listed for Rent $1,850 RENT.
- 2023-07-24 Rental Removed — APPFOLIO
Cash-flow waterfall
monthlySold comps — $/sqft
last 12 mo · ≤1 miLoading sold comps…