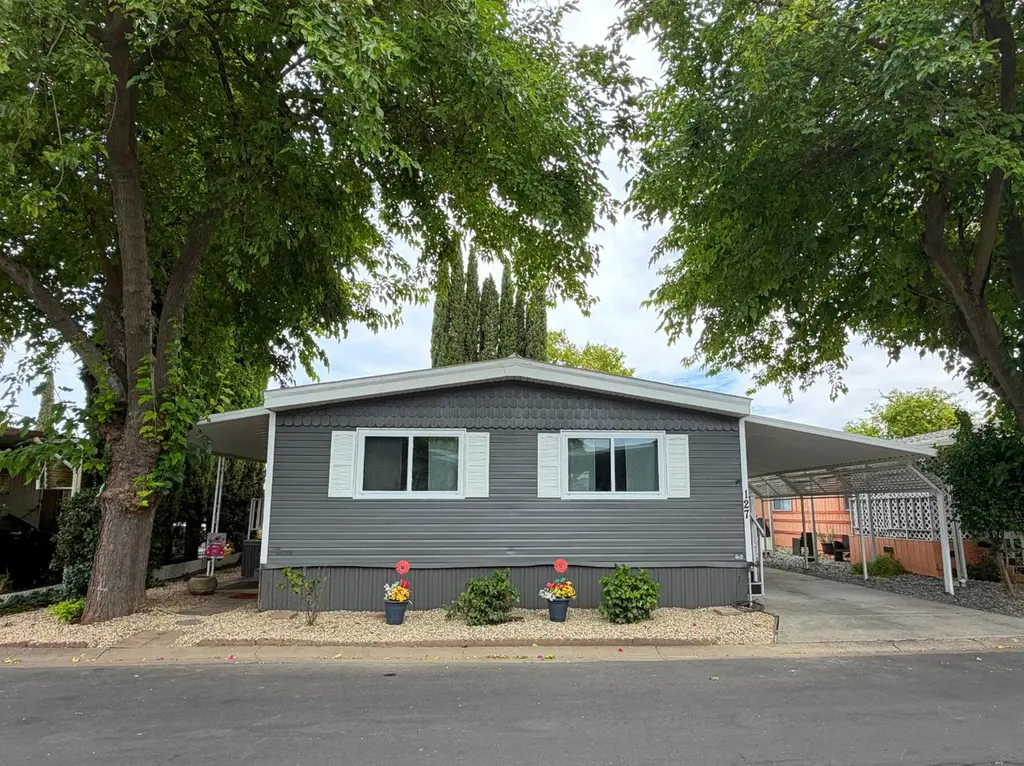
3901 Lake Rd #127 · West Sacramento, CA
Flood risk 6/10 · Moderate
- FEMA flood zone
- —
- Chance of flooding over 30 yrs
- 0.26%
- Est. flood insurance / yr
- —
Fire risk 5/10 · Moderate
- Est. fire insurance / yr
- $659 – $1,223
Heat risk 7/10 · Major
- Hot days now (above 103°F)
- 7 days/yr
- Hot days in 30 yrs
- 14 days/yr
Wind risk 1/10 · Minimal
- Chance of severe wind over 30 yrs
- —
Air-quality risk 10/10 · Severe
- Unhealthy air days now
- 29 days/yr
- Unhealthy air days in 30 yrs
- 31 days/yr
Risk factors via First Street. Map © Google.
Why this score? — see what drove the B grade
The composite is a weighted blend of 9 inputs, each scored 0–100. Each bar is that input's sub-score; the figure is the points it added to the 100-point composite (weight × sub-score).
- Cash flow +30.0/30.0
- 1% rule +10.0/10.0
- DSCR +10.0/10.0
- ARV discount +7.5/15.0
- Condition / age +4.0/5.0
- Schools +3.8/10.0
- Livability +3.7/5.0
- Rent growth +3.0/5.0
- Appreciation +0.0/10.0
$99,000
🖨 Deal sheet (PDF) 📄 Offer letter ✓ Due diligence
Listing remarks
Welcome home to this beautifully updated 960 sq. ft. double-wide manufactured home offering 2 bedrooms, 1 bathroom, and a perfect blend of comfort, style, and affordability. Fresh interior and exterior paint, including newly painted awnings, enhance the curb appeal, and the deck and stairs feature durable indoor/outdoor carpeting for added enjoyment. Inside, LVP flooring flows throughout the main living areas, complemented by plush carpet in the bedrooms and living room. The remodeled kitchen has new LED lighting, updated cabinet doors and hardware, newly glazed countertops, and stainless steel appliances, including a stove, dishwasher, range hood, and island for added storage. The bathroom
Key facts
- Remodeled kitchen
- New led lighting
- Refreshed bathroom
Tags
Property features AI
Finance
- Other: Located at 3901 Lake Rd #127, West Sacramento, CA 95691; Directions available: Hwy 50 to 80 exit Enterprise Blvd, left on Lake Rd, go past the RV/campground; Lake Rd turns into Thor, turn right onto Odin at the Valhalla sign
- Financial info: Land lease: No (land lease amount listed separately)
- HOA & community: No homeowners association
Exterior
- Parking: Attached covered parking; no garage
- Utilities: Cable connected; Individual electric meter; Individual gas meter; Public water; Public sewer
- Home design: Manufactured home in park; Double-wide; Built in 1974; Located in a senior community
- Construction: Aluminum skirting; Kingston manufactured home
- Exterior features: Elastomeric roof; Shed(s) on property; Other lot features
Interior
- Kitchen: Free standing gas range; Laminate counters
- Bedrooms: 2 bedrooms
- Flooring: Carpet
- Bathrooms: 1 full bathroom with tub/shower over
- Heating & cooling: Central heating; Central cooling
- Interior features: Free standing gas range; Laminate countertops; Deck attached to the living area; Porch steps with railing; Covered patio; Pets allowed
- Laundry & utility: Washer and dryer included; 220V outlet in laundry area
Neighborhood map
What this means for you Summary
Snapshot
- This is a 2-bed/1.0-bath manufactured listed at $99k. Condition is rated good.
Deal economics
- At list price, monthly cash flow is $904 ($11k/yr) — positive.
- The deal already cash-flows at list — no discount required.
- Meets the 1% rule at list price ($2k rent vs $99k).
Location & tenants
- Location reads 73/100 on livability (#164 in CA) — a middle-class / working-renter tenant base. Strengths: housing A+, commute A, employment A-; Watch: cost of living F.
- Washington Unified (suburban): math 30% / reading 57% proficiency, ranked #197 of 517 in CA (top 38%) — families likely to look elsewhere, expect single-tenant / working-renter base with shorter leases.
- Market conditions: Rents rising (+1.9%/yr); 151 active listings in the ZIP; solid renter incomes; 721 units permitted in Yolo County in 2024 (260 in 5+ unit buildings).
Forward outlook
- Local home prices are declining (-3.0%/yr); year-one equity from $684 of loan paydown is wiped out by about $3k of value loss. Plan a longer hold.
- Yolo County population projected at +31% by 2050 — long-run rental-demand tailwind backs the buy-and-hold thesis.
- At projected returns (-3.0% appreciation + 1.9% rent growth), your $28k cash investment doubles in ~4 years — after that, you're playing with house money.
Negotiation context
- Only 9 days on market — expect competitive offers; lowballing is unlikely to land.
Risks & watch-outs
- Climate carrying-cost: major flood risk; moderate wildfire risk; extreme-heat days projected 7→14/yr by 2055 (HVAC capex compounding) — expect insurance premiums to compound above CPI over the hold.
Questions for the listing agent
- Built in 1974 — when were the roof, HVAC, electrical panel, plumbing, and water heater last replaced?
- Is there a deadline driving the sale (1031 exchange, divorce, estate, relocation)? That informs how much negotiation room exists.
- What's the average days-on-market for RENTAL listings here right now (not sales)? A rising rental-DOM trend means longer vacancies and softer asking-rent achievability than the comps imply.
- What's the recent tenant-quality profile in this submarket — average credit score on applications, eviction rate, late-payment / NSF rate, and stable-employment percentage? A property-management company in the area should have these aggregated.
- How much new for-sale + rental construction is in the pipeline within 1–3 miles? Heavy new supply typically softens prices + rents 12–24 months out; constrained supply supports both.
Investment metrics
- 1% rule
- 2.03% ✓
- Cap rate
- 17.25%
- Cash-on-cash
- 39.12%
- DSCR
- 2.74
- GRM
- 4.1
CMA / ARV
No comps found within radius.
Projected returns pro-forma
-3.0% appreciation · 1.87% rent growth · sell at horizon
- IRR
- 34.1%
- Equity multiple
- 2.42×
- Total profit
- $39,283
- Equity at exit
- $14,761
- IRR
- 40.4%
- Equity multiple
- 4.59×
- Total profit
- $99,377
- Equity at exit
- $8,560
Cash invested: $27,720 (down + closing). Projections, not guarantees.
Landlord ↔ Tenant lean methodology
- Overall (STATE)
- 18 Strongly Tenant-Friendly
- State California
- 18 Strongly Tenant-Friendly · D+13
- County
- — inherits STATE
- City
- — inherits STATE
ZIP-level market 95691
- Home prices YoY
- -35.0%
- Rents YoY
- 1.9%
- Active inventory
- 151
- Price-to-rent
- 4.1×
Monthly cashflow live
- Estimated rent
- $2,010 medium interval (Pro) →
- Mortgage (P&I)
- −$519
- Tax est. 1.5%
- −$124 /mo · $1,485/yr
- Insurance
- −$41
- HOA
- −$0
- Vacancy / Maint / Mgmt
- −$422
- Net cashflow
- $904
Break-even live
Sensitivity live
| Price | -10% $972 | -5% $938 | +0% $904 | +5% $869 | +10% $835 |
|---|---|---|---|---|---|
| Rent | -10% $745 | -5% $824 | +0% $904 | +5% $983 | +10% $1,062 |
| Rate | -1.0pp $954 | -0.5pp $929 | base $904 | +0.5pp $878 | +1.0pp $852 |
UW: 25.0% down · 7.5% · 30yr · 1.5% tax · 5.0% vac · 8.0% maint · 8.0% mgmt
Financing live
Cash to close
- Down payment
- $24,750
- Closing costs
- $2,970
- Reserves months
- —
- Total cash needed
- —
Loan-product check · same deal, 3 products live
Conventional
25% down · 7.5% · 30yr
- Down + closing
- —
- Monthly P&I
- —
- Monthly cashflow
- —
- DSCR
- —
- Eligible?
- —
Personal DTI + credit; lowest rate.
DSCR
20% down · 8.5% · 30yr
- Down + closing
- —
- Monthly P&I
- —
- Monthly cashflow
- —
- DSCR
- —
- Eligible?
- —
No personal income docs; deal must DSCR.
Hard money
10% down · 12.0% · 12mo
- Down + closing
- —
- Monthly P&I
- —
- Monthly cashflow
- —
- DSCR
- —
- Eligible?
- —
Short-term bridge; refi at stabilization.
Listing history 8 events
-
2026-06-19days on market $99,000 Active 9 DOM
-
2026-06-18days on market $99,000 Active 8 DOM
-
2026-06-17days on market $99,000 Active 7 DOM
-
2026-06-16days on market $99,000 Active 6 DOM
-
2026-06-15days on market $99,000 Active 5 DOM
-
2026-06-14days on market $99,000 Active 3 DOM
-
2026-06-12remarks 699-char remark
-
2026-06-12$99,000 Active 2 DOM
ⓘ Source: listings_history table (triggers on properties + properties_extension) + one-shot
backfill from property_details.listing_events for pre-trigger history.
Climate risk First Street
- Flood 6/10 Major 26% chance over 30 yrs
- Wildfire 5/10 Major
- Heat 7/10 Severe 7 d/yr ≥103°F today · 14 d/yr by 30 yrs out
- Wind 1/10 Low
- Air quality 10/10 Extreme 29 unhealthy d/yr today · 31 by 30 yrs out
Nearby sold comps map
Loading sold comps map…
Walkable amenities ~0.75 mi
Loading nearby amenities…
Taxation est. · year 1
- Rental income
- $24,119
- − Mortgage interest
- −$5,546
- − Property taxes
- −$1,485
- − Insurance
- −$495
- − Repairs & maintenance
- −$1,930
- − Management
- −$1,930
- − Depreciation
- −$2,880
- Taxable income
- $9,854
- Est. tax owed @ 24.0%
- −$2,365
- After-tax cash flow
- $8,479/yr
For passive investors: Depreciation is non-cash, so a rental often shows a tax loss while cash-flowing — sheltering income. Rental losses are passive: they offset passive income freely, and up to $25,000/yr can offset ordinary (W-2) income if you actively participate and your MAGI is under $100k (phasing out to $0 by $150k); unused losses carry forward. On sale, claimed depreciation is recaptured at up to 25%, and gains may owe capital-gains tax (a 1031 exchange can defer both). Figures are a year-1 estimate at your 24.0% rate — not tax advice; consult a CPA.
Condition & rehab AI · 13 photos
This beautifully updated 960 sq. ft. double-wide manufactured home offers 2 bedrooms, 1 bathroom, and a perfect blend of comfort, style, and affordability. The home has been recently painted and updated with new flooring and appliances, making it move-in ready.
Value-add opportunities
- Both update the flooring to hardwood — hardwood flooring is more durable and aesthetically pleasing
- Both update the kitchen appliances — newer appliances will attract more buyers
- Both update the exterior siding — new siding will improve curb appeal and increase property value
Renovation cost estimate screening
Value-add ROI direction
- Both update the flooring to hardwood — hardwood flooring is more durable and aesthetically pleasing ↑
- Both update the kitchen appliances — newer appliances will attract more buyers ↑
- Both update the exterior siding — new siding will improve curb appeal and increase property value ↑
ⓘ Cost ranges are severity-bucket heuristics (US national rule-of-thumb). Get contractor quotes + a written scope before underwriting a rehab budget.
Schools (NCES district)
- District
- Washington Unified
- NCES district ID
- 0641580
- Math proficiency
- 30% ▼ -2.00%
- Reading proficiency
- 57% ▲ 12.00%
- Median HH income
- $55,207
- Composite
- 37.79/100
- National rank
- #4339
- State rank
- #197 of 517 in CA
Livability — West Sacramento
- Score
- 73/100
- State rank
- #164
- US rank
- #5389
Category grades
Schools grade is shown separately in the Schools card above.
Census & demographics
- Census place
- West Sacramento, CA
- County
- Yolo County · 212,115 people
- City population
- 55,039
- Metro
- Sacramento-Roseville-Folsom, CA
- Population (ZIP)
- 40,143
- Household income
- $104,750
- Rent vs Own
- Severe rent burden
- 1109.0
Population outlook (Yolo County) Hauer SSP2
- Today (2025)
- 242,183 people
- By 2030
- 257,662 · +6.4%
- By 2040
- 288,050 · +18.9%
- By 2050
- 318,202 · +31.4%
- By 2075
- 392,736 · +62.2%
- By 2100
- 438,150 · +80.9%
Race, ethnicity, and origin ACS 2023
- Neighborhood character
- Diverse neighborhood (Simpson 0.69)
- Race & ethnicity
- White 45% Hispanic / Latino 29% Two or more races 17% Asian 14% Black 3% Native American 1%
- Hispanic origin (detail)
- Mexican 24%
- Common ancestry
- Italian 4% Scotch-Irish 3% Lithuanian 2%
- Foreign-born
- 19% · Canada, China, Vietnam
- Languages at home
- 69% English-only · Spanish 15% Other Indo-European 6% Russian/Polish/Slavic 3%
Political lean MEDSL · Yolo
- 2024 margin
- Solid D (+36.2) · D 66.3% · R 30.1% · Other 3.6%
- 2008→2024 swing
- 0.0pp no change · 2008: 36.2pp · 2024: 36.2pp
- All cycles
- 2024: D+36.2 2020: D+41.4 2016: D+42.0 2012: D+33.2 2008: D+36.2
Not yet ingested
- Civics
- —
Market trends
- HPI YoY
- ▼ -170.47%
- Current HPI
- 316.9399
- Rent YoY
- ▲ 1.87%
- Metro
- Sacramento-Roseville-Folsom, CA
- State GDP YoY
- ▲ 3.21%
- F500 in state
- 116
Industry mix (Fortune 500 HQ in CA)
| Industry | F500 HQs | Revenue |
|---|---|---|
| Technology | 27 | $1,492B |
|
||
| Financial Services | 3 | $174B |
|
||
| Retail | 3 | $44B |
|
||
| Insurance | 3 | $26B |
|
||
| Media / Entertainment | 2 | $115B |
|
||
| Pharmaceuticals / Biotech | 2 | $62B |
|
||
Cash-flow waterfall
monthlySold comps — $/sqft
last 12 mo · ≤1 miLoading sold comps…