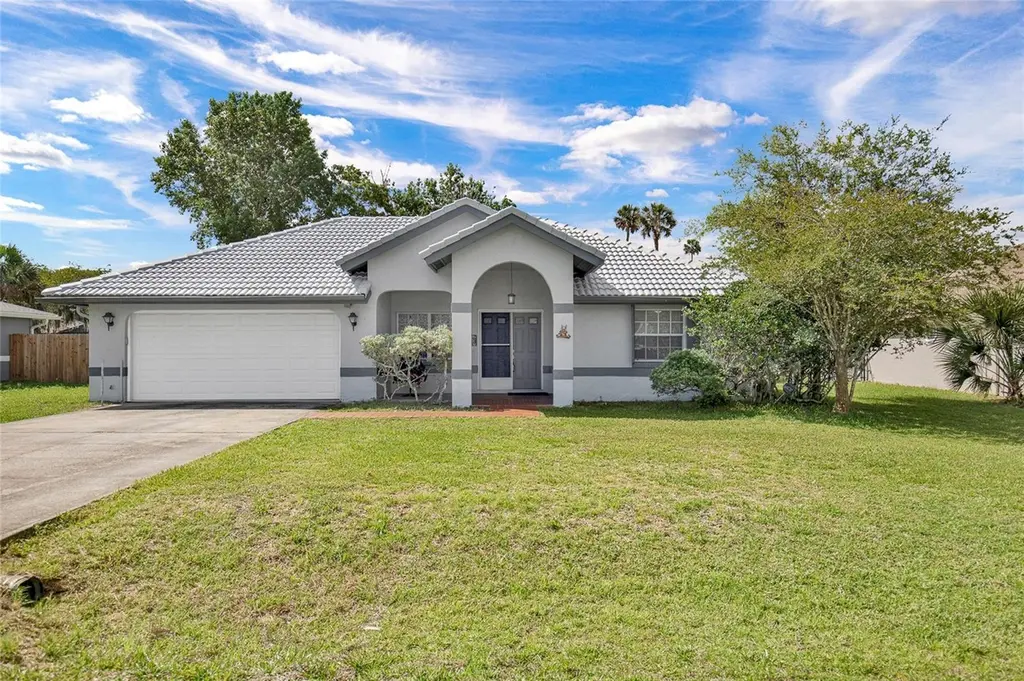
9 Blackberry Pl · Palm Coast, FL
Flood risk 5/10 · Moderate
- FEMA flood zone
- X (unshaded)
- Chance of flooding over 30 yrs
- 0.47%
- Est. flood insurance / yr
- $507 – $1,088
Fire risk 4/10 · Minor
- Est. fire insurance / yr
- $947 – $1,759
Heat risk 9/10 · Severe
- Hot days now (above 106°F)
- 7 days/yr
- Hot days in 30 yrs
- 21 days/yr
Wind risk 10/10 · Severe
- Chance of severe wind over 30 yrs
- 99.0%
Air-quality risk 2/10 · Minimal
- Unhealthy air days now
- 2 days/yr
- Unhealthy air days in 30 yrs
- 2 days/yr
Risk factors via First Street. Map © Google.
Why this score? — see what drove the C grade
The composite is a weighted blend of 9 inputs, each scored 0–100. Each bar is that input's sub-score; the figure is the points it added to the 100-point composite (weight × sub-score).
- Cash flow +19.1/30.0
- ARV discount +15.0/15.0
- DSCR +6.0/10.0
- Schools +4.6/10.0
- 1% rule +4.2/10.0
- Livability +3.5/5.0
- Rent growth +2.7/5.0
- Condition / age +2.5/5.0
- Appreciation +0.0/10.0
$279,900
🖨 Deal sheet 📄 Offer letter ✓ Due diligence
Listing remarks MLS
Investor Alert! Handyman special.
Key facts
- Screened patio
- Open floor plan
- Laminate flooring
Tags
Property features AI
Finance
- Other: Homestead exempt; No lease restrictions
- HOA & community: Pets allowed: cats and dogs; Located in the Woodlands development
Exterior
- Parking: Attached garage with 2 spaces
- Utilities: Public sewer; Water connected; Electricity connected; Cable available; Phone available; Broadband/high-speed internet available; Public utilities
- Home design: Single family residence; One-story home; North-facing
- Construction: Stucco construction; Tile roof; Slab foundation; Built as completed (residence)
- Exterior features: Rain gutters; Asphalt road access
Interior
- Kitchen: Dishwasher; Microwave; Range; Refrigerator
- Bedrooms: 3 bedrooms
- Flooring: Tile
- Bathrooms: 2 full bathrooms
- Heating & cooling: Heat pump heating; Central air conditioning
- Interior features: Ceiling fans; Walk-in closet(s)
- Laundry & utility: Laundry area in garage
Neighborhood map
What this means for you Summary
Snapshot
- This is a 3-bed/2.0-bath single-family listed at $280k.
Deal economics
- At list price, monthly cash flow is $299 ($4k/yr) — positive.
- The deal already cash-flows at list — no discount required.
- To meet the 1% rule (rent ≥ 1% of price), the offer needs to be $258k (7.8% below list).
- Recommended offer: $258k (7.8% below list) — sets the bar for 1% rule.
- Cap rate 7.6% vs local median 3.8% in Palm Coast — top-decile yield for the area; either an underpriced asset or a hidden risk that comps aren't pricing in. Stress-test before assuming the spread holds.
Location & tenants
- Location reads 69/100 on livability (#478 in FL) — a middle-class / working-renter tenant base. Strengths: housing A+, health & safety A+, cost of living B+; Watch: amenities F, commute F.
- Flagler (rural): math 53% / reading 56% proficiency, ranked #20 of 73 in FL (top 27%) — acceptable for families but not a draw, mixed tenant base, ~2y average lease.
- Zoned schools: Old Kings Elementary School (math 74% / reading 72%, grade A, #271 of 2,144 statewide, top 13%, 979 students, 52% FRL); Flagler-Palm Coast High School (math 36% / reading 51%, grade F, #248 of 667 statewide, top 38%, 2,523 students, 52% FRL) — zoned schools at 52% FRL track the district average.
- Market conditions: Rents flat; 1600 active listings in the ZIP; 8 comparable units currently listed for rent nearby; rentals at typical pace (median 24d on market — plan ~3-4 weeks tenant-placement turnaround); solid renter incomes; 2,588 units permitted in Flagler County in 2024 (0 in 5+ unit buildings).
- This rent runs 37% of the median local income ($84k/yr) — at the standard rent-burdened threshold; future hikes will face affordability resistance.
Forward outlook
- Local home prices are declining (-3.0%/yr); year-one equity from $2k of loan paydown is wiped out by about $8k of value loss. Plan a longer hold.
- Flagler County population projected at +28% by 2050 — long-run rental-demand tailwind backs the buy-and-hold thesis.
Negotiation context
- It's been on market 24 days — a 2% lower offer ($276k) is reasonable based on typical stale-listing flexibility.
- 6 sale attempts since 13y ago with the ask held roughly flat each time — persistent listings suggest the price (not the market) is what's stuck; bring a comps-based counter.
- Current owner paid $160k; list at $280k implies a 75% gain — meaningful room to come down on a strong offer.
Risks & watch-outs
- Climate carrying-cost: moderate flood risk; severe wind risk, 99% chance of damaging wind over 30y; extreme-heat days projected 7→21/yr by 2055 (HVAC capex compounding) — expect insurance premiums to compound above CPI over the hold.
Questions for the listing agent
- Is there a deadline driving the sale (1031 exchange, divorce, estate, relocation)? That informs how much negotiation room exists.
- What's the average days-on-market for RENTAL listings here right now (not sales)? A rising rental-DOM trend means longer vacancies and softer asking-rent achievability than the comps imply.
- What's the recent tenant-quality profile in this submarket — average credit score on applications, eviction rate, late-payment / NSF rate, and stable-employment percentage? A property-management company in the area should have these aggregated.
- How much new for-sale + rental construction is in the pipeline within 1–3 miles? Heavy new supply typically softens prices + rents 12–24 months out; constrained supply supports both.
Investment metrics
- 1% rule
- 0.92% ✗
- Cap rate
- 7.58%
- Cash-on-cash
- 4.58%
- DSCR
- 1.20
- GRM
- 9.0
CMA / ARV
- ARV (on-the-fly)
- $343,224
- Comps found
- 12
Show comp detail 12 sales within ~0.75 mi
| Address | Dist | Beds/Ba | Sqft | Sold | Price | $/sf | Match |
|---|---|---|---|---|---|---|---|
| 2 Black Oak Ct | 0.08mi | 4/2.0 (+1) | 2,107 (+3%) | 4mo | $295,000 | $140 | 83 |
| 81 Black Bear Ln | 0.14mi | 4/2.0 (+1) | 2,015 (-1%) | 15mo | $328,000 | $163 | 74 |
| 20 Blakeshire Pl | 0.40mi | 3/2.0 | 2,086 (+2%) | 11mo | $250,000 | $120 | 69 |
| 1 Blakeshire Pl | 0.45mi | 3/2.0 | 2,084 (+2%) | 12mo | $350,000 | $168 | 66 |
| 108 Black Bear Ln | 0.11mi | 3/2.0 | 1,810 (-11%) | 13mo | $280,000 | $155 | 64 |
| 7 Blackthorn Ct | 0.12mi | 3/2.0 | 1,761 (-14%) | 10mo | $239,000 | $136 | 63 |
| 59 Blakeport Ln | 0.52mi | 4/2.0 (+1) | 2,036 (-0%) | 10mo | $330,000 | $162 | 62 |
| 58 Blare Castle Dr | 0.60mi | 4/2.5 (+1) | 2,086 (+2%) | 1mo | $355,000 | $170 | 61 |
| 4 Blakeview Ct | 0.47mi | 3/2.0 | 1,781 (-13%) | 1mo | $355,000 | $199 | 56 |
| 30 Blakeshire Pl | 0.39mi | 4/2.0 (+1) | 1,907 (-7%) | 13mo | $377,000 | $198 | 55 |
| 20 Blare Dr | 0.30mi | 3/2.0 | 1,769 (-13%) | 13mo | $342,500 | $194 | 53 |
| 17 Blakeshire Pl | 0.43mi | 3/2.0 | 1,804 (-12%) | 12mo | $302,500 | $168 | 51 |
Match score weights: distance 35% · size 25% · config 20% · recency 20%. Top-matched comps best support the ARV.
Projected returns pro-forma
-3.0% appreciation · 0.85% rent growth · sell at horizon
- IRR
- -11.4%
- Equity multiple
- 0.59×
- Total profit
- $-31,839
- Equity at exit
- $41,734
- IRR
- -5.4%
- Equity multiple
- 0.68×
- Total profit
- $-24,986
- Equity at exit
- $24,201
Cash invested: $78,372 (down + closing). Projections, not guarantees.
Landlord ↔ Tenant lean methodology
- Overall (STATE)
- 87 Strongly Landlord-Friendly
- State Florida
- 87 Strongly Landlord-Friendly · R+3
- County
- — inherits STATE
- City
- — inherits STATE
ZIP-level market 32137
- Home prices YoY
- -34.5%
- Rents YoY
- 0.8%
- Active inventory
- 1600
- Price-to-rent
- 9.0×
Monthly cashflow live
- Estimated rent
- $2,581 high interval (Pro) →
- Mortgage (P&I)
- −$1,468
- Tax from tax record
- −$155 /mo · $1,858/yr
- Insurance
- −$117
- HOA
- −$0
- Vacancy / Maint / Mgmt
- −$542
- Net cashflow
- $299
Break-even live
UW: 25.0% down · 7.5% · 30yr · 1.5% tax · 5.0% vac · 8.0% maint · 8.0% mgmt
Financing live
Cash to close
- Down payment
- $69,975
- Closing costs
- $8,397
- Reserves months
- —
- Total cash needed
- —
Loan-product check · same deal, 3 products live
Conventional
25% down · 7.5% · 30yr
- Down + closing
- —
- Monthly P&I
- —
- Monthly cashflow
- —
- DSCR
- —
- Eligible?
- —
Personal DTI + credit; lowest rate.
DSCR
20% down · 8.5% · 30yr
- Down + closing
- —
- Monthly P&I
- —
- Monthly cashflow
- —
- DSCR
- —
- Eligible?
- —
No personal income docs; deal must DSCR.
Hard money
10% down · 12.0% · 12mo
- Down + closing
- —
- Monthly P&I
- —
- Monthly cashflow
- —
- DSCR
- —
- Eligible?
- —
Short-term bridge; refi at stabilization.
Rent comps 8 comps
| Address | Beds | Baths | Sqft | Rent | $/sqft | DOM | Units | Dist |
|---|---|---|---|---|---|---|---|---|
| 10 Blackfoot Ct Palm Coast, FL | 4.0 | 2.0 | 2231 | $2,900 | $1.30 | 23d | 1 | 0.11mi |
| 8 Blare Dr Palm Coast, FL | 2.0 | 2.0 | 1428 | $1,650 | $1.16 | 11d | 1 | 0.32mi |
| 18 Preston Ln Palm Coast, FL | 3.0 | 2.0 | 1832 | $2,200 | $1.20 | 3d | 1 | 1.08mi |
| 16 Courtney Pl Palm Coast, FL | 2.0 | 2.0 | 1510 | $2,100 | $1.39 | 23d | 1 | 1.20mi |
| 27 Cooper Ln Palm Coast, FL | 3.0 | 2.0 | 1446 | $6,500 | $4.50 | 23d | 1 | 1.30mi |
| 87 Patric Dr Palm Coast, FL | 4.0 | 3.0 | 2900 | $2,300 | $0.79 | 3d | 1 | 1.37mi |
| 1200 Canopy Walk Ln #1235 Palm Coast, FL | 3.0 | 2.0 | 1712 | $2,550 | $1.49 | 23d | 1 | 1.44mi |
| 124 Plainview Dr Unit B Palm Coast, FL | 3.0 | 2.0 | 1600 | $1,650 | $1.03 | 3d | 1 | 1.49mi |
Listing history 29 events
-
2026-06-18days on market $279,900 Active 24 DOM
-
2026-06-17days on market $279,900 Active 23 DOM
-
2026-06-16days on market $279,900 Active 22 DOM
-
2026-06-15days on market $279,900 Active 21 DOM
-
2026-06-14days on market $279,900 Active 19 DOM
-
2026-06-13days on market $279,900 Active 18 DOM
-
2026-06-10days on market $279,900 Active 16 DOM
-
2026-06-09days on market $279,900 Active 15 DOM
-
2026-06-08days on market $279,900 Active 14 DOM
-
2026-06-07days on market $279,900 Active 13 DOM
-
2026-06-03days on market $279,900 Active 9 DOM
-
2026-06-02days on market $279,900 Active 8 DOM
-
2026-06-01days on market $279,900 Active 7 DOM
-
2026-05-31days on market $279,900 Active 6 DOM
-
2026-05-31days on market $279,900 Active 5 DOM
-
2026-05-25$279,900 Active
-
2026-05-11historical
-
2026-04-14$285,000 Active
-
2020-03-18soldstatus $160,000
-
2020-03-11soldstatus $160,000 33-char remark
Show marketing remark (33 chars)
Investor Alert! Handyman special.
-
2020-02-15$179,500 33-char remark
Show marketing remark (33 chars)
Investor Alert! Handyman special.
-
2015-01-07soldstatus $120,000
-
2015-01-06soldstatus $120,000
-
2014-10-04$127,900
-
2014-08-14$127,900
-
2014-07-14soldstatus $92,000
-
2014-07-11soldstatus $92,000
-
2013-11-25$96,000
-
1988-12-01soldstatus $92,500
ⓘ Source: listings_history table (triggers on properties + properties_extension) + one-shot
backfill from property_details.listing_events for pre-trigger history.
Tax reassessment forecast FL · Resets to sale price
- Current annual tax
- $1,858 · $155/mo
- Projected year-2 tax
- $2,323 · $194/mo
- Expected delta
- +$465/yr (+$39/mo · 25.0%)
ⓘ Screening estimate from a state-policy table — verify with the county assessor before closing.
Climate risk First Street
- Flood 5/10 Major FEMA zone X (unshaded) · 47% chance over 30 yrs
- Wildfire 4/10 Moderate
- Heat 9/10 Extreme 7 d/yr ≥106°F today · 21 d/yr by 30 yrs out
- Wind 10/10 Extreme 99% chance of damaging wind over 30 yrs
- Air quality 2/10 Low 2 unhealthy d/yr today · 2 by 30 yrs out
Nearby sold comps map
Loading sold comps map…
Walkable amenities ~0.75 mi
Loading nearby amenities…
Taxation est. · year 1
- Rental income
- $30,967
- − Mortgage interest
- −$15,679
- − Property taxes
- −$1,858
- − Insurance
- −$1,400
- − Repairs & maintenance
- −$2,477
- − Management
- −$2,477
- − Depreciation
- −$8,143
- Taxable loss
- −$1,067
- Est. tax savings @ 24.0%
- +$256
- After-tax cash flow
- $3,848/yr
For passive investors: Depreciation is non-cash, so a rental often shows a tax loss while cash-flowing — sheltering income. Rental losses are passive: they offset passive income freely, and up to $25,000/yr can offset ordinary (W-2) income if you actively participate and your MAGI is under $100k (phasing out to $0 by $150k); unused losses carry forward. On sale, claimed depreciation is recaptured at up to 25%, and gains may owe capital-gains tax (a 1031 exchange can defer both). Figures are a year-1 estimate at your 24.0% rate — not tax advice; consult a CPA.
Schools (NCES district)
- District
- Flagler
- NCES district ID
- 1200540
- Math proficiency
- 53% ▼ -9.00%
- Reading proficiency
- 56% ▼ -4.00%
- Median HH income
- $48,354
- Composite
- 46.35/100
- National rank
- #2464
- State rank
- #20 of 73 in FL
Livability — Palm Coast
- Score
- 69/100
- State rank
- #478
- US rank
- #8721
Category grades
Schools grade is shown separately in the Schools card above.
Census & demographics
- Census place
- Palm Coast, FL
- County
- Flagler County · 113,412 people
- City population
- 105,049
- Metro
- Deltona-Daytona Beach-Ormond Beach, FL
- Population (ZIP)
- 48,391
- Household income
- $83,923
- Rent vs Own
- Severe rent burden
- 816.0
Population outlook (Flagler County) Hauer SSP2
- Today (2025)
- 123,474 people
- By 2030
- 131,864 · +6.8%
- By 2040
- 146,176 · +18.4%
- By 2050
- 157,398 · +27.5%
- By 2075
- 177,990 · +44.2%
- By 2100
- 183,381 · +48.5%
Race, ethnicity, and origin ACS 2023
- Neighborhood character
- Predominantly White (77%)
- Race & ethnicity
- White 77% Hispanic / Latino 10% Two or more races 8% Black 6% Asian 3%
- Hispanic origin (detail)
- Puerto Rican 4% Cuban 1%
- Common ancestry
- Romanian 4% Russian 2% Lithuanian 2%
- Foreign-born
- 13% · Canada, Jamaica
- Languages at home
- 85% English-only · Spanish 7% Other Indo-European 3% Russian/Polish/Slavic 2%
Political lean MEDSL · Flagler
- 2024 margin
- Strong R (+28.2) · D 35.6% · R 63.8%
- 2008→2024 swing
- -29.8pp toward R · 2008: 1.6pp · 2024: -28.2pp
- All cycles
- 2024: R+28.2 2020: R+20.8 2016: R+20.6 2012: R+7.4 2008: D+1.6
Not yet ingested
- Civics
- —
Market trends
- HPI YoY
- ▼ -153.27%
- Current HPI
- 290.4607
- Rent YoY
- ▲ 0.85%
- Metro
- Deltona-Daytona Beach-Ormond Beach, FL
- State GDP YoY
- ▲ 3.28%
- F500 in state
- 36
Industry mix (Fortune 500 HQ in FL)
| Industry | F500 HQs | Revenue |
|---|---|---|
| Industrial Technology | 2 | $29B |
|
||
| Insurance | 2 | $17B |
|
||
| Retail | 1 | $60B |
|
||
| Technology Distribution | 1 | $58B |
|
||
| Homebuilding | 1 | $35B |
|
||
| Technology Manufacturing | 1 | $35B |
|
||
Price history
+202.6% since first listed14 events — show timeline
- 2026-05-25 Listed $279,900 Stellar MLS as Distributed by MLS Grid
- 2026-05-11 Listing Removed — Stellar MLS as Distributed by MLS Grid
- 2026-04-14 Listed $285,000 Stellar MLS as Distributed by MLS Grid
- 2020-03-18 Sold (Public Records) $160,000 Public Records
- 2020-03-11 Sold (MLS) $160,000 Stellar MLS as Distributed by MLS Grid
- 2020-02-15 Listed $179,500 Stellar MLS as Distributed by MLS Grid
- 2015-01-07 Sold (Public Records) $120,000 Public Records
- 2015-01-06 Sold (MLS) $120,000 Stellar MLS as Distributed by MLS Grid
- 2014-10-04 Listed $127,900 Daytona MLS
- 2014-08-14 Listed $127,900 Stellar MLS as Distributed by MLS Grid
- 2014-07-14 Sold (Public Records) $92,000 Public Records
- 2014-07-11 Sold (MLS) $92,000 Stellar MLS as Distributed by MLS Grid
- 2013-11-25 Listed $96,000 Stellar MLS as Distributed by MLS Grid
- 1988-12-01 Sold (Public Records) $92,500 Public Records
Property tax history
-1.2%/yrLatest (2025): $1,858 · +4.0% YoY. Source: county tax records.
Cash-flow waterfall
monthlySold comps — $/sqft
last 12 mo · ≤1 miLoading sold comps…