 Multi-family
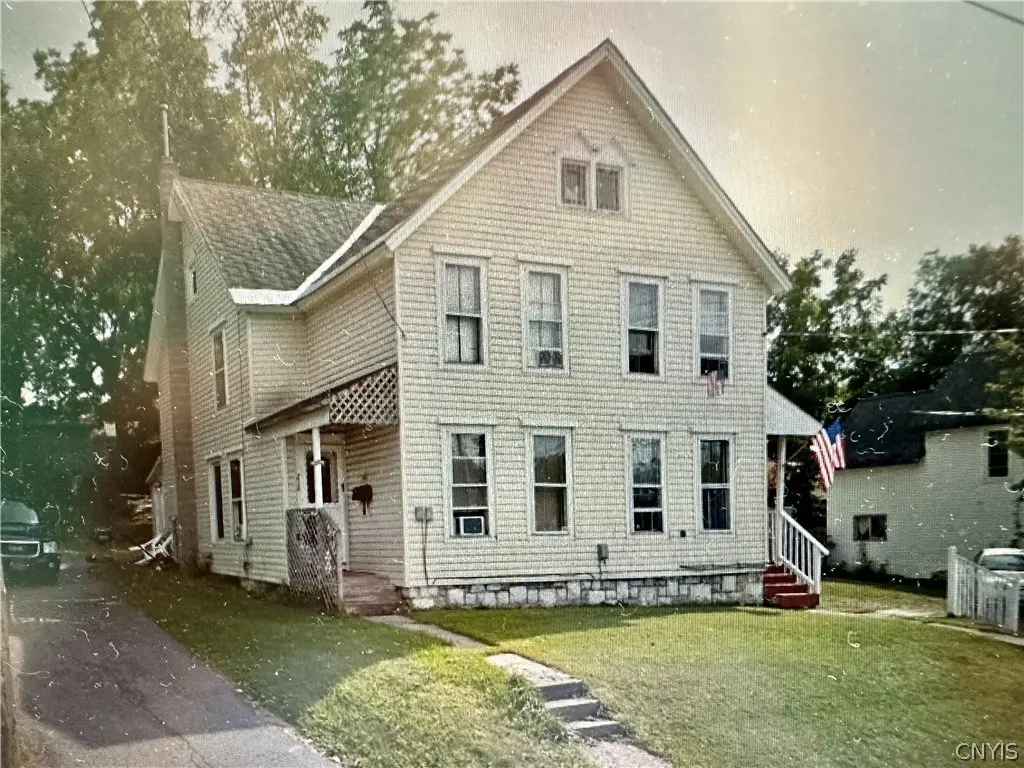
212 E Main St · Watertown, NY
Flood risk 1/10 · Minimal
- FEMA flood zone
- X
- Chance of flooding over 30 yrs
- 0.0%
- Est. flood insurance / yr
- $473 – $860
Fire risk 1/10 · Minimal
- Est. fire insurance / yr
- $691 – $1,283
Heat risk 2/10 · Minimal
- Hot days now (above 91°F)
- 7 days/yr
- Hot days in 30 yrs
- 15 days/yr
Wind risk 1/10 · Minimal
- Chance of severe wind over 30 yrs
- 0.0%
Air-quality risk 2/10 · Minimal
- Unhealthy air days now
- 1 days/yr
- Unhealthy air days in 30 yrs
- 1 days/yr
Risk factors via First Street. Map © Google.
Why this score? — see what drove the D+ grade
The composite is a weighted blend of 9 inputs, each scored 0–100. Each bar is that input's sub-score; the figure is the points it added to the 100-point composite (weight × sub-score).
- Cash flow +15.0/30.0
- ARV discount +7.5/15.0
- 1% rule +5.0/10.0
- DSCR +5.0/10.0
- Rent growth +5.0/5.0
- Schools +3.7/10.0
- Livability +3.4/5.0
- Condition / age +2.5/5.0
- Appreciation +0.0/10.0
$54,000
🖨 Deal sheet 📄 Offer letter ✓ Due diligence
Multi-family units
County records classify this as Multi-Family (2-4 Unit). Listing-text estimate: 1 unit. estimate disagrees with records
Listing remarks MLS
Seller financing available for this fixer upper in need of TLC (vandals cut some pipes and electric in one apartment). Seller can finance 40k with 5000 down or lease option with 3000 down, monthly payments of 400 interest only. One of the apartments needs minimal work to rent out. ALSO INCLUDES LOT ON 208 EAST MAIN ST.
Key facts
- 0.3 acre lot
- Built 1880
- Listed 56 days
Neighborhood map
What this means for you Summary
Snapshot
- This is a 6-bed/2.5-bath multifamily listed at $54k.
Deal economics
- At list price, monthly cash flow is $2k ($20k/yr) — positive.
- The deal already cash-flows at list — no discount required.
- Meets the 1% rule at list price ($3k rent vs $54k).
- Recommended offer: $52k (3.0% below list) — sets the bar for market timing.
- Cap rate 42.8% vs local median 6.2% in Watertown — top-decile yield for the area; either an underpriced asset or a hidden risk that comps aren't pricing in. Stress-test before assuming the spread holds.
Location & tenants
- Location reads 68/100 on livability (#540 in NY) — a middle-class / working-renter tenant base. Strengths: health & safety A+, cost of living A-, housing A-; Watch: amenities C-, schools D, crime F.
- Watertown City School District (urban): math 34% / reading 54% proficiency, ranked #481 of 590 in NY (top 82%) — families likely to look elsewhere, expect single-tenant / working-renter base with shorter leases.
- Market conditions: Rents rising fast (+10.0%/yr); 223 active listings in the ZIP; 196 units permitted in Jefferson County in 2024 (0 in 5+ unit buildings).
- At $2,610/mo this rent would consume 53% of the median local household income ($59k/yr) (locally 1634% of renters already pay >50% of income on rent) — very limited rent-growth headroom before tenants either downsize or default.
Forward outlook
- Local home prices are declining (-3.0%/yr); year-one equity from $373 of loan paydown is wiped out by about $2k of value loss. Plan a longer hold.
- Jefferson County population projected at -12% by 2050 — secular population decline; favor cash flow + early exit over multi-decade hold.
- At projected returns (-3.0% appreciation + 8.0% rent growth), your $15k cash investment doubles in ~1 year — after that, you're playing with house money.
Negotiation context
- It's been on market 56 days — a 3% lower offer ($52k) is reasonable based on typical stale-listing flexibility.
- 4 sale attempts since 12y ago; this cycle's ask is 20% above the opening price — seller raised mid-cycle; expect resistance to lowballs.
- Current owner paid $44k; 23% above their basis — modest negotiation headroom, anchor on the comps not their cost.
Risks & watch-outs
- Watch-outs: property tax is 2.6% of price; built in 1880 — expect roof / HVAC / electrical / plumbing capex.
Questions for the listing agent
- It's been on market 56 days. Have you received any prior offers? Is the seller open to a 3% concession, seller financing, or rate buy-down credit?
- Built in 1880 — when were the roof, HVAC, electrical panel, plumbing, and water heater last replaced?
- Property tax is high relative to price — has the assessment been appealed recently, and will the sale trigger a re-assessment?
- Is there a deadline driving the sale (1031 exchange, divorce, estate, relocation)? That informs how much negotiation room exists.
- Schools are D-rated, which usually means shorter tenancies and higher turnover. Who's the typical renter profile here, and what's been the actual vacancy rate?
- Crime grade is F in this area — have there been break-ins, vandalism, or insurance claims at this property in the last 3 years? What carrier currently insures it and at what premium?
- The area grade is low — what's the realistic commute time and amenity access for the typical tenant pool here? Any planned neighborhood developments (good or bad) we should know about?
- What's the average days-on-market for RENTAL listings here right now (not sales)? A rising rental-DOM trend means longer vacancies and softer asking-rent achievability than the comps imply.
- What's the recent tenant-quality profile in this submarket — average credit score on applications, eviction rate, late-payment / NSF rate, and stable-employment percentage? A property-management company in the area should have these aggregated.
- How much new apartment / multifamily construction is in the pipeline within 1–3 miles? Heavy new supply (>2% of stock underway) typically softens rents 12–24 months out; light construction supports rent growth.
Investment metrics
- 1% rule
- 4.83% ✓
- Cap rate
- 42.75%
- Cash-on-cash
- 130.22%
- DSCR
- 6.79
- GRM
- 1.7
CMA / ARV
- ARV (median comp)
- $301,843
- List price
- $54,000
- Delta
- -82.11%
- Verdict
- UNDERPRICED
- Comps
- 20 within 1.0 mi
Show comp detail 5 sales within ~0.75 mi
| Address | Dist | Beds/Ba | Sqft | Sold | Price | $/sf | Match |
|---|---|---|---|---|---|---|---|
| 146-148 E Main St | 0.11mi | 6/2.0 | 2,048 (-6%) | 20mo | $160,500 | $78 | 66 |
| 159 Mechanic St | 0.37mi | 6/2.0 | 2,263 (+4%) | 15mo | $72,000 | $32 | 62 |
| 377 W Main St | 0.50mi | 6/2.0 | 1,991 (-9%) | 23mo | $176,000 | $88 | 41 |
| 810 Boyd St | 0.69mi | 5/2.0 (-1) | 1,934 (-11%) | 1mo | $179,900 | $93 | 41 |
| 114 High St | 0.47mi | 5/3.0 (-1) | 2,500 (+14%) | 18mo | $178,500 | $71 | 32 |
Match score weights: distance 35% · size 25% · config 20% · recency 20%. Top-matched comps best support the ARV.
Projected returns pro-forma
-3.0% appreciation · 8.0% rent growth · sell at horizon
- IRR
- —
- Equity multiple
- 8.25×
- Total profit
- $109,611
- Equity at exit
- $8,052
- IRR
- —
- Equity multiple
- 20.38×
- Total profit
- $293,065
- Equity at exit
- $4,669
Cash invested: $15,120 (down + closing). Projections, not guarantees.
Landlord ↔ Tenant lean methodology
- Overall (STATE)
- 15 Strongly Tenant-Friendly
- State New York
- 15 Strongly Tenant-Friendly · D+10
- County
- — inherits STATE
- City
- — inherits STATE
ZIP-level market 13601
- Home prices YoY
- -5.6%
- Rents YoY
- 10.0%
- Active inventory
- 223
- Price-to-rent
- 3.4×
Monthly cashflow live
- Estimated rent
- $2,610 high interval (Pro) →
- Mortgage (P&I)
- −$283
- Tax from tax record
- −$115 /mo · $1,386/yr
- Insurance
- −$22
- HOA
- −$0
- Vacancy / Maint / Mgmt
- −$548
- Net cashflow
- $1,641
Break-even live
2-unit breakdown (identical units grouped — click to expand)
| Units | Beds | Baths | Est. rent |
|---|---|---|---|
| 2× units | 2 | 1 | $2,610 |
| #1 | 2 | 1 | $1,305 |
| #2 | 2 | 1 | $1,305 |
| Total (2 units) | $2,610 | ||
UW: 25.0% down · 7.5% · 30yr · 1.5% tax · 5.0% vac · 8.0% maint · 8.0% mgmt
Financing live
Cash to close
- Down payment
- $13,500
- Closing costs
- $1,620
- Reserves months
- —
- Total cash needed
- —
Loan-product check · same deal, 3 products live
Conventional
25% down · 7.5% · 30yr
- Down + closing
- —
- Monthly P&I
- —
- Monthly cashflow
- —
- DSCR
- —
- Eligible?
- —
Personal DTI + credit; lowest rate.
DSCR
20% down · 8.5% · 30yr
- Down + closing
- —
- Monthly P&I
- —
- Monthly cashflow
- —
- DSCR
- —
- Eligible?
- —
No personal income docs; deal must DSCR.
Hard money
10% down · 12.0% · 12mo
- Down + closing
- —
- Monthly P&I
- —
- Monthly cashflow
- —
- DSCR
- —
- Eligible?
- —
Short-term bridge; refi at stabilization.
Listing history 34 events
-
2026-06-19days on market $54,000 Active 56 DOM
-
2026-06-18days on market $54,000 Active 55 DOM
-
2026-06-17days on market $54,000 Active 54 DOM
-
2026-06-16days on market $54,000 Active 53 DOM
-
2026-06-15days on market $54,000 Active 52 DOM
-
2026-06-14days on market $54,000 Active 50 DOM
-
2026-06-12days on market $54,000 Active 49 DOM
-
2026-06-09days on market $54,000 Active 46 DOM
-
2026-06-08days on market $54,000 Active 45 DOM
-
2026-06-07pricedays on market $54,000 Active 44 DOM
-
2026-06-05days on market $49,900 Active 41 DOM
-
2026-06-03days on market $49,900 Active 40 DOM
-
2026-06-02days on market $49,900 Active 39 DOM
-
2026-06-01days on market $49,900 Active 38 DOM
-
2026-05-31days on market $49,900 Active 37 DOM
-
2026-05-30days on market $49,900 Active 36 DOM
-
2026-05-04status Active 320-char remark
Show marketing remark (320 chars)
Seller financing available for this fixer upper in need of TLC (vandals cut some pipes and electric in one apartment). Seller can finance 40k with 5000 down or lease option with 3000 down, monthly payments of 400 interest only. One of the apartments needs minimal work to rent out. ALSO INCLUDES LOT ON 208 EAST MAIN ST.
-
2026-05-04price $49,900 320-char remark
Show marketing remark (320 chars)
Seller financing available for this fixer upper in need of TLC (vandals cut some pipes and electric in one apartment). Seller can finance 40k with 5000 down or lease option with 3000 down, monthly payments of 400 interest only. One of the apartments needs minimal work to rent out. ALSO INCLUDES LOT ON 208 EAST MAIN ST.
-
2026-04-27status Pending 320-char remark
Show marketing remark (320 chars)
Seller financing available for this fixer upper in need of TLC (vandals cut some pipes and electric in one apartment). Seller can finance 40k with 5000 down or lease option with 3000 down, monthly payments of 400 interest only. One of the apartments needs minimal work to rent out. ALSO INCLUDES LOT ON 208 EAST MAIN ST.
-
2026-04-17$45,000 Active 320-char remark
Show marketing remark (320 chars)
Seller financing available for this fixer upper in need of TLC (vandals cut some pipes and electric in one apartment). Seller can finance 40k with 5000 down or lease option with 3000 down, monthly payments of 400 interest only. One of the apartments needs minimal work to rent out. ALSO INCLUDES LOT ON 208 EAST MAIN ST.
-
2025-02-14historical
-
2024-09-16soldstatus $44,000
-
2024-07-01price $43,000
-
2024-05-17price $44,000
-
2024-04-06price $46,000
-
2024-03-06price $48,000
-
2023-12-08price $49,900
-
2023-11-08price $53,000
-
2023-10-16price $56,000
-
2023-10-02price $58,000
-
2023-09-14price $59,900
-
2023-09-14$69,900 Active
-
2016-09-30historical
-
2014-09-10$99,900
ⓘ Source: listings_history table (triggers on properties + properties_extension) + one-shot
backfill from property_details.listing_events for pre-trigger history.
Tax reassessment forecast NY · Partial reset (capped growth)
- Current annual tax
- $1,386 · $115/mo
- Projected year-2 tax
- $1,386 · $115/mo
- Expected delta
- $0/yr ($0/mo · 0.0%)
ⓘ Screening estimate from a state-policy table — verify with the county assessor before closing.
Climate risk First Street
- Flood 1/10 Low FEMA zone X · 0% chance over 30 yrs
- Wildfire 1/10 Low
- Heat 2/10 Low 7 d/yr ≥91°F today · 15 d/yr by 30 yrs out
- Wind 1/10 Low 0% chance of damaging wind over 30 yrs
- Air quality 2/10 Low 1 unhealthy d/yr today · 1 by 30 yrs out
Nearby sold comps map
Loading sold comps map…
Walkable amenities ~0.75 mi
Loading nearby amenities…
Taxation est. · year 1
- Rental income
- $31,320
- − Mortgage interest
- −$3,025
- − Property taxes
- −$1,386
- − Insurance
- −$270
- − Repairs & maintenance
- −$2,506
- − Management
- −$2,506
- − Depreciation
- −$1,571
- Taxable income
- $20,057
- Est. tax owed @ 24.0%
- −$4,814
- After-tax cash flow
- $14,875/yr
For passive investors: Depreciation is non-cash, so a rental often shows a tax loss while cash-flowing — sheltering income. Rental losses are passive: they offset passive income freely, and up to $25,000/yr can offset ordinary (W-2) income if you actively participate and your MAGI is under $100k (phasing out to $0 by $150k); unused losses carry forward. On sale, claimed depreciation is recaptured at up to 25%, and gains may owe capital-gains tax (a 1031 exchange can defer both). Figures are a year-1 estimate at your 24.0% rate — not tax advice; consult a CPA.
Schools (NCES district)
- District
- Watertown City School District
- NCES district ID
- 3630120
- Math proficiency
- 34% ▼ -10.00%
- Reading proficiency
- 54% ▲ 12.00%
- Median HH income
- $40,919
- Composite
- 36.86/100
- National rank
- #4551
- State rank
- #481 of 590 in NY
Livability — Watertown
- Score
- 68/100
- State rank
- #540
- US rank
- #9700
Category grades
Schools grade is shown separately in the Schools card above.
Census & demographics
- Census place
- Watertown, NY
- County
- Jefferson County · 47,417 people
- City population
- 36,839
- Metro
- Watertown-Fort Drum, NY
- Population (ZIP)
- 36,839
- Household income
- $58,791
- Rent vs Own
- Severe rent burden
- 1634.0
Population outlook (Jefferson County) Hauer SSP2
- Today (2025)
- 111,748 people
- By 2030
- 109,370 · -2.1%
- By 2040
- 103,828 · -7.1%
- By 2050
- 98,523 · -11.8%
- By 2075
- 91,422 · -18.2%
- By 2100
- 78,214 · -30.0%
Race, ethnicity, and origin ACS 2023
- Neighborhood character
- Predominantly White (82%)
- Race & ethnicity
- White 82% Two or more races 7% Hispanic / Latino 6% Black 4% Asian 2%
- Hispanic origin (detail)
- Mexican 2% Puerto Rican 2%
- Common ancestry
- Lithuanian 7% Romanian 3% Slovak 2%
- Foreign-born
- 4% · Canada
- Languages at home
- 94% English-only · Spanish 3% Other Indo-European 1% German/W. Germanic 1%
Political lean MEDSL · Jefferson
- 2024 margin
- Strong R (+23.6) · D 38.2% · R 61.8%
- 2008→2024 swing
- -18.3pp toward R · 2008: -5.3pp · 2024: -23.6pp
- All cycles
- 2024: R+23.6 2020: R+19.0 2016: R+22.4 2012: R+2.9 2008: R+5.3
Not yet ingested
- Civics
- —
Market trends
- HPI YoY
- ▼ -18.86%
- Current HPI
- 316.636
- Rent YoY
- ▲ 9.96%
- Metro
- Watertown-Fort Drum, NY
- State GDP YoY
- ▲ 2.60%
- F500 in state
- 92
Industry mix (Fortune 500 HQ in NY)
| Industry | F500 HQs | Revenue |
|---|---|---|
| Financial Services | 10 | $950B |
|
||
| Consumer Goods | 9 | $162B |
|
||
| Insurance | 4 | $225B |
|
||
| Telecommunications | 2 | $144B |
|
||
| Pharmaceuticals | 2 | $112B |
|
||
| Media / Entertainment | 2 | $69B |
|
||
Price history
-50.1% since first listed18 events — show timeline
- 2026-05-04 Relisted — CNYIS
- 2026-05-04 Price Changed $49,900 CNYIS
- 2026-04-27 Pending — CNYIS
- 2026-04-17 Listed $45,000 CNYIS
- 2025-02-14 Listing Removed — CNYIS
- 2024-09-16 Sold (Public Records) $44,000 Public Records
- 2024-07-01 Price Changed $43,000 CNYIS
- 2024-05-17 Price Changed $44,000 CNYIS
- 2024-04-06 Price Changed $46,000 CNYIS
- 2024-03-06 Price Changed $48,000 CNYIS
- 2023-12-08 Price Changed $49,900 CNYIS
- 2023-11-08 Price Changed $53,000 CNYIS
- 2023-10-16 Price Changed $56,000 CNYIS
- 2023-10-02 Price Changed $58,000 CNYIS
- 2023-09-14 Price Changed $59,900 CNYIS
- 2023-09-14 Listed $69,900 CNYIS
- 2016-09-30 Listing Removed — CNYIS
- 2014-09-10 Listed $99,900 CNYIS
Property tax history
+18.2%/yrLatest (2025): $1,386 · +2.0% YoY. Source: county tax records.
Cash-flow waterfall
monthlySold comps — $/sqft
last 12 mo · ≤1 miLoading sold comps…