10024 Fm 563 Rd · Liberty, TX
Flood risk 1/10 · Minimal
- FEMA flood zone
- X (unshaded)
- Chance of flooding over 30 yrs
- 0.0%
- Est. flood insurance / yr
- $507 – $1,088
Fire risk 5/10 · Moderate
- Est. fire insurance / yr
- $1,222 – $2,270
Heat risk 9/10 · Severe
- Hot days now (above 111°F)
- 7 days/yr
- Hot days in 30 yrs
- 26 days/yr
Wind risk 9/10 · Severe
- Chance of severe wind over 30 yrs
- 99.0%
Air-quality risk 2/10 · Minimal
- Unhealthy air days now
- 1 days/yr
- Unhealthy air days in 30 yrs
- 1 days/yr
Risk factors via First Street. Map © Google.
Why this score? — see what drove the C grade
The composite is a weighted blend of 9 inputs, each scored 0–100. Each bar is that input's sub-score; the figure is the points it added to the 100-point composite (weight × sub-score).
- Cash flow +18.3/30.0
- ARV discount +15.0/15.0
- DSCR +5.7/10.0
- 1% rule +5.3/10.0
- Livability +3.4/5.0
- Schools +3.2/10.0
- Rent growth +2.5/5.0
- Condition / age +2.5/5.0
- Appreciation +0.0/10.0
$160,000
🖨 Deal sheet (PDF) 📄 Offer letter ✓ Due diligence
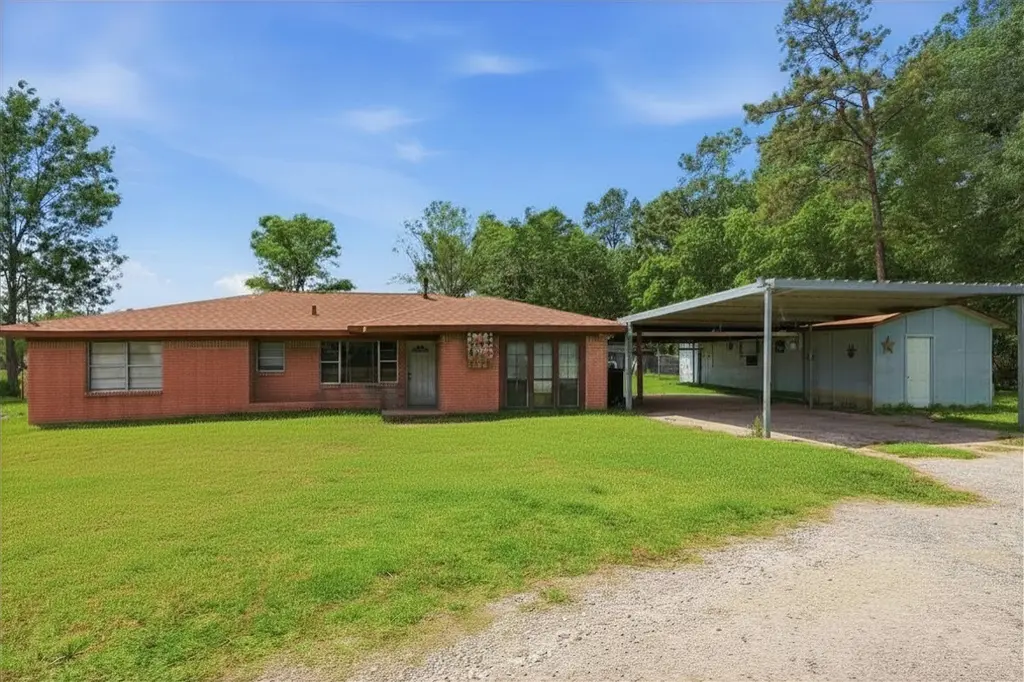
Listing remarks
Brick ranch home on a full acre in Liberty County along FM 563 with easy access to US-90 and just minutes from the City of Liberty. This 3 bedroom 1 and half bath home features hardwood floors, a spacious kitchen with an island, and French doors leading to the backyard. ROOF is only 1 YEAR OLD & NOT IN FLOOD ZONE! A detached 2-car carport plus a storage building gives you covered parking and extra workspace. Enjoy a full acre of open land with mature trees, a fenced perimeter, and a gravel driveway, plenty of room to spread out. Liberty County is one of the fastest-growing rural markets in the Greater Houston area, offering affordable land, no city taxes, and easy access to Houston vi
Key facts
- Detached carport
- Spacious kitchen
- Storage building
Tags
Property features AI
Finance
- Other: Seller disclosure available
Exterior
- Parking: Detached carport; 2-car carport
- Utilities: Well water; Septic tank sewer
- Home design: Residential property; Built in 1972; Slab foundation
- Construction: Brick construction; Composition roof
- Exterior features: Wooded lot; Other lot features
Interior
- Kitchen: Dishwasher; Microwave
- Bedrooms: Primary bedroom (First floor); Bedroom (First floor); Bedroom (First floor); Bedrooms possible: 3
- Bathrooms: 1 full bathroom; 1 half bathroom
- Heating & cooling: Central heating (Gas); Window units for cooling
- Interior features: Double vanity; Kitchen island; Kitchen/family room combo; Primary bathroom with bath
- Laundry & utility: Utility room (First floor)
Neighborhood map
What this means for you Summary
Snapshot
- This is a 3-bed/2.0-bath single-family listed at $160k.
Deal economics
- At list price, monthly cash flow is $147 ($2k/yr) — positive.
- The deal already cash-flows at list — no discount required.
- Meets the 1% rule at list price ($2k rent vs $160k).
- Cap rate 7.4% vs local median 4.6% in Liberty — top-decile yield for the area; either an underpriced asset or a hidden risk that comps aren't pricing in. Stress-test before assuming the spread holds.
Location & tenants
- Location reads 68/100 on livability (#489 in TX) — a middle-class / working-renter tenant base. Strengths: cost of living A+, housing A+, health & safety A; Watch: employment D+, schools F, amenities F.
- Liberty ISD (town): math 34% / reading 41% proficiency, ranked #464 of 826 in TX (top 56%) — families likely to look elsewhere, expect single-tenant / working-renter base with shorter leases.
- Market conditions: 224 active listings in the ZIP; 1,321 units permitted in Liberty County in 2024 (0 in 5+ unit buildings).
Forward outlook
- Local home prices are declining (-3.0%/yr); year-one equity from $1k of loan paydown is wiped out by about $5k of value loss. Plan a longer hold.
- Liberty County population projected at +24% by 2050 — long-run rental-demand tailwind backs the buy-and-hold thesis.
Negotiation context
- Only 7 days on market — expect competitive offers; lowballing is unlikely to land.
- 6 sale attempts since 12y ago with the ask held roughly flat each time — persistent listings suggest the price (not the market) is what's stuck; bring a comps-based counter.
Risks & watch-outs
- Climate carrying-cost: severe wind risk, 99% chance of damaging wind over 30y; moderate wildfire risk; extreme-heat days projected 7→26/yr by 2055 (HVAC capex compounding) — expect insurance premiums to compound above CPI over the hold.
Questions for the listing agent
- Built in 1972 — when were the roof, HVAC, electrical panel, plumbing, and water heater last replaced?
- Is there a deadline driving the sale (1031 exchange, divorce, estate, relocation)? That informs how much negotiation room exists.
- Schools are F-rated, which usually means shorter tenancies and higher turnover. Who's the typical renter profile here, and what's been the actual vacancy rate?
- What's the average days-on-market for RENTAL listings here right now (not sales)? A rising rental-DOM trend means longer vacancies and softer asking-rent achievability than the comps imply.
- What's the recent tenant-quality profile in this submarket — average credit score on applications, eviction rate, late-payment / NSF rate, and stable-employment percentage? A property-management company in the area should have these aggregated.
- How much new for-sale + rental construction is in the pipeline within 1–3 miles? Heavy new supply typically softens prices + rents 12–24 months out; constrained supply supports both.
Investment metrics
- 1% rule
- 1.03% ✓
- Cap rate
- 7.39%
- Cash-on-cash
- 3.93%
- DSCR
- 1.17
- GRM
- 8.1
CMA / ARV
- ARV (median comp)
- $193,018
- List price
- $160,000
- Delta
- 3.57%
- Verdict
- FAIR
- Comps
- 2 within 2.0 mi
Projected returns pro-forma
-3.0% appreciation · 3.0% rent growth · sell at horizon
- IRR
- -10.1%
- Equity multiple
- 0.63×
- Total profit
- $-16,527
- Equity at exit
- $23,857
- IRR
- -0.7%
- Equity multiple
- 0.95×
- Total profit
- $-2,132
- Equity at exit
- $13,834
Cash invested: $44,800 (down + closing). Projections, not guarantees.
Landlord ↔ Tenant lean methodology
- Overall (STATE)
- 87 Strongly Landlord-Friendly
- State Texas
- 87 Strongly Landlord-Friendly · R+5
- County
- — inherits STATE
- City
- — inherits STATE
ZIP-level market 77575
- Home prices YoY
- -26.6%
- Active inventory
- 224
- Price-to-rent
- 8.1×
Monthly cashflow live
- Estimated rent
- $1,650 medium interval (Pro) →
- Mortgage (P&I)
- −$839
- Tax from tax record
- −$251 /mo · $3,013/yr
- Insurance
- −$67
- HOA
- −$0
- Vacancy / Maint / Mgmt
- −$346
- Net cashflow
- $147
Break-even live
Sensitivity live
| Price | -10% $237 | -5% $192 | +0% $147 | +5% $101 | +10% $56 |
|---|---|---|---|---|---|
| Rent | -10% $16 | -5% $82 | +0% $147 | +5% $212 | +10% $277 |
| Rate | -1.0pp $227 | -0.5pp $187 | base $147 | +0.5pp $105 | +1.0pp $63 |
UW: 25.0% down · 7.5% · 30yr · 1.5% tax · 5.0% vac · 8.0% maint · 8.0% mgmt
Financing live
Cash to close
- Down payment
- $40,000
- Closing costs
- $4,800
- Reserves months
- —
- Total cash needed
- —
Loan-product check · same deal, 3 products live
Conventional
25% down · 7.5% · 30yr
- Down + closing
- —
- Monthly P&I
- —
- Monthly cashflow
- —
- DSCR
- —
- Eligible?
- —
Personal DTI + credit; lowest rate.
DSCR
20% down · 8.5% · 30yr
- Down + closing
- —
- Monthly P&I
- —
- Monthly cashflow
- —
- DSCR
- —
- Eligible?
- —
No personal income docs; deal must DSCR.
Hard money
10% down · 12.0% · 12mo
- Down + closing
- —
- Monthly P&I
- —
- Monthly cashflow
- —
- DSCR
- —
- Eligible?
- —
Short-term bridge; refi at stabilization.
Listing history 22 events
-
2026-06-09days on market $160,000 Active 7 DOM
-
2026-06-08days on market $160,000 Active 6 DOM
-
2026-06-07days on market $160,000 Active 5 DOM
-
2026-06-04days on market $160,000 Active 2 DOM
-
2026-06-03pricedays on market $160,000 Active 1 DOM
-
2026-06-02days on market $175,000 Active 8 DOM
-
2026-06-01days on market $175,000 Active 7 DOM
-
2026-05-31days on market $175,000 Active 6 DOM
-
2026-05-15$185,000 Active 800-char remark
-
2026-05-15historical
-
2026-04-29price $199,900
-
2026-04-29price $199,000
-
2026-04-29$199,000 Active
-
2026-04-28historical
-
2026-04-20$220,000 Active
-
2014-10-06soldstatus
-
2014-10-03soldstatus Sold
-
2014-09-01status Pending
-
2014-08-23status Option Pending
-
2014-08-12$92,500 Active
-
2009-02-27soldstatus
-
1994-07-18soldstatus
ⓘ Source: listings_history table (triggers on properties + properties_extension) + one-shot
backfill from property_details.listing_events for pre-trigger history.
Tax reassessment forecast TX · Resets to sale price
- Current annual tax
- $3,013 · $251/mo
- Projected year-2 tax
- $3,013 · $251/mo
- Expected delta
- $0/yr ($0/mo · 0.0%)
ⓘ Screening estimate from a state-policy table — verify with the county assessor before closing.
Climate risk First Street
- Flood 1/10 Low FEMA zone X (unshaded) · 0% chance over 30 yrs
- Wildfire 5/10 Major
- Heat 9/10 Extreme 7 d/yr ≥111°F today · 26 d/yr by 30 yrs out
- Wind 9/10 Extreme 99% chance of damaging wind over 30 yrs
- Air quality 2/10 Low 1 unhealthy d/yr today · 1 by 30 yrs out
Nearby sold comps map
Loading sold comps map…
Walkable amenities ~0.75 mi
Loading nearby amenities…
Taxation est. · year 1
- Rental income
- $19,800
- − Mortgage interest
- −$8,962
- − Property taxes
- −$3,013
- − Insurance
- −$800
- − Repairs & maintenance
- −$1,584
- − Management
- −$1,584
- − Depreciation
- −$4,655
- Taxable loss
- −$798
- Est. tax savings @ 24.0%
- +$192
- After-tax cash flow
- $1,952/yr
For passive investors: Depreciation is non-cash, so a rental often shows a tax loss while cash-flowing — sheltering income. Rental losses are passive: they offset passive income freely, and up to $25,000/yr can offset ordinary (W-2) income if you actively participate and your MAGI is under $100k (phasing out to $0 by $150k); unused losses carry forward. On sale, claimed depreciation is recaptured at up to 25%, and gains may owe capital-gains tax (a 1031 exchange can defer both). Figures are a year-1 estimate at your 24.0% rate — not tax advice; consult a CPA.
Schools (NCES district)
- District
- Liberty ISD
- NCES district ID
- 4827450
- Math proficiency
- 34% ▼ -7.00%
- Reading proficiency
- 41% ▼ -1.00%
- Median HH income
- $46,931
- Composite
- 32.11/100
- National rank
- #5803
- State rank
- #464 of 826 in TX
Livability — Liberty
- Score
- 68/100
- State rank
- #489
- US rank
- #9688
Category grades
Schools grade is shown separately in the Schools card above.
Census & demographics
- City population
- 16,617
- Population (ZIP)
- 16,617
Population outlook (Liberty County) Hauer SSP2
- Today (2025)
- 87,956 people
- By 2030
- 92,161 · +4.8%
- By 2040
- 100,784 · +14.6%
- By 2050
- 109,471 · +24.5%
- By 2075
- 133,470 · +51.7%
- By 2100
- 147,372 · +67.6%
Race, ethnicity, and origin ACS 2023
- Neighborhood character
- Diverse neighborhood (Simpson 0.61)
- Race & ethnicity
- White 56% Hispanic / Latino 25% Black 12% Two or more races 11%
- Hispanic origin (detail)
- Mexican 24%
- Common ancestry
- Lithuanian 4% Serbian 2% Slovak 2%
- Foreign-born
- 12% · Canada
- Languages at home
- 80% English-only · Spanish 19% Other Asian/Pacific 1%
Political lean MEDSL · Liberty
- 2024 margin
- Solid R (+61.6) · D 19.0% · R 80.6%
- 2008→2024 swing
- -17.9pp toward R · 2008: -43.7pp · 2024: -61.6pp
- All cycles
- 2024: R+61.6 2020: R+59.7 2016: R+58.0 2012: R+53.3 2008: R+43.7
Not yet ingested
- Civics
- —
Market trends
- HPI YoY
- ▼ -74.17%
- Current HPI
- 204.9372
- Rent YoY
- —
- Metro
- —
- State GDP YoY
- ▲ 3.95%
- F500 in state
- 110
Industry mix (Fortune 500 HQ in TX)
| Industry | F500 HQs | Revenue |
|---|---|---|
| Energy | 16 | $1,198B |
|
||
| Technology | 5 | $198B |
|
||
| Engineering / Construction | 4 | $72B |
|
||
| Energy Services | 3 | $60B |
|
||
| Utilities | 3 | $41B |
|
||
| Healthcare | 2 | $330B |
|
||
Price history
+73.0% since first listed19 events — show timeline
- 2026-06-10 Listing Removed — HARMLS
- 2026-06-02 Listing Removed — HARMLS
- 2026-06-02 Listed $160,000 HARMLS
- 2026-05-25 Listing Removed — HARMLS
- 2026-05-25 Listed $175,000 HARMLS
- 2026-05-15 Listing Removed — HARMLS
- 2026-05-15 Listed $185,000 HARMLS
- 2026-04-29 Price Changed $199,900 HARMLS
- 2026-04-29 Price Changed $199,000 HARMLS
- 2026-04-29 Listed $199,000 HARMLS
- 2026-04-28 Listing Removed — HARMLS
- 2026-04-20 Listed $220,000 HARMLS
- 2014-10-06 Sold (Public Records) — Public Records
- 2014-10-03 Sold (MLS) — HARMLS
- 2014-09-01 Pending — HARMLS
- 2014-08-23 Pending — HARMLS
- 2014-08-12 Listed $92,500 HARMLS
- 2009-02-27 Sold (Public Records) — Public Records
- 1994-07-18 Sold (Public Records) — Public Records
Property tax history
+5.2%/yrLatest (2025): $3,013 · +8.6% YoY. Source: county tax records.
Cash-flow waterfall
monthlySold comps — $/sqft
last 12 mo · ≤1 miLoading sold comps…