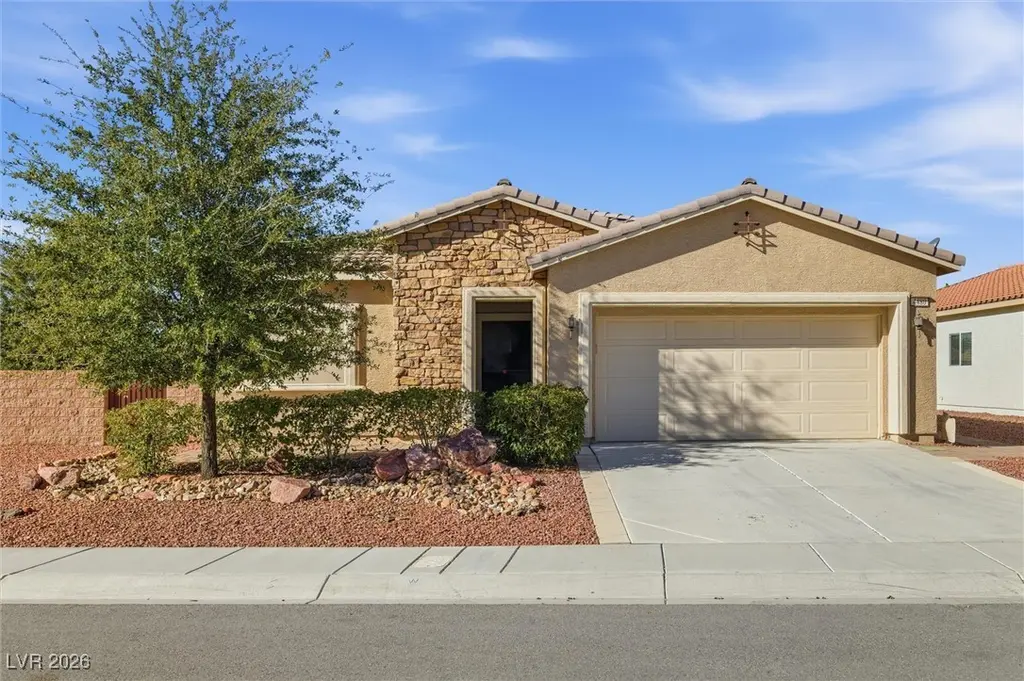
4480 La Grancia Ct · Pahrump, NV
Flood risk 1/10 · Minimal
- FEMA flood zone
- X (unshaded)
- Chance of flooding over 30 yrs
- 0.0%
- Est. flood insurance / yr
- $507 – $1,088
Fire risk 3/10 · Minor
- Est. fire insurance / yr
- $490 – $910
Heat risk 7/10 · Major
- Hot days now (above 102°F)
- 4 days/yr
- Hot days in 30 yrs
- 11 days/yr
Wind risk 1/10 · Minimal
- Chance of severe wind over 30 yrs
- —
Air-quality risk 2/10 · Minimal
- Unhealthy air days now
- 0 days/yr
- Unhealthy air days in 30 yrs
- 1 days/yr
Risk factors via First Street. Map © Google.
Why this score? — see what drove the D grade
The composite is a weighted blend of 9 inputs, each scored 0–100. Each bar is that input's sub-score; the figure is the points it added to the 100-point composite (weight × sub-score).
- ARV discount +11.1/15.0
- Cash flow +7.9/30.0
- Appreciation +6.4/10.0
- Livability +3.4/5.0
- Rent growth +2.5/5.0
- Condition / age +2.5/5.0
- Schools +2.2/10.0
- 1% rule +2.0/10.0
- DSCR +2.0/10.0
$299,999
🖨 Deal sheet (PDF) 📄 Offer letter ✓ Due diligence
Listing remarks MLS
Step into this charming single-story home nestled in a beautifully maintained golf course community. Thoughtful desert landscaping enhances both the front and back yards, offering low-maintenance beauty and a true Southwest feel. Inside, the open floor plan creates a bright, seamless living space. The open kitchen is a standout, featuring custom cabinets, a stylish backsplash, a breakfast counter, and a comfortable eat-in dining area perfect for casual meals or entertaining. The home offers 2 spacious bedrooms, a versatile den, and 2 full bathrooms. The primary suite includes a well-appointed bathroom with double sinks and a walk-in closet, providing both comfort and convenience. This home blends low-maintenance living with thoughtful design in a peaceful, amenity-rich neighborhood.
Key facts
- Open floor plan
- Custom cabinets
- Eat-in dining area
Tags
Neighborhood map
What this means for you Summary
Snapshot
- This is a 2-bed/2.0-bath single-family listed at $300k.
Deal economics
- At list price, monthly cash flow is $-313 ($-4k/yr) — negative.
- To cash-flow at today's rent, offer at most $245k (18.4% below list).
- To meet the 1% rule (rent ≥ 1% of price), the offer needs to be $209k (30.2% below list).
- Recommended offer: $209k (30.2% below list) — sets the bar for 1% rule.
- Cap rate 5.0% vs local median 3.4% in Pahrump — top-decile yield for the area; either an underpriced asset or a hidden risk that comps aren't pricing in. Stress-test before assuming the spread holds.
Location & tenants
- Location reads 68/100 on livability (#30 in NV) — a middle-class / working-renter tenant base. Strengths: cost of living A+, housing A+, health & safety A+; Watch: employment D, crime F, amenities F.
- Nye County School District (rural): math 20% / reading 33% proficiency, ranked #16 of 17 in NV (top 94%) — low school quality limits family demand, transient renter base, plan for 1-2y turnover.
- Zoned schools: Hafen Elementary School (math 23% / reading 36%, grade F, #195 of 402 statewide, top 53%, 440 students, 100% FRL); Rosemary Clarke Middle School (math 20% / reading 31%, grade F, #62 of 109 statewide, top 58%, 1,060 students, 100% FRL); Pahrump Valley High School (math 14% / reading 41%, grade F, #74 of 131 statewide, top 56%, 1,362 students, 100% FRL) — zoned schools average 100% FRL vs 54% district-wide (46 pts higher); higher-poverty schools than district average — tighter screening recommended.
- Market conditions: 281 active listings in the ZIP; 8 comparable units currently listed for rent nearby; rentals at typical pace (median 26d on market — plan ~3-4 weeks tenant-placement turnaround); solid renter incomes.
- This rent runs 32% of the median local income ($78k/yr) — at the standard rent-burdened threshold; future hikes will face affordability resistance.
Forward outlook
- In year one you build about $10k of equity ($2k loan paydown + $8k appreciation (2.8% local appreciation)).
- Nye County population projected at -28% by 2050 — secular population decline; favor cash flow + early exit over multi-decade hold.
- By year 4, paydown + projected appreciation supports a ~$35k cash-out refi (75% LTV) — recoverable capital for the next deal without selling this one.
Negotiation context
- It's been on market 157 days — a 12% lower offer ($264k) is reasonable based on typical stale-listing flexibility.
- 2 sale attempts since 11y ago; this cycle's ask has dropped $40k (12%) from the opening price — seller is motivated, your offer sets the floor, not the list.
- Current owner paid $182k; list at $300k implies a 65% gain — meaningful room to come down on a strong offer.
Risks & watch-outs
- Climate carrying-cost: extreme-heat days projected 4→11/yr by 2055 (HVAC capex compounding) — expect insurance premiums to compound above CPI over the hold.
Questions for the listing agent
- What do current leases actually rent for vs. the listed asking? Can we see a recent rent roll and the last 12 months of T-12 income?
- It's been on market 157 days. Have you received any prior offers? Is the seller open to a 30% concession, seller financing, or rate buy-down credit?
- What does the HOA fee cover, when was the last increase, and are there any pending special assessments or reserve-fund shortfalls?
- Why hasn't it sold? Are there any deal-killer items the seller is aware of (foundation, flood, title, zoning, code violations)?
- Is there a deadline driving the sale (1031 exchange, divorce, estate, relocation)? That informs how much negotiation room exists.
- Schools are F-rated, which usually means shorter tenancies and higher turnover. Who's the typical renter profile here, and what's been the actual vacancy rate?
- Crime grade is F in this area — have there been break-ins, vandalism, or insurance claims at this property in the last 3 years? What carrier currently insures it and at what premium?
- The area grade is low — what's the realistic commute time and amenity access for the typical tenant pool here? Any planned neighborhood developments (good or bad) we should know about?
- What's the average days-on-market for RENTAL listings here right now (not sales)? A rising rental-DOM trend means longer vacancies and softer asking-rent achievability than the comps imply.
- What's the recent tenant-quality profile in this submarket — average credit score on applications, eviction rate, late-payment / NSF rate, and stable-employment percentage? A property-management company in the area should have these aggregated.
- How much new for-sale + rental construction is in the pipeline within 1–3 miles? Heavy new supply typically softens prices + rents 12–24 months out; constrained supply supports both.
Investment metrics
- 1% rule
- 0.70% ✗
- Cap rate
- 5.04%
- Cash-on-cash
- -4.48%
- DSCR
- 0.80
- GRM
- 11.9
CMA / ARV
- ARV (median comp)
- $326,205
- List price
- $299,999
- Delta
- -8.03%
- Verdict
- FAIR
- Comps
- 20 within 1.0 mi
Show comp detail 12 sales within ~0.75 mi
| Address | Dist | Beds/Ba | Sqft | Sold | Price | $/sf | Match |
|---|---|---|---|---|---|---|---|
| 4454 Luciano Ave | 0.05mi | 3/1.5 (+1) | 1,533 (0%) | 1mo | $315,000 | $205 | 89 |
| 5200 Lilia Ave | 0.15mi | 3/2.0 (+1) | 1,533 (0%) | 2mo | $300,000 | $196 | 86 |
| 4760 Lorenzo Way | 0.31mi | 2/2.0 | 1,533 (0%) | 4mo | $320,000 | $209 | 83 |
| 5067 Semifonte Dr | 0.03mi | 2/2.0 | 1,396 (-9%) | 3mo | $300,000 | $215 | 81 |
| 5341 E La Campana Dr | 0.34mi | 3/2.0 (+1) | 1,533 (0%) | 2mo | $335,000 | $219 | 77 |
| 4732 S Adriano Way | 0.29mi | 2/2.0 | 1,451 (-5%) | 3mo | $290,000 | $200 | 75 |
| 4860 Prato Way | 0.54mi | 3/2.0 (+1) | 1,546 (+1%) | 2mo | $321,000 | $208 | 67 |
| 5396 Carrara Pointe St | 0.54mi | 3/2.0 (+1) | 1,546 (+1%) | 5mo | $305,000 | $197 | 64 |
| 4830 Lorenzo Way | 0.25mi | 3/2.0 (+1) | 1,757 (+15%) | 1mo | $299,900 | $171 | 58 |
| 5495 Finestra St | 0.59mi | 3/2.0 (+1) | 1,611 (+5%) | 3mo | $305,000 | $189 | 57 |
| 5490 E San Pietro Dr | 0.46mi | 3/2.0 (+1) | 1,756 (+14%) | 4mo | $422,900 | $241 | 46 |
| 5776 E Badlands Ln | 0.73mi | 3/2.0 (+1) | 1,681 (+10%) | 3mo | $290,000 | $173 | 43 |
Match score weights: distance 35% · size 25% · config 20% · recency 20%. Top-matched comps best support the ARV.
Projected returns pro-forma
2.78% appreciation · 3.0% rent growth · sell at horizon
- IRR
- 2.7%
- Equity multiple
- 1.15×
- Total profit
- $12,746
- Equity at exit
- $131,266
- IRR
- 6.2%
- Equity multiple
- 1.92×
- Total profit
- $77,608
- Equity at exit
- $199,521
Cash invested: $84,000 (down + closing). Projections, not guarantees.
Landlord ↔ Tenant lean methodology
- Overall (STATE)
- 71 Landlord-Friendly
- State Nevada
- 71 Landlord-Friendly · R+1
- County
- — inherits STATE
- City
- — inherits STATE
ZIP-level market 89061
- Home prices YoY
- 1.1%
- Active inventory
- 281
- Price-to-rent
- 11.9×
Monthly cashflow live
- Estimated rent
- $2,094 high interval (Pro) →
- Mortgage (P&I)
- −$1,573
- Tax from tax record
- −$154 /mo · $1,852/yr
- Insurance
- −$125
- HOA
- −$115
- Vacancy / Maint / Mgmt
- −$440
- Net cashflow
- $-313
Break-even live
Sensitivity live
| Price | -10% $-143 | -5% $-228 | +0% $-313 | +5% $-398 | +10% $-483 |
|---|---|---|---|---|---|
| Rent | -10% $-479 | -5% $-396 | +0% $-313 | +5% $-231 | +10% $-148 |
| Rate | -1.0pp $-162 | -0.5pp $-237 | base $-313 | +0.5pp $-391 | +1.0pp $-470 |
UW: 25.0% down · 7.5% · 30yr · 1.5% tax · 5.0% vac · 8.0% maint · 8.0% mgmt
Financing live
Cash to close
- Down payment
- $75,000
- Closing costs
- $9,000
- Reserves months
- —
- Total cash needed
- —
Loan-product check · same deal, 3 products live
Conventional
25% down · 7.5% · 30yr
- Down + closing
- —
- Monthly P&I
- —
- Monthly cashflow
- —
- DSCR
- —
- Eligible?
- —
Personal DTI + credit; lowest rate.
DSCR
20% down · 8.5% · 30yr
- Down + closing
- —
- Monthly P&I
- —
- Monthly cashflow
- —
- DSCR
- —
- Eligible?
- —
No personal income docs; deal must DSCR.
Hard money
10% down · 12.0% · 12mo
- Down + closing
- —
- Monthly P&I
- —
- Monthly cashflow
- —
- DSCR
- —
- Eligible?
- —
Short-term bridge; refi at stabilization.
Rent comps 8 comps
| Address | Beds | Baths | Sqft | Rent | $/sqft | DOM | Units | Dist |
|---|---|---|---|---|---|---|---|---|
| 5190 Lignum Ave Pahrump, NV | 2.0 | 2.0 | 1833 | $2,100 | $1.15 | 19d | 1 | 0.16mi |
| 5485 San Pietro Dr Pahrump, NV | 3.0 | 2.0 | 1533 | $2,200 | $1.44 | 25d | 1 | 0.48mi |
| 5406 Carrara Pointe St Pahrump, NV | 3.0 | 2.0 | 1772 | $2,000 | $1.13 | 9d | 1 | 0.55mi |
| 4921 Novelli Pl Pahrump, NV | 3.0 | 2.0 | 1451 | $2,050 | $1.41 | 45d | 1 | 0.70mi |
| 4881 Castello Way Pahrump, NV | 3.0 | 2.0 | 1772 | $2,035 | $1.15 | 22d | 1 | 0.70mi |
| 5776 E Badlands Ln Pahrump, NV | 3.0 | 2.0 | 1681 | $1,995 | $1.19 | 25d | 1 | 0.73mi |
| 5720 Al Fresco Ave Pahrump, NV | 3.0 | 2.0 | 2245 | $2,350 | $1.05 | 25d | 1 | 0.84mi |
| 5980 Drosetta Ave Pahrump, NV | 2.0 | 2.0 | 1511 | $2,195 | $1.45 | 25d | 1 | 0.95mi |
HOA detail
- Monthly dues
- $115 · $1,380/yr
- Likely covers
- landscaping
Listing history 21 events
-
2026-06-19days on market $299,999 Active 157 DOM
-
2026-06-18days on market $299,999 Active 156 DOM
-
2026-06-17days on market $299,999 Active 155 DOM
-
2026-06-17price $299,999 Active 154 DOM
-
2026-06-16days on market $329,900 Active 154 DOM
-
2026-06-15days on market $329,900 Active 153 DOM
-
2026-06-14days on market $329,900 Active 151 DOM
-
2026-06-12days on market $329,900 Active 150 DOM
-
2026-06-09days on market $329,900 Active 147 DOM
-
2026-06-08days on market $329,900 Active 146 DOM
-
2026-06-07days on market $329,900 Active 145 DOM
-
2026-06-03days on market $329,900 Active 141 DOM
-
2026-06-02days on market $329,900 Active 140 DOM
-
2026-06-01days on market $329,900 Active 139 DOM
-
2026-05-31days on market $329,900 Active 138 DOM
-
2026-05-30days on market $329,900 Active 137 DOM
-
2026-03-17price $329,900 793-char remark
Show marketing remark (793 chars)
Step into this charming single-story home nestled in a beautifully maintained golf course community. Thoughtful desert landscaping enhances both the front and back yards, offering low-maintenance beauty and a true Southwest feel. Inside, the open floor plan creates a bright, seamless living space. The open kitchen is a standout, featuring custom cabinets, a stylish backsplash, a breakfast counter, and a comfortable eat-in dining area perfect for casual meals or entertaining. The home offers 2 spacious bedrooms, a versatile den, and 2 full bathrooms. The primary suite includes a well-appointed bathroom with double sinks and a walk-in closet, providing both comfort and convenience. This home blends low-maintenance living with thoughtful design in a peaceful, amenity-rich neighborhood.
-
2026-01-13$339,899 Active 793-char remark
Show marketing remark (793 chars)
Step into this charming single-story home nestled in a beautifully maintained golf course community. Thoughtful desert landscaping enhances both the front and back yards, offering low-maintenance beauty and a true Southwest feel. Inside, the open floor plan creates a bright, seamless living space. The open kitchen is a standout, featuring custom cabinets, a stylish backsplash, a breakfast counter, and a comfortable eat-in dining area perfect for casual meals or entertaining. The home offers 2 spacious bedrooms, a versatile den, and 2 full bathrooms. The primary suite includes a well-appointed bathroom with double sinks and a walk-in closet, providing both comfort and convenience. This home blends low-maintenance living with thoughtful design in a peaceful, amenity-rich neighborhood.
-
2017-02-21soldstatus $182,000
-
2015-04-10historical
-
2015-01-30$179,000 Exclusive Right
ⓘ Source: listings_history table (triggers on properties + properties_extension) + one-shot
backfill from property_details.listing_events for pre-trigger history.
Tax reassessment forecast NV · Resets to sale price
- Current annual tax
- $1,852 · $154/mo
- Projected year-2 tax
- $1,852 · $154/mo
- Expected delta
- $0/yr ($0/mo · 0.0%)
ⓘ Screening estimate from a state-policy table — verify with the county assessor before closing.
Climate risk First Street
- Flood 1/10 Low FEMA zone X (unshaded) · 0% chance over 30 yrs
- Wildfire 3/10 Moderate
- Heat 7/10 Severe 4 d/yr ≥102°F today · 11 d/yr by 30 yrs out
- Wind 1/10 Low
- Air quality 2/10 Low 0 unhealthy d/yr today · 1 by 30 yrs out
Nearby sold comps map
Loading sold comps map…
Walkable amenities ~0.75 mi
Loading nearby amenities…
Taxation est. · year 1
- Rental income
- $25,129
- − Mortgage interest
- −$16,805
- − Property taxes
- −$1,852
- − Insurance
- −$1,500
- − Repairs & maintenance
- −$2,010
- − Management
- −$2,010
- − HOA
- −$1,380
- − Depreciation
- −$8,727
- Taxable loss
- −$9,156
- Est. tax savings @ 24.0%
- +$2,197
- After-tax cash flow
- $-1,562/yr
For passive investors: Depreciation is non-cash, so a rental often shows a tax loss while cash-flowing — sheltering income. Rental losses are passive: they offset passive income freely, and up to $25,000/yr can offset ordinary (W-2) income if you actively participate and your MAGI is under $100k (phasing out to $0 by $150k); unused losses carry forward. On sale, claimed depreciation is recaptured at up to 25%, and gains may owe capital-gains tax (a 1031 exchange can defer both). Figures are a year-1 estimate at your 24.0% rate — not tax advice; consult a CPA.
Schools (NCES district)
- District
- Nye County School District
- NCES district ID
- 3200360
- Math proficiency
- 20% ▼ -6.00%
- Reading proficiency
- 33% ▼ -5.00%
- Median HH income
- $41,447
- Composite
- 22.43/100
- National rank
- #8110
- State rank
- #16 of 17 in NV
Livability — Pahrump
- Score
- 68/100
- State rank
- #30
- US rank
- #9226
Category grades
Schools grade is shown separately in the Schools card above.
Census & demographics
- Census place
- Pahrump, NV
- County
- Nye County · 47,491 people
- City population
- 47,491
- Metro
- Pahrump, NV
- Population (ZIP)
- 8,141
- Household income
- $77,991
- Rent vs Own
- Severe rent burden
- 52.0
Population outlook (Nye County) Hauer SSP2
- Today (2025)
- 40,727 people
- By 2030
- 38,812 · -4.7%
- By 2040
- 33,952 · -16.6%
- By 2050
- 29,393 · -27.8%
- By 2075
- 21,122 · -48.1%
- By 2100
- 14,400 · -64.6%
Race, ethnicity, and origin ACS 2023
- Neighborhood character
- Predominantly White (67%)
- Race & ethnicity
- White 67% Hispanic / Latino 18% Two or more races 8% Asian 2% Black 2% Native American 2% Pacific Islander 1%
- Hispanic origin (detail)
- Mexican 15% Puerto Rican 1%
- Common ancestry
- Lithuanian 5% Romanian 2% Portuguese 2%
- Foreign-born
- 6% · Canada
- Languages at home
- 90% English-only · Spanish 7% Other Asian/Pacific 1% Other Indo-European 1%
Political lean MEDSL · Nye
- 2024 margin
- Solid R (+42.2) · D 28.0% · R 70.2% · Other 1.8%
- 2008→2024 swing
- -28.8pp toward R · 2008: -13.4pp · 2024: -42.2pp
- All cycles
- 2024: R+42.2 2020: R+40.4 2016: R+42.0 2012: R+24.2 2008: R+13.4
Not yet ingested
- Civics
- —
Market trends
- HPI YoY
- ▲ 2.78%
- Current HPI
- 266.2633
- Rent YoY
- —
- Metro
- Pahrump, NV
- State GDP YoY
- ▲ 3.08%
- F500 in state
- 6
Industry mix (Fortune 500 HQ in NV)
| Industry | F500 HQs | Revenue |
|---|---|---|
| Hotels / Casinos | 3 | $36B |
|
||
Price history
+84.3% since first listed5 events — show timeline
- 2026-03-17 Price Changed $329,900 GLVAR
- 2026-01-13 Listed $339,899 GLVAR
- 2017-02-21 Sold (Public Records) $182,000 Public Records
- 2015-04-10 Listing Removed — GLVAR
- 2015-01-30 Listed $179,000 GLVAR
Property tax history
+2.9%/yrLatest (2025): $1,852 · +3.2% YoY. Source: county tax records.
Cash-flow waterfall
monthlySold comps — $/sqft
last 12 mo · ≤1 miLoading sold comps…