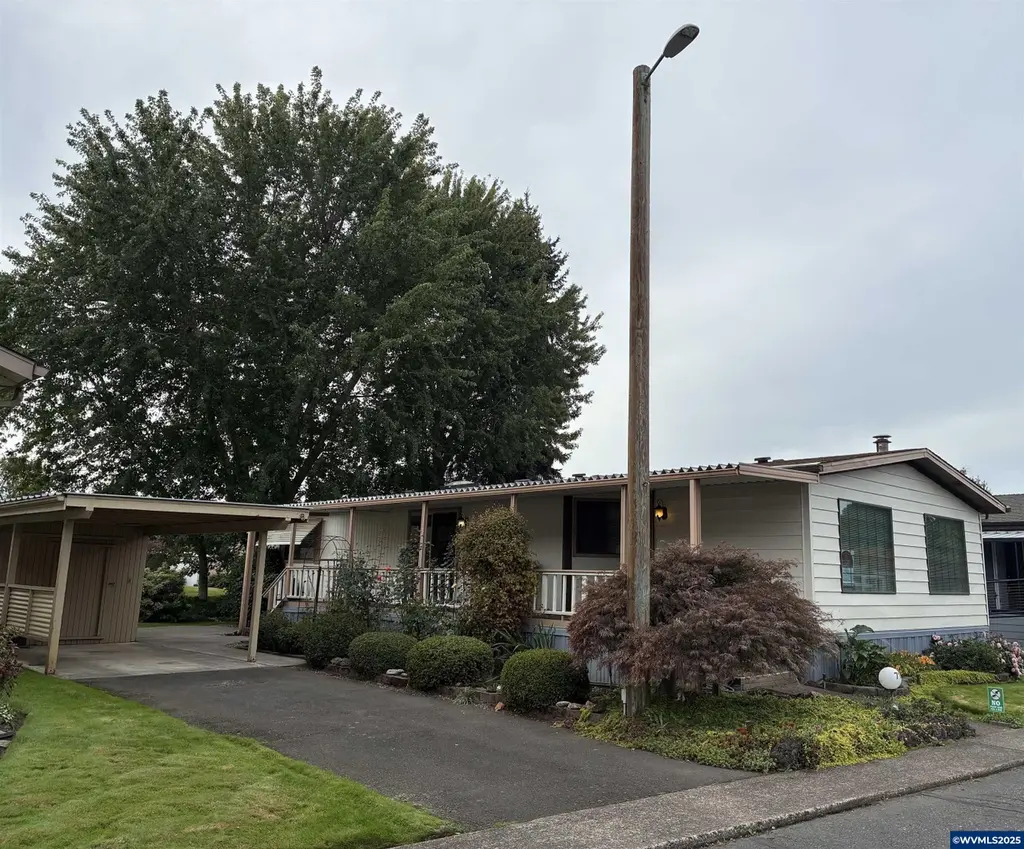
3100 Turner Rd SE #713 · Salem, OR
Flood risk 6/10 · Moderate
- FEMA flood zone
- X (unshaded)
- Chance of flooding over 30 yrs
- 0.97%
- Est. flood insurance / yr
- $507 – $1,088
Fire risk 3/10 · Minor
- Est. fire insurance / yr
- $498 – $926
Heat risk 3/10 · Minor
- Hot days now (above 92°F)
- 7 days/yr
- Hot days in 30 yrs
- 14 days/yr
Wind risk 1/10 · Minimal
- Chance of severe wind over 30 yrs
- —
Air-quality risk 9/10 · Severe
- Unhealthy air days now
- 12 days/yr
- Unhealthy air days in 30 yrs
- 13 days/yr
Risk factors via First Street. Map © Google.
Why this score? — see what drove the B- grade
The composite is a weighted blend of 9 inputs, each scored 0–100. Each bar is that input's sub-score; the figure is the points it added to the 100-point composite (weight × sub-score).
- Cash flow +30.0/30.0
- DSCR +10.0/10.0
- 1% rule +7.9/10.0
- ARV discount +6.4/15.0
- Livability +4.0/5.0
- Schools +3.7/10.0
- Rent growth +3.0/5.0
- Condition / age +2.5/5.0
- Appreciation +0.0/10.0
$139,900
🖨 Deal sheet 📄 Offer letter ✓ Due diligence
Listing remarks MLS
Your chance to own a doublewide in Paradise Island's 55+ park where $580/mo park rent is awesome for unbelievable amenities included! All appls stay; newer heat pump (heats/cools); circular kitchen; living & family rooms; both BRs w/ full BAs; lg covered deck to enjoy views all year; UGsprinklers in partially fenced yard; your own bridge across backyard creek to watch ducks & access clubhouse events; carport w/ oversized, divided shed & covered area.
Key facts
- Covered deck
- Soaking tub
- Pool
Tags
Neighborhood map
What this means for you Summary
Snapshot
- This is a 2-bed/2.0-bath manufactured listed at $140k.
Deal economics
- At list price, monthly cash flow is $549 ($7k/yr) — positive.
- The deal already cash-flows at list — no discount required.
- Meets the 1% rule at list price ($2k rent vs $140k).
- Recommended offer: $123k (12.0% below list) — sets the bar for market timing.
- Cap rate 11.0% vs local median 2.9% in Salem — top-decile yield for the area; either an underpriced asset or a hidden risk that comps aren't pricing in. Stress-test before assuming the spread holds.
Location & tenants
- Location reads 79/100 on livability (#59 in OR, #2,084 nationally) — a middle-class / working-renter tenant base. Strengths: amenities A+, commute A+, housing A+; Watch: schools D, crime F.
- Salem-Keizer SD 24J (urban): math 34% / reading 47% proficiency, ranked #103 of 183 in OR (top 56%) — families likely to look elsewhere, expect single-tenant / working-renter base with shorter leases.
- Market conditions: Rents rising (+1.8%/yr); 242 active listings in the ZIP; 11 comparable units currently listed for rent nearby; rentals at typical pace (median 24d on market — plan ~3-4 weeks tenant-placement turnaround); solid renter incomes; 1,591 units permitted in Marion County in 2024 (716 in 5+ unit buildings).
Forward outlook
- Local home prices are declining (-3.0%/yr); year-one equity from $967 of loan paydown is wiped out by about $4k of value loss. Plan a longer hold.
- Marion County population projected at +17% by 2050 — long-run rental-demand tailwind backs the buy-and-hold thesis.
- At projected returns (-3.0% appreciation + 1.8% rent growth), your $39k cash investment doubles in ~8 years — after that, you're playing with house money.
Negotiation context
- It's been on market 279 days — a 12% lower offer ($123k) is reasonable based on typical stale-listing flexibility.
Risks & watch-outs
- Climate carrying-cost: major flood risk — expect insurance premiums to compound above CPI over the hold.
Questions for the listing agent
- It's been on market 279 days. Have you received any prior offers? Is the seller open to a 12% concession, seller financing, or rate buy-down credit?
- Built in 1976 — when were the roof, HVAC, electrical panel, plumbing, and water heater last replaced?
- Why hasn't it sold? Are there any deal-killer items the seller is aware of (foundation, flood, title, zoning, code violations)?
- Is there a deadline driving the sale (1031 exchange, divorce, estate, relocation)? That informs how much negotiation room exists.
- Schools are D-rated, which usually means shorter tenancies and higher turnover. Who's the typical renter profile here, and what's been the actual vacancy rate?
- Crime grade is F in this area — have there been break-ins, vandalism, or insurance claims at this property in the last 3 years? What carrier currently insures it and at what premium?
- What's the average days-on-market for RENTAL listings here right now (not sales)? A rising rental-DOM trend means longer vacancies and softer asking-rent achievability than the comps imply.
- What's the recent tenant-quality profile in this submarket — average credit score on applications, eviction rate, late-payment / NSF rate, and stable-employment percentage? A property-management company in the area should have these aggregated.
- How much new for-sale + rental construction is in the pipeline within 1–3 miles? Heavy new supply typically softens prices + rents 12–24 months out; constrained supply supports both.
Investment metrics
- 1% rule
- 1.29% ✓
- Cap rate
- 11.01%
- Cash-on-cash
- 16.83%
- DSCR
- 1.75
- GRM
- 6.4
CMA / ARV
- ARV (median comp)
- $136,511
- List price
- $139,900
- Delta
- 2.48%
- Verdict
- FAIR
- Comps
- 20 within 1.0 mi
Show comp detail 12 sales within ~0.75 mi
| Address | Dist | Beds/Ba | Sqft | Sold | Price | $/sf | Match |
|---|---|---|---|---|---|---|---|
| 3100 Turner Rd S #220 | 0.00mi | 2/2.0 | 1,368 (+2%) | 1mo | $199,500 | $146 | 96 |
| 3100 Turner Rd SE #625 | 0.00mi | 3/2.0 (+1) | 1,377 (+2%) | 0mo | $235,000 | $171 | 90 |
| 3100 Turner Rd SE #424 | 0.00mi | 2/2.0 | 1,368 (+2%) | 10mo | $217,500 | $159 | 89 |
| 3100 Turner Rd SE #311 | 0.00mi | 3/2.0 (+1) | 1,368 (+2%) | 10mo | $155,000 | $113 | 84 |
| 3100 Turner Rd SE #206 | 0.00mi | 2/2.0 | 1,440 (+7%) | 8mo | $195,000 | $135 | 81 |
| 3180 Turner Rd SE | 0.13mi | 2/2.0 | 1,440 (+7%) | 5mo | $25,000 | $17 | 78 |
| 3100 Turner Rd SE #523 | 0.00mi | 2/2.0 | 1,152 (-14%) | 1mo | $132,000 | $115 | 75 |
| 3236 Turner Rd | 0.25mi | 3/2.0 (+1) | 1,440 (+7%) | 8mo | $125,000 | $87 | 65 |
| 3554 Turner Rd | 0.32mi | 3/2.0 (+1) | 1,188 (-12%) | 1mo | $130,000 | $109 | 60 |
| 2410 Lancaster Dr SE #962 | 0.68mi | 2/2.0 | 1,404 (+4%) | 8mo | $75,000 | $53 | 54 |
| 3474 Turner Rd SE | 0.45mi | 3/2.0 (+1) | 1,485 (+10%) | 6mo | $144,600 | $97 | 52 |
| 2410 Lancaster Dr SE #332 | 0.68mi | 2/2.0 | 1,426 (+6%) | 10mo | $98,000 | $69 | 50 |
Match score weights: distance 35% · size 25% · config 20% · recency 20%. Top-matched comps best support the ARV.
Projected returns pro-forma
-3.0% appreciation · 1.84% rent growth · sell at horizon
- IRR
- 6.8%
- Equity multiple
- 1.26×
- Total profit
- $10,207
- Equity at exit
- $20,860
- IRR
- 15.1%
- Equity multiple
- 2.16×
- Total profit
- $45,466
- Equity at exit
- $12,096
Cash invested: $39,172 (down + closing). Projections, not guarantees.
Landlord ↔ Tenant lean methodology
- Overall (STATE)
- 28 Tenant-Leaning
- State Oregon
- 28 Tenant-Leaning · D+6
- County
- — inherits STATE
- City
- — inherits STATE
ZIP-level market 97302
- Rents YoY
- 1.8%
- Active inventory
- 242
- Price-to-rent
- 6.4×
Monthly cashflow live
- Estimated rent
- $1,812 high interval (Pro) →
- Mortgage (P&I)
- −$734
- Tax from tax record
- −$90 /mo · $1,078/yr
- Insurance
- −$58
- HOA
- −$0
- Vacancy / Maint / Mgmt
- −$380
- Net cashflow
- $549
Break-even live
UW: 25.0% down · 7.5% · 30yr · 1.5% tax · 5.0% vac · 8.0% maint · 8.0% mgmt
Financing live
Cash to close
- Down payment
- $34,975
- Closing costs
- $4,197
- Reserves months
- —
- Total cash needed
- —
Loan-product check · same deal, 3 products live
Conventional
25% down · 7.5% · 30yr
- Down + closing
- —
- Monthly P&I
- —
- Monthly cashflow
- —
- DSCR
- —
- Eligible?
- —
Personal DTI + credit; lowest rate.
DSCR
20% down · 8.5% · 30yr
- Down + closing
- —
- Monthly P&I
- —
- Monthly cashflow
- —
- DSCR
- —
- Eligible?
- —
No personal income docs; deal must DSCR.
Hard money
10% down · 12.0% · 12mo
- Down + closing
- —
- Monthly P&I
- —
- Monthly cashflow
- —
- DSCR
- —
- Eligible?
- —
Short-term bridge; refi at stabilization.
Rent comps 11 comps
| Address | Beds | Baths | Sqft | Rent | $/sqft | DOM | Units | Dist |
|---|---|---|---|---|---|---|---|---|
| 2728 Lancaster Dr SE Unit 2728-14 Salem, OR | 2.0 | 1.5 | 1000 | $1,195 | $1.20 | 44d | 1 | 0.77mi |
| 4243 Campbell Dr SE Unit 4243 Salem, OR | 3.0 | 1.0 | 936 | $1,550 | $1.66 | 14d | 1 | 0.89mi |
| 1447 Connecticut St SE Salem, OR | 3.0 | 2.0 | 1258 | $2,675 | $2.13 | 44d | 1 | 1.06mi |
| 4665 Campbell Dr SE Salem, OR | 1.0–3.0 | 1.0–2.0 | 923 | $1,699 | $1.84 | 14d | 1 | 1.18mi |
| 2315 Strong Heights Ln SE Salem, OR | 2.0–3.0 | 2.0–2.5 | 1087 | $1,850 | $1.70 | 44d | 1 | 1.25mi |
| 3822 Bayonne Dr SE Salem, OR | 2.0 | 1.0 | 980 | $1,299 | $1.33 | 23d | 1 | 1.27mi |
| 3897 Meadowlawn Loop SE Salem, OR | 1.0–3.0 | 1.0–2.0 | 962 | $1,619 | $1.68 | 14d | 26 | 1.27mi |
| 3828 Bayonne Dr SE Salem, OR | 2.0 | 1.0 | 980 | $1,299 | $1.33 | 14d | 1 | 1.27mi |
| 1029 Raffon Ct SE Unit AR7171-3 Salem, OR | 2.0 | 1.5 | 927 | $1,700 | $1.83 | 23d | 1 | 1.41mi |
| 3955 Outward Rd SE Salem, OR | 1.0–3.0 | 1.0–2.0 | 970 | $1,824 | $1.88 | 14d | 20 | 1.41mi |
| 2087 Audubon Ave SE Salem, OR | 3.0 | 2.5 | 1325 | $3,725 | $2.81 | 23d | 1 | 1.46mi |
Listing history 19 events
-
2026-06-18days on market $139,900 Active 279 DOM
-
2026-06-17days on market $139,900 Active 278 DOM
-
2026-06-16days on market $139,900 Active 277 DOM
-
2026-06-15days on market $139,900 Active 276 DOM
-
2026-06-14days on market $139,900 Active 274 DOM
-
2026-06-10days on market $139,900 Active 271 DOM
-
2026-06-09days on market $139,900 Active 270 DOM
-
2026-06-08days on market $139,900 Active 269 DOM
-
2026-06-07days on market $139,900 Active 268 DOM
-
2026-06-03days on market $139,900 Active 264 DOM
-
2026-06-02days on market $139,900 Active 263 DOM
-
2026-06-01days on market $139,900 Active 262 DOM
-
2026-05-31days on market $139,900 Active 261 DOM
-
2026-05-30days on market $139,900 Active 260 DOM
-
2026-05-13price $139,900 468-char remark
Show marketing remark (468 chars)
Your chance to own a doublewide in Paradise Island's 55+ park where $580/mo park rent is awesome for unbelievable amenities included! All appls stay; newer heat pump (heats/cools); circular kitchen; living & family rooms; both BRs w/ full BAs; lg covered deck to enjoy views all year; UGsprinklers in partially fenced yard; your own bridge across backyard creek to watch ducks & access clubhouse events; carport w/ oversized, divided shed & covered area.
-
2026-01-16price $149,900 468-char remark
Show marketing remark (468 chars)
Your chance to own a doublewide in Paradise Island's 55+ park where $580/mo park rent is awesome for unbelievable amenities included! All appls stay; newer heat pump (heats/cools); circular kitchen; living & family rooms; both BRs w/ full BAs; lg covered deck to enjoy views all year; UGsprinklers in partially fenced yard; your own bridge across backyard creek to watch ducks & access clubhouse events; carport w/ oversized, divided shed & covered area.
-
2025-11-12price $159,900 468-char remark
Show marketing remark (468 chars)
Your chance to own a doublewide in Paradise Island's 55+ park where $580/mo park rent is awesome for unbelievable amenities included! All appls stay; newer heat pump (heats/cools); circular kitchen; living & family rooms; both BRs w/ full BAs; lg covered deck to enjoy views all year; UGsprinklers in partially fenced yard; your own bridge across backyard creek to watch ducks & access clubhouse events; carport w/ oversized, divided shed & covered area.
-
2025-09-25price $169,900 468-char remark
Show marketing remark (468 chars)
Your chance to own a doublewide in Paradise Island's 55+ park where $580/mo park rent is awesome for unbelievable amenities included! All appls stay; newer heat pump (heats/cools); circular kitchen; living & family rooms; both BRs w/ full BAs; lg covered deck to enjoy views all year; UGsprinklers in partially fenced yard; your own bridge across backyard creek to watch ducks & access clubhouse events; carport w/ oversized, divided shed & covered area.
-
2025-09-12$174,900 Active 468-char remark
Show marketing remark (468 chars)
Your chance to own a doublewide in Paradise Island's 55+ park where $580/mo park rent is awesome for unbelievable amenities included! All appls stay; newer heat pump (heats/cools); circular kitchen; living & family rooms; both BRs w/ full BAs; lg covered deck to enjoy views all year; UGsprinklers in partially fenced yard; your own bridge across backyard creek to watch ducks & access clubhouse events; carport w/ oversized, divided shed & covered area.
ⓘ Source: listings_history table (triggers on properties + properties_extension) + one-shot
backfill from property_details.listing_events for pre-trigger history.
Tax reassessment forecast OR · Resets to sale price
- Current annual tax
- $1,078 · $90/mo
- Projected year-2 tax
- $1,357 · $113/mo
- Expected delta
- +$280/yr (+$23/mo · 25.9%)
ⓘ Screening estimate from a state-policy table — verify with the county assessor before closing.
Climate risk First Street
- Flood 6/10 Major FEMA zone X (unshaded) · 97% chance over 30 yrs
- Wildfire 3/10 Moderate
- Heat 3/10 Moderate 7 d/yr ≥92°F today · 14 d/yr by 30 yrs out
- Wind 1/10 Low
- Air quality 9/10 Extreme 12 unhealthy d/yr today · 13 by 30 yrs out
Nearby sold comps map
Loading sold comps map…
Walkable amenities ~0.75 mi
Loading nearby amenities…
Taxation est. · year 1
- Rental income
- $21,739
- − Mortgage interest
- −$7,837
- − Property taxes
- −$1,078
- − Insurance
- −$700
- − Repairs & maintenance
- −$1,739
- − Management
- −$1,739
- − Depreciation
- −$4,070
- Taxable income
- $4,577
- Est. tax owed @ 24.0%
- −$1,099
- After-tax cash flow
- $5,494/yr
For passive investors: Depreciation is non-cash, so a rental often shows a tax loss while cash-flowing — sheltering income. Rental losses are passive: they offset passive income freely, and up to $25,000/yr can offset ordinary (W-2) income if you actively participate and your MAGI is under $100k (phasing out to $0 by $150k); unused losses carry forward. On sale, claimed depreciation is recaptured at up to 25%, and gains may owe capital-gains tax (a 1031 exchange can defer both). Figures are a year-1 estimate at your 24.0% rate — not tax advice; consult a CPA.
Schools (NCES district)
- District
- Salem-Keizer SD 24J
- NCES district ID
- 4110820
- Math proficiency
- 34% ▼ -1.00%
- Reading proficiency
- 47% ▼ -2.00%
- Median HH income
- $48,632
- Composite
- 37.16/100
- National rank
- #9017
- State rank
- #103 of 183 in OR
Livability — Salem
- Score
- 79/100
- State rank
- #59
- US rank
- #2084
Category grades
Schools grade is shown separately in the Schools card above.
Census & demographics
- Census place
- Salem, OR
- County
- Marion County · 258,219 people
- City population
- 193,601
- Metro
- Salem, OR
- Population (ZIP)
- 40,799
- Household income
- $85,833
- Rent vs Own
- Severe rent burden
- 1754.0
Population outlook (Marion County) Hauer SSP2
- Today (2025)
- 360,940 people
- By 2030
- 375,178 · +3.9%
- By 2040
- 400,914 · +11.1%
- By 2050
- 422,187 · +17.0%
- By 2075
- 460,305 · +27.5%
- By 2100
- 464,025 · +28.6%
Race, ethnicity, and origin ACS 2023
- Neighborhood character
- Predominantly White (77%)
- Race & ethnicity
- White 77% Hispanic / Latino 12% Two or more races 10% Black 2% Pacific Islander 1% Asian 1%
- Hispanic origin (detail)
- Mexican 10%
- Common ancestry
- Italian 4% Slovak 4% Portuguese 3%
- Foreign-born
- 6% · Canada, South Korea
- Languages at home
- 90% English-only · Spanish 6% Other Asian/Pacific 1%
Political lean MEDSL · Marion
- 2024 margin
- Toss-up / Even · D 47.5% · R 49.5% · Other 3.0%
- 2008→2024 swing
- -4.2pp toward R · 2008: 2.2pp · 2024: -2.0pp
- All cycles
- 2024: R+2.0 2020: D+1.1 2016: R+5.0 2012: R+3.5 2008: D+2.2
Not yet ingested
- Civics
- —
Market trends
- HPI YoY
- ▼ -382.78%
- Current HPI
- 296.7837
- Rent YoY
- ▲ 1.84%
- Metro
- Salem, OR
- State GDP YoY
- ▲ 2.05%
- F500 in state
- 2
Industry mix (Fortune 500 HQ in OR)
| Industry | F500 HQs | Revenue |
|---|---|---|
| Consumer Goods | 1 | $51B |
|
||
Price history
-20.0% since first listed5 events — show timeline
- 2026-05-13 Price Changed $139,900 WVMLS
- 2026-01-16 Price Changed $149,900 WVMLS
- 2025-11-12 Price Changed $159,900 WVMLS
- 2025-09-25 Price Changed $169,900 WVMLS
- 2025-09-12 Listed $174,900 WVMLS
Property tax history
+1.9%/yrLatest (2025): $1,078 · +7.7% YoY. Source: county tax records.
Cash-flow waterfall
monthlySold comps — $/sqft
last 12 mo · ≤1 miLoading sold comps…